Prosiding Seminar Kebangsaan Aplikasi Sains dan Matematik 201 3 (SKASM2013) Batu Pahat, Johor, 29 - 30 Oktober 2013
IMPROVED RSSI LOCALIZATION ALGORITHM WITH
VIRTUAL REFERENCE TAGS
Mohd Shamian ~ainal', Hadi ~bdullah', Ijaz ~ h a n ' , Hanvaj Mhd ~oad', Siti Zarina ~ u j i ' , Moharnad Md
om',
Azmi ~idek'' ~ m b e d d e d Computing Systems (EmbCos), Department of Computer Engineering, Faculty of Electrical and Electronics Engineering, Universiti Tun Hussein Onn Malaysia, 86400 Parit Raja, Batu Pahat,
Johor
[email protected], [email protected], [email protected], [email protected], [email protected], [email protected], [email protected]
This conference proceeding presents an extension of our previous research on localization algorithm with Virtual Reference Tags (VRTs). VRTs are virtual tags that are mapped over a particular surveillance area. Each tag has its own stored information which is used by system as a reference point to track the target. In multistatic radar scenario with one transmitting and three receiving nodes are used to locate and track the intruder. Ultra Wide Band (UWB) pulses are transmitted and their reflections by intruder are received at three receivers. Received Signal Strength Indicator (RSSI) algorithm is used to process the received signal. VRTs not only provide solution to synchronization problems but also provide a platform where clutters due to object other than target can be easily removed by adding information in VRTs. These specific tags can indicate themselves as clutters, which can be identified by the system. Lastly we use Network Simulator 2 (NS2) to simulate and conclude the use of VRTs as clutter removal technique.
Keywords: Multistatic radar, Received signal strength Indicator (RSSI), Surveillance area, Clutter, Virtual reference tags (VRTs).
1. INTRODUCTION
Technology advances as well as wireless sensor networks (WSNs). Due to its vast applications, these types of networks became popular over the past years. WSNs mainly consist of a number of sensor nodes for surveillance over a specific region. These nodes can have hfferent state depending on design of the algorithm. The main methods or algorithms used by localization systems are Received Signal Strength Indicator (RSSI), Angle of Arrival (AoA), Time (Difference) of Arrival (ToAITDoA). Auto-organization, scalability, robustness and efficient are the key requirements of localization systems. Focusing on these requirements, this paper presents a localization technique which uses RSSI and modifies it with Virtual Reference Tags (VRTs). Reference tagging concept is introduced which is commonly used in WID systems(Ni, Dian, & Souryal, 201 1). Reference tags are used in some narrow band tracking systems providing reference to track intruder or object. These systems use a number of sensor nodes. Reference tags are symmetrically placed over the surveillance area and a tag is given to the intruder while entering in surveillance area(Ni, et
al., 2011). There are number of limitations to these kinds of systems. For example for an unknown intruder with no tags cannot be localized, positioning of actual reference tags symmetrically over surveillance area makes the system complicated, greater number of sensor nodes are used making these system suitable only in case of limited surveillance area. Clutters have always been a hurdle in radar designs which limit their use to specific regions. Many complex methods are present for clutter removal in different cases(Zhao Li, 2012),(Nigam, 2010). Due to their complexity and inefficiency these techniques have less accuracy when applied in UWB radar sensor network. In this paper we have given an improved radar algorithm design which virtualizes reference tags and their information is kept in receiving nodes. Secondly number of sensor nodes are reduced to four (having one transmitting node and three receiving nodes), and RSSI tracking techniques is
used in which there is no need of intruder to carry a tag. Whenever intruder arrives in surveillance area it is monitored with RSSI localization technique and VRTs provide reference point closest to actual intruder location. This algorithm design has no synchronization problem (like in ToA) and has greater accuracy than RSSI. Further objects in surveillance area other than target can also be identified by using indicating closest VRT to object with a flag.
2. RESEARCH METHODOLOGY
2.1 Reveived Signal Strength Indicator (RSSI)
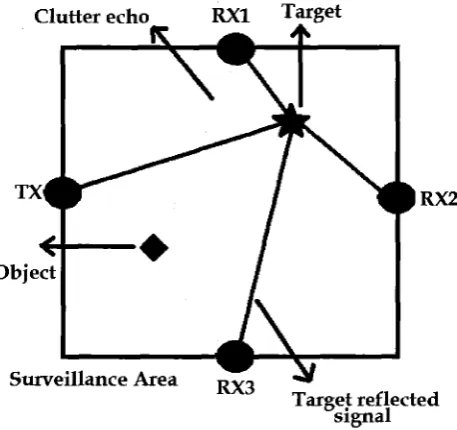
In this technique the strength of the signal which is reflected fiom the target is measured at all corresponding receivers. If we consider an ideal case each measurement of the signal strength at receivers will give the &stance of receiver fiom the target. But in RSSI the accuracy decreases in case of multi path fading environment and shape of circle gets distorted. So it becomes difficult to get an exact intersection of distorted circles. This can produce a considerable amount of error in the target positioning (Gigl, Janssen, Dizdarevic, Witrisal, & Irahhauten, 2007),(Hatami, Pahlavan, Heidari, & Akgul, 2006). Figure 1 shows RSSI localization sensario with three receivers.
Prosiding Seminar Kebangsaan Aplikasi Sains dan Matematik 2013 (SKASM2013) Batu Pahat, Johor, 29 - 30 Oktober 2013
2.2 Radar Clutters
The term clutter is used for unwanted echoes in radar systems. For different types of radar clutter type can be different. In our case these echoes occur due to reflection fi-om any object (car, building, animal, pole etc) other then the target present in surveillance area. Figure 2 shows how clutter occurs due to objects.
Fig. 2. Clutter effect in radar systems
2.3 Virtual Reference Tags (VRTs)
To overcome drawbacks in RSSI techniques our design uses RSSI along with VRTs(Mohd Shamian Zianal, 2012). These VRTs contain information about the characteristics of target reflected received signal in respective three receivers. Each VRT has its own information. In our design we are using multistatic radar system with one transmitter and three receivers. Each VRT has measured distance form its location to three receivers and received signal strength of three receivers considering location of VRT as target location.
3. CLUTTER REMOVAL WITH VRTS
[image:3.522.115.344.212.427.2]Objects and their
nearest
VETS
RX 1Fig. 3. Objects in the surveillance area mapped with VRTs.
The VRTs with flags in their information can now indicate the presence of an object clutter. Once objects are identified their echo can be matched and ignored by the receivers. VRTs mapping for different surveillance area can be done while installing the radar system or VRTs can be reprogrammed when some part of surveillance area is changed.
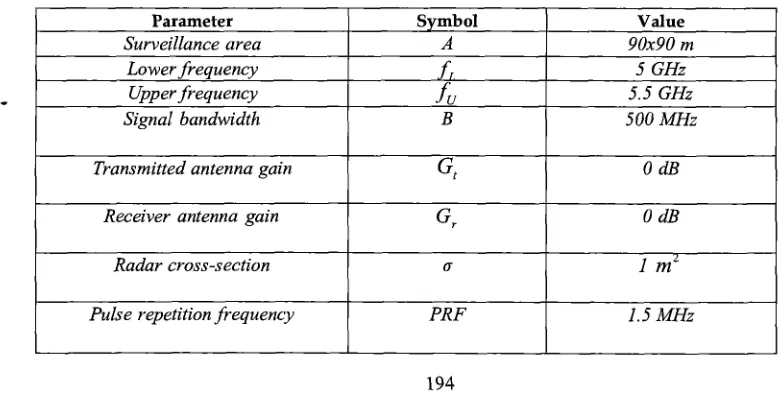
4. SYSTEM DESIGN
Once TX-RXs are placed at their location, virtual reference tags are planned at different positions within the surveillance area. The number of VRTs can vary in different configurations depending on radar design and characteristics of surveillance area. The system parameters for the radar design are shown in table 1.
Table1
.
System Parameters ParameterSurveillance area Lower frequency
Upper frequency Signal bandwidth
Transmitted antenna gain
Receiver antenna gain
Radar cross-section
Pulse repetition frequency
Symbol A
f
Lfu
B
Gt
G,
o
PRF
Value 90x90 m
5 GHz 5.5 GHz 500 MHz
0 dB
0 dB
I
inL
[image:4.534.78.468.520.718.2]Prosiding Seminar Kebangsaan Aplikasi Sains dan Matematik 2013 (SKASM2013) Batu Pahat, Johor, 29 - 30 Oktober 2013
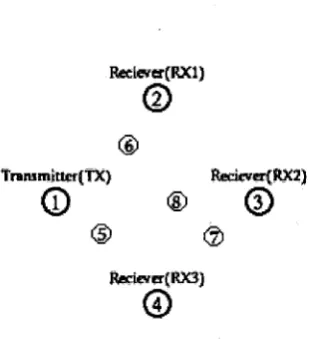
[image:5.518.149.308.194.364.2]After setting the parameters of system, we design radar in Network Simulator 2(NS2). Figure 4 shows the simulation start of the radar design.
Fig. 4. Radar simulation in NS2.
5. EXPERIMENTAL RESULTS
The surveillance area is set as 90x90 meters. TX-RXs area placed at the edges of surveillance area represented by node 1, 2, 3 and 4. Node 0 represents target which will move in the surveillance area. Nodes 5, 6, 7 and 8 represent objects in the surveillance area which produce clutters. The number of VRTs will vary keeping the path of target and location objects same.
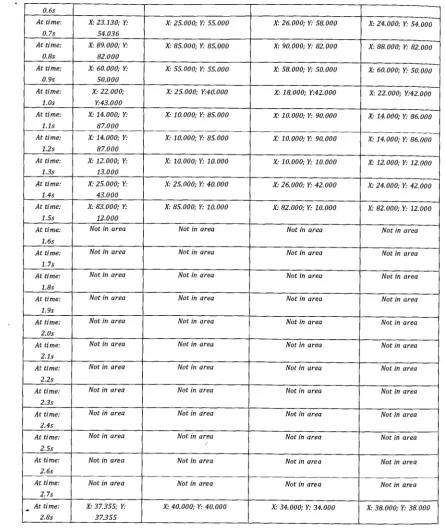
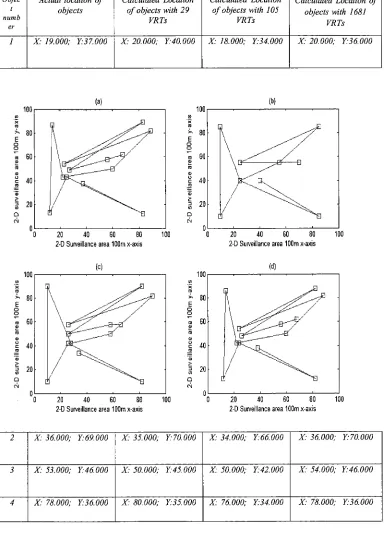
The actual path and detected path of target using 29, 105 and 1681 VRTs are shown in table2.
Table 2. Actual and calculated target path with 29, 105 and 1681 VRTs
Calculated path
with
1681 VRTs
Not in area
X: 68.000; Y: 62.000
X: 56.000; Y: 58.000
X: 26.000; Y: 48.000
X: 82.000; Y: 88.000
Not in area
Time
At time: 0.1s
At time: 0.2s At time:
0.3s
At time: 0.4s
At time: 0.5s
At time:
Actual Path
Not in area
X: 6 7.51 7; Y: 61.988 X: 56.000; Y:
58.000
X: 27.000; Y: 49.000 X: 83.000; Y:
89.000
Not in area
Calculated path with 29 VRTs
Not in area
X: 70.000; Y: 55.000
X: 55.000; Y: 55.000
X: 25.000; Y: 55.000
X: 85.000; Y: 85.000
Not in area
Calculated path with 105
VRTs
Not in area
X: 66.000; Y: 58.000
X: 58.000; Y: 58.000
X: 26.000; Y: 50.000
X: 82.000; Y: 90.000
0.6s
At time: 0.7s
At time: 0.8s
At time: 0.9s
At time: 1.0s
At time: 1.1s
At time:
1 .2s
At time:
1.3s
I
13.000 At time:1.4s At time:
1.5s
At time:
X: 23.130; Y: 54.036 X: 89.000; Y:
82.000
X: 60.000; Y: 50.000 X: 22.000;
E43.000
X: 14.000; Y: 87.000 X: 14.000; Y:
87.000
X. 12.000; Y:
1.6s (
X: 25.000; Y: 55.000 X: 85.000; Y: 85.000
X. 55.000; Y: 55.000
X: 25.000; Y:40.000
X: 10.000; Y: 85.000
X: 10.000; K. 85.000
X: 10.000; Y: 10.000
X: 26.000; Y: 58.000
X: 90.000; Y: 82.000
X: 58.000; U: 50.000
X: 18.000; Y:42.000
X: 10.000; Y: 90.000
X: 10.000; Y: 90.000 X: 10.000; Y: 10.000
X: 25.000; Y: 43.000 X: 83.000; Y:
12.000 Not in area
At time: 1.7s
X: 24.000; Y: 54.000 X: 88.000; Y: 82.000
X: 60.000; Y: 50.000
X: 22,000; Y:42.000
X: 14.000; Y: 86.000
X: 14.000; Y: 86.000 X: 12.000; K. 12.000
At time: 1.8s
2.0s
~t time:
I
Not in areaI
Not in area Not in area Not in areaX 25.000; Y: 40,000
X: 85.000; Y: 10,000
Not in area
Not in area
At time: 1.9s
Not in area
At time:
X: 26.000; Y: 42.000
X: 82.000; Y: 10.000
Not in area
Not in area
Not in area
2.1s
X: 24.000; Y: 42.000
X: 82.000; Y: 12.000
Not in area
Not in area
Not in area
At time: 2.2s
[image:6.548.62.508.57.586.2]At time:
Figure 5 shows the graphical comparison of the actual and three detected path in different VRTs.
Also in three different cases objects detection is shown in table 3. Not in area
Not in area
Not in area
I
Not in area Not in area Not in area2.3s
At time: 2.4s
At time: 2.5s
At time: 2.6s
At time: 2.7s
At time: 2.8s
Not in area
Not in area
Not in area
Not in area
Not in area
Not in area
Not in area
Not in area
Not in area
Not in area
X: 37.355; Y: 37.355
Not in area
Not in area
Not in area
Not in area
Not in area
Not in area
Not in area
Not in area
X: 40.000; Y: 40.000
Not in area Not in area
Not in area
Not in area
Not in area
Not in area
X: 34.000; Y: 34.000
Not in area
Not in area
Not in area
Not in area
Prosiding Seminar Kebangsaan Aplikasi Sains dan Matematik 2013 (SKASM2013) Batu Pahat, Johor, 29 - 30 Oktober 2013
100 (a) 100 (b)
m .- m
X
P 80
I
0 0
0 20 40 60 80 100 0 20 40 60 a0 100
2-0 Surveillance area 100m x-axis 2-D Surveillance area l00m x-axis
Table 3. Actual and detected locations of objects.
(c)
100 100 (4
Y1 m
.-
X
S
.- X'P 'P n
80 .
'>
80. 1,E
0 0 E
D D
m 60. m 60.
?! E'
0
E 4 0 .
0 0
0 20 40 60 80 100 0 20 40 60 80 100
2-D Surveillance area l00m x-axis 2-D Surveillance area l00m x-axis
objec t
numb er
I
Calculated Location of objects with 105
VR Ts X: 18.000; F34.000
Calculated Location of objects with 1681
VR Ts X: 20.000; F36.000 Actual location of
objects X: 19.000; F37.000
Calculated Location of objects with 29
[image:7.516.37.426.159.699.2]Fig. 5. Target movement in 2-D surveillance area of 90x90 meters, (a) Actual path of target, (b)
Calculated target path with 29 VRTs, (c) Calculated target path with 105 VRTs, (d) Calculated target path with 1681 VRTs.
From table 2 and 3 we came to know that increasing number of VRTs also increases accuracy of the system and for a surveillance area of 100x100 meters if we make 2500 VRTs we can monitor target path with 0.2 meter accuracy. By increasing VRTs from 2500 we can get even more accurate results and also their vast application made them improve radars application in vehicles (Hadi Abdullah, APRIL 2013). Clutters in previous researches are also identified by keeping track of still reflected signals(Gaikwad, Singh, & Nigam, 2011; Zhao, Xijing, Wenzhe, & Jianqi, 2012). In our research still reflected signals are processed and are matched with the nearest VRT having radar crossection closest to the received signal. This not only help in identifying clutter signals but also provides location of clutter objects.
6. CONCLUSION
In our study we have seen a hybrid design that uses virtual reference tags and how these tags affect the performance of our design. VRT has provided us with a new ground on which we can check measure and improve our radar system performance. These radar systems can be very efficient in places where high level security is required and only cameras don't provide enough security. Specially in case when there is fog or misty night one can't only rely on cameras. Also covering an area of 100x100 meters with cameras for security is a difficult issue. Our design can be easily implemented on FPGAs, giving and extra advantage of being low cost. m s makes our design best for use in places like airports, hospitals, nuclear reactors, jails etc.Clutters in our case are defined to be objects of any nature which can reflect the signal with some specific strength to receivers. These reflected signals can be identified by using VRTs. When VRTs are mapped on surveillance they have information whch provides reference to three receivers about target and receivers consider target location to be the nearest VRT. Similarly these VRTs while mapping also contain a flag which can identify presence of object other than target. The nearest VRT to the object contains a flag that identifies receivers the location of object. The application of VRTs in clutter removal does not limit their use in radars. With little modification they can be implemented in many other radar fields like road safety in vehicles, under water radar systems of submarines, radars in battle tanks to identify location of enemy tank etc.
Acknowledgments
Prosiding Seminar Kebangsaan Aplikasi Sains dan Matematik 2013 (SKASM2013) Batu Pahat, Johor, 29 - 30 Oktober 2013
References
Gaikwad, A. N., Singh, D., & Nigam, M. J. (201 1). Application of clutter reduction techniques for detection of metallic and low dielectric target behind the brick wall by stepped frequency continuous wave radar in ultra-wideband range. Radar, Sonar & Navigation, IET, 5(4), 416- 425.
Gigl, T., Janssen, G. J. M., Dizdarevic, V., Witrisal, K., & Irahhauten, Z. (2007, 22-22 March 2007). Analysis of a
LVB
Indoor Positioning System Based on Received Signal Strength. Paper presented at the Positioning, Navigation and Communication, 2007. WPNC '07. 4th Workshop on.Hadi Abdullah, I. K. a. M. B. Z. (APRIL 2013). Low cost Ultra Wide Band hybrid radar design using virtual reference tags as road safety feature in vehicles. J O W A L OF INFORMATION AND COMMUNICATION TECHNOLOGLES, 3(Issue 4).
Hatami, A., Pahlavan, K., Heidari, M., & Akgul, F. (2006, 3-6 April 2006). On RSS and TOA based indoor geolocation - a comparative performance evaluation. Paper presented at the Wireless Communications and Networking Conference, 2006. WCNC 2006. IEEE.
Mohd Shamian Zianal, H. A. a. I. K. (2012). Ultra Wide Band localization and tracking hybrid technique using VRTs. International Journal of Integrated Engineering, 4(3).
Ni, L. M., Dian, Z., & Souryal, M. R. (2011). RFID-based localization and tracking technologies.
Wireless Communications, IEEE, 18(2), 45-51.
Nigarn, A. N. G. D. S. M. J. (2010). Application of clutter reduction techniques for detection of metallic and low dielectric target behind the brick wall by stepped frequency continuous wave radar in ultra-wideband range. IET Radar, Sonar and Navigation.
Zhao, L., Xijing, J., Wenzhe, L., & Jianqi, W. (2012, 4-8 June 2012). A wavelet-based strong clutter removal technique for UKB life detection. Paper presented at the Ground Penetrating Radar (GPR), 2012 14th International Conference on.