CHARACTER AND OBJECT RECOGNITION BASED ON
GLOBAL FEATURE EXTRACTION
MARYAM NAEIMIZAGHIANI1 , SITI NORUL HUDA SHEIKH ABDULLAH 2, FARSHID PIRAHANSIAH 3 , BILAL BATAINEH4,
Pattern Recognition (PR) Research Group, Center for Artificial Intelligence Technology (CAIT), Faculty of Information Science and Technology (FTSM), Universiti Kebangsaan
Malaysia (UKM), 43600 Bangi, Selangor Darul Ehsan, Malaysia.
E-mail: [email protected] , [email protected], [email protected], [email protected]
*Corresponding Author: Siti Norul Huda Sheikh Abdullah
ABSTRACT
Optical character recognition (OCR) is one of the most important fields in pattern recognition world which is able to recognize handwritten characters, irregular characters and machine printed characters. Optical character recognition system consists of five major tasks which are involved pre-processing, segmentation, feature extraction, classification and recognition. Generally, less discriminative features in global feature approach leads to reduce in recognition rate. By proposing a global approach that produces more discriminative features and less dimensionality of data, these problems are overcome. Two feature extraction methods are studied namely Gray Level Co-occurrence Matrix (GLCM) and edge direction matrix (EDMS) and combination of two popular feature extraction methods is proposed. The most important problem of EDMS is the number of produced features with this method which is just 18 features and is not enough for feature extraction purpose and it causes reducing the recognition rate. The aim of this research is improving the recognition rate of EDMS by combining with a global feature extraction method in order to increase the number of extracted feature and produce better recognition rate. The proposed method is a combination of GLCM and EDMS method with and without feature selection method called gain ratio and ranker search which applied to reduce the dimensionality of data. They have been tested onto four different datasets involving manually and automatically cropped licence plate and font style images amounting 3520 images from 0 to 9 and capital letter A to Z with various size and shape. Another dataset is large binary images of shapes which involve 300 images of objects. Then, gain ratio and ranker search are used to select discriminative features whereby the features reduced from 58 to 34 numbers of features. The proposed combinatory method, EDMS and GLCM methods are classified using neural network, Bayes network and decision tree. The experimental results for character recognition indicate that the proposed combinatorial method obtain better average accuracy rate about 85.99% whereas EDMS, GLCM and combination without feature selection achieved 80.19%, 38.84%, and 58.78% subsequently and the experimental results for object recognition indicates that proposed method before and after feature selection outperformed other methods such as EDMS and GLCM with 90.83% and 92.5% accuracy rate respectively with NN as the classifier. Consequently global and spatial approaches are compared in recognition of objects and characters. The experimental results show the better performance of proposed method as a global feature extraction method for object recognition purpose with 92.5% accuracy rate with NN while Robinson filter as a spatial feature extraction method outperformed the global feature extraction methods for character recognition purpose with 100% accuracy rate with NN. Also global approach obtains smaller processing time comparing to spatial approach.
Keywords: Feature Extraction, Character Recognition, Image Processing, OCR, Global Feature
Extraction
1. INTRODUCTION
Optical character recognition (OCR) that firstly has been proposed by Gustav Tauschek in 1929 is
convert the handwritten or printed character image to the machine encoded text [1]. Generally character recognition system consists of five major tasks which are involved pre-processing, segmentation, feature extraction, classification and recognition.Pre-processing includes thresholding and determining the size and aspect ratio of images that has been normalized. Thresholding is applied to the images for removing the noises and separating background and foreground[2] Image segmentation is the next critical step which is used to cluster the pixel of image in order to provide information for the surface of the image [3, 4]. Feature extraction that comes after image segmentation has been applied in order to extract all the useful characteristic of character features and reduce the number of errors in character recognition process. The number of feature extraction methods which are available is considerable but identifying the best feature extraction technique for the purpose of character recognition is an important issue in image processing in order to achieve to the high accuracy in character recognition although the feature extraction method performance depends on the classifier that has been applied for the specific application [1, 5].Some global feature extraction methods that produces less discriminative features [6, 7] leads to reduce in recognition rate. Edge Direction Matrix (EDMS) is a novel global feature extraction method [8, 9] that produces a set of global features. The most important problem of EDMS is the number of produced features with this method which is just 18 features and is not enough for feature extraction purpose and it causes reducing the recognition rate. The aim of this research is improving the recognition rate of EDMS by combining with a global feature extraction method in order to increase the number of extracted feature and produce better recognition rate. Among the statistical feature extraction methods, Gray Level Co-occurrence Matrix (GLCM) is the most common statistical approach to global feature extraction techniques and is based on the spatial distribution of the values in image [6, 7] which has the most in common with EDMS comparing to other feature extraction methods. Some features of GLCM such as contrast, homogeneity, mean and correlation can affect the recognition rate of EDMS, when combine with the existing features of EDMS. By combining two global feature extraction methods the recognition rate can be improved and more discriminative features is extracted. High dimensionality of data in proposed combinatory method is the other problem which leads to higher processing time. Feature selection eliminates the
features that reduce the recognition rate and also decrease the dimensionality of feature vector which speed up the recognition process.
This paper is aimed to propose and develop a combinatory feature extraction method based on global feature extraction methods such as Edge Direction Matrix (EDMS) and Gray Level Co-occurrence Matrix (GLCM) in order to reach to the better recognition rate and reduce the number of errors in character recognition process. A comparative study for the application of the spatial and global feature extraction methods in recognition of objects and characters is performed. For this purpose Robinson filter as a spatial feature extraction method applied to large binary shape images dataset for object recognition and automatically cropped license plate images dataset for character recognition as well as proposed method after and before feature selection as a global feature extraction method.
All methods have been applied to license plate, font style and large binary images of shapes
datasets. The proposed feature extraction method
has been tested on Malaysia license plate images [10, 11] and font style images dataset which contains 3520 images from 0 to 9 and capital letter A to Z for acquiring the results of new enhanced feature extraction method and comparing to other methods. For evaluating the proposed work for object recognition purpose, one standard dataset of objects has been applied which involves large number of different objects which has been collected by the LEMS Vision Group at Brown University, under Professor Ben Kimia [12]. This dataset has been applied as the test dataset in different researches [13-16]. The proposed feature extraction method is running as an off-line system. The dataset contains 3520 images from 0 to 9 and capital letter A to Z with different size and shape. The feature extraction method is programmed by Microsoft Visual basics (VB.net) based on Windows XP and the classification has been done by WEKA application.
2. STATE OF THE ART
these interest points [8, 17]. The issue is that the local interest points and the region around them maybe are vague because of the poor image condition or small object in the image [5, 18-21]. Global feature extraction that drives the features from the shape of the word contour is able to reduce this vagueness by stressing on the all possible sub windows of the geometric form of images. In global feature extraction approach words are treated as a whole object and recognition is based on the features that are extracted from a word as a whole [22]. Another category of feature descriptors is spatial feature extraction techniques that commonly extract the spatial information such as texture, size, shape, orientation, position and so on. This type of feature extractor considers the spatial relationship between pixels and is based on a moving window or kernel [23]. This part is divided into two categories which are global and spatial feature extraction methods.
2.1 Global Feature Extraction
Gray Level Co-occurrence Matrix (GLCM) method is a statistical feature extraction method for global feature extraction that has been proposed by [6, 7]. This method has been applied in various texture feature extraction. GLCM is based on a matrix that shows the distribution of occurrences in selected image. This method involves a statistical approach with a co-occurrence matrix which is able to describe a second order statistics for texture
images. A gray-level co-occurrence matrix
(GLCM) involves a two-dimensional histogram that i,j indicates the frequency of i occurs with event j. P(i, j, d, θ) indicates the co-occurrence matrix frequency and d is the distance for a pair of pixels. The direction is specified by θ which is with gray level i and j and angle θ can be 0°, 45°, 90°, and 135.The area of the texture is considered
rectangular and has Nc pixels in the horizontal
direction and Nr resolution cells in the vertical
direction. In each resoulution cell the gary tone is defined by Ng levels. The horizontal spatial domain is defined by Lc = {1,2,…,Nc} and vertical spatial domain is defined by Lr = {1,2,…,Nr}and the set of
Ng quantized gray tones is defined by G =
{1,2,…,Ng}. The set of (Lr × Lc) is defined as the set of resolution cells of the image which are ordered by their row-column description. The image I can be represented as a function which assigns some gray tone in G to each Resolution cell
of Lr × Lc. The representation of unnormalized
frequencies with different angles are as follows:
P (i, j, d, 0) = #{((k,1),(m,n)) ∈ (Lr × Lc) ×(Lr × Lc),
k −m=0 ,
} ) , ( , ) , (
,I k l i I m n j d
n
I− = = =
(1)
P (i, j, d, 45) = #{((k,1),(m,n)) ∈ (Lr × Lc) ×(Lr ×
Lc)(k −m=d) ,
(2) j} = n) I(m, i, = l) I(k, ,
d) ,
( )
(− − =− − =
=
−n d or k m d I n
I
P (i, j, d, 90) = #{((k,1),(m,n)) ∈ (Lr × Lc) ×(Lr ×
Lc), k −m=d ,
j} = n) I(m, i, = l) I(k, , 0
= −n
I (3)
P (i, j, d, 135) = #{((k,1),(m,n)) ∈ (Lr × Lc) ×(Lr ×
Lc), (k −m=d) ,
d) ,
(
) − =− − =−
=
−n d or k m d I n
I ,I(k,l)
=i,I(m,n)=j} (4)
By applying equations 1 until 4, the Co-occurrence matrix is built which- explains the occurrence of any pair of two pixels which are gray scale. The total- number of features which extracted based on co-occurrence matrix is 36 and involves angular second moments, entropy, maximum probability, contrast, correlation, homogeneity, mean, variance and energy with angles 0, 45, 90 and 135 respectively. This method is one of the most common methods in global feature extraction while it produces indiscriminative features which reduce the recognition rate. Another global feature extraction techniques namely EDMS, discussed about a feature extraction method for optical font recognition that is Arabic calligraphy script image proposed by [8, 9]. The problem of EDMS is the number of produced features with this method which is just 18 features and is not enough for feature extraction purpose and it causes reducing the recognition rate but comparing to other existing feature extraction methods, it produces considerable recognition rate. The result of the proposed method had been compared with the Gray Level Co-occurrence Matrix (GLCM) method. A matrix which involves eight neighbourhood kernels has been applied in order to produce the Edge direction matrix. Second pixel has been considered for this purpose and the relationship between the second pixel and eight neighbourhoods create the matrix in order to find the first order relationship and second order relationship. Note that the second
pixel value (EDM1(2,2)) is equal to the number of
pixel neighbourhood association and the position is 0 to 315 degree. By calculating the- occurrence of
EDM1 values, the relationship of pixel values can
be determined by- considering edge image for each pixel within two pixels in all directions. The second order matrix which is 3 × 3 considered as an edge direction matrix- and contains the relationship presentation of each pixel. By measuring the
occurrence of each value in EDM2 the most
important pixel relationships were identified. In case of having more than one angle with same occurrence number the smaller angle is selected firstly and other smaller pixel is chosen respectively. By applying these two matrixes, various features can be extracted such as edge direction, homogeneity with angles 0, 45, 90, 135, weight, pixel regularity and- edge regularity with angles 0, 45, 90, 135, 180, 225, 270 and 315 which are 18- features totally. According to the experimental results, EDMS performed better than- the GLCM method and reach to the considerable performance which was 97.85% by- applying the decision tree as the classifier. The EDMS method which was applied to- the Arabic calligraphy script image shows a considerable improvement in comparison to the GLCM, so in for the purpose of performing comparative study on the feature- extraction methods but still needs more improvement to increase the recognition rate and eliminate some indiscriminative features.
2.2 Spatial Feature Descriptor
Spatial feature extraction techniques commonly extract the spatial information such as texture, size, shape, orientation, position and so on. This type of feature extractor considers the spatial relationship between pixels and is based on a moving window or kernel [23]. Robinson compass mask is one of the gradient edge detection filters which determine the direction of a pixel by applying the template that matches the best local area of the pixel and can be considered as a spatial feature extraction technique [24]. These operators consists of eight kernels for each pixel which produced by rotating one kernel based on its coefficients circularly. Robinson filter coefficients consist of 0, 1, and 2, and while zeros corresponds to the line direction. Robinson mask is defined by taking a single kernel and rotating it to the eight directions which are North, Northwest, West, Southwest, South, Southeast, East, and Northeast respectively.
Figure 1: Robinson Mask from Eight Directions
Figure 1 shows the Robinson mask from eight directions. If GS, GSE, GE, GNE, GN, GNW, GW, and
GSW represents gradients along South, South-East,
East, North-East, North, North-West, West and South-West directions respectively then the
maximum of calculated gradients is called edge
magnitude which is calculated as follows:
Gmax = max {GS, GSE, GE, GNE, GN, GNW, GW,
GSW} (5)
This edge magnitude is the maximum value at each pixel which is calculated by the convolution of each mask in the image so the local edge direction is calculated with the kernel that produced the maximum magnitude [25-29]. For the purpose of feature extraction from the edge detected by the Robinson filters, the straight pixel is considered as the features in this research while it has been normalized by dividing to 255, because the intensity of a pixel for a gray scale image lies between 0 to 255.
[Feature = Gmax/ 255] (6)
In this trend the total number of extracted features is depend on the number of the pixels in image. For example if the image is 10×10, the total number of extracted features for this image by Robinson filter would be 100 features. The recognition rate of this feature extraction method is considerable while the high dimensionality of data is one of the limitations of this method which leads to high processing time. In this research the Robinson filter has been applied as a spatial feature extraction method in order to compare the performance of the spatial and global feature extraction methods for different application such as object recognition and character recognition. For this purpose the large binary images dataset and manually cropped license plate images dataset
which given the best results among others [30] have been applied as the input dataset.
3. STATE OF THE ART
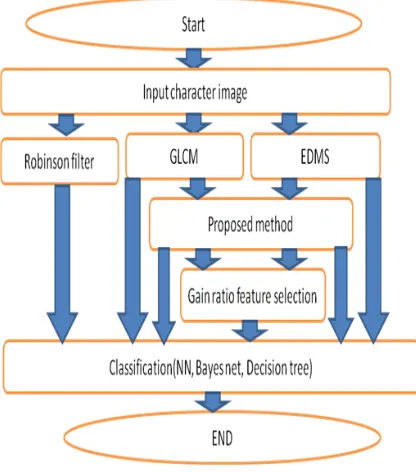
[image:5.612.328.515.231.305.2]For developing an enhanced feature extraction method, all features of mentioned datasets has been extracted by applying EDMS and GLCM method and performed classification with three different classifier such as neural network, bayes network- and decision tree. Then, the features of EDMS and GLCM have been combined to develop the proposed combinatory feature extraction technique. The extracted features have been classified but the results were not acceptable, therefore feature selection has been performed in order to eliminate unfavourable features. The method that has been used for feature selection is gain ratio. Classification results indicated an improved accuracy comparing to EDMS and GLCM. Figure 2 illustrates the framework of proposed technique.
Figure 2: The Proposed Feature Extraction Method Framework
After extracting the features of license plate and font style images by applying EDMS and GLCM method, the combinatory method based on these two global feature extraction methods is developed. The extracted features of EDMS and GLCM are combined and the proposed method is represented with 54 features. In the primitive phase data
Collection has been performed and four datasets as the input character images has been collected which involve license images, font style and one standard dataset which is the large binary images of objects and all the preprocessing and segmentation part has been done before. Character Datasets involve numbers from 0 to 9 and capital letter A to Z and object dataset involves 10 different categories of objects. The sample of input character images are given in figures 3-7.
Figure 3: Sample of Malaysian License Plate Vehicles
Figure 4: Manually Cropped License Plate Images
[image:5.612.98.306.361.597.2]Figure 5: Automatically Cropped Malaysian Car License Plate Images
Figure 6: Font style image (characters and numbers with seven different font style)
Figure 7: large binary images with different categories such as aliens, ancient weapons and animal head
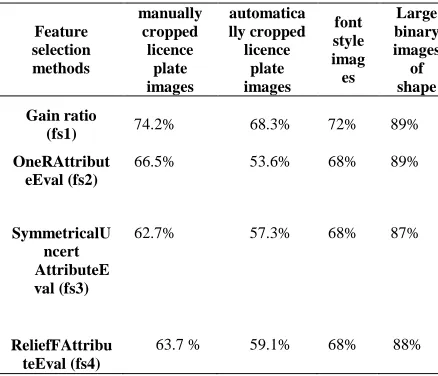
[image:5.612.322.518.585.666.2]proposed method experimental results with 54 features is not acceptable because of the existence of some irrelevant features that decreased the overall accuracy. In order to eliminate the unnecessary features, the gain ratio feature selection technique is performed. In order to identify the best feature selection method for the proposed feature extraction method in term of accuracy, some experiment has been performed which are observable in table 1 Four different
feature selection such as gain ratio[31-33],
OneRAttributeEval[34-36],
SymmetricalUncertAttributeEval [35, 37, 38] and
ReliefFAttributeEval [35, 36, 39] have been
experimented with four different datasets. Decision tree is chosen as the classifier and
[image:6.612.310.543.260.544.2]all experiments have been performed with 60% of training dataset. The search method for all experiment is ranker search with 27 features to select. Also, the parameters of classifier have been optimized by applying the CVParameterSelection method provided in WEKA which can optimize over an arbitrary number of parameters, with only one drawback apart from the obvious explosion of possible parameter combinations [40].
Table 1: Feature Selection Methods Evaluation
Feature selection methods
manually cropped
licence plate images
automatica lly cropped
licence plate images
font style imag
es
Large binary images of shape
Gain ratio
(fs1) 74.2% 68.3% 72% 89% OneRAttribut
eEval (fs2)
66.5% 53.6% 68% 89%
SymmetricalU ncert AttributeE val (fs3)
62.7% 57.3% 68% 87%
ReliefFAttribu teEval (fs4)
63.7 % 59.1% 68% 88%
It is percept from table 1 that gain ratio outperforms among all four experimented feature selection method and has better performance comparing to other experimented feature selection method, as a result, gain ratio is applied in this research for the purpose of feature selection. In order to show the common selected feature for all four feature selection techniques, the venn diagram has been drawn which is observable in figure 3.14. The original features of proposed method which
[image:6.612.85.304.412.600.2]were 54 have been decreased to 27 features by applying the gain ratio attribute selection techniques ratio. The gain ratio codes was based on WEKA data mining package with the ranker search which has -1.79 as the threshold value which is default threshold value for WEKA and 27 attribute to select. Table 2 indicates the feature that has been selected with gain ratio method.
Table 2: Features of Proposed Method after Performing Gain Ratio
4. EMPERIMENTS AND RESULATS
The main objective of this research is to develop a combinatory feature extraction method for reaching to the better accuracy comparing to EDMS and GLCM for license plate recognition, font style images and large binary images of shapes. Numbers of feature extraction techniques is available but choosing the appropriate method for the specific application is an important issue.
In this paper available feature extraction methods has been studied and two feature extraction methods which are EDMS and GLCM has been chosen. EDMS is a novel feature extraction method
Type of features
Features of proposed method with different angles
0° 45° 90° 135° 180° 225° 270° 315°
Contrast (GLCM)
√ √ √ √
Homogeneity (GLCM)
√
Mean (GLCM)
√ √ √ √
Correlation (GLCM)
√
Homogeneity (EDMS)
√ √ √
Edge regularity (EDMS)
√ √ √ √ √ √ √ √
Edge direction (EDMS)
√
Weight (EDMS)
√
Pixel regularity (EDMS)
that is proposed recently [8, 9] and is a statistical feature extraction method that applies the statistical descriptions to the observed elements in the image. Statistical methods are the most used texture analysis methods because they are easy to approximate to the different images and reliable for different types of textures and applications. Among the statistical feature extraction methods, GLCM is the most common statistical approach to global feature extraction techniques and is based on the spatial distribution of the values in image which has the most in common with EDMS comparing to other feature extraction methods.
Afterwards, the datasets which involves license plate images, font style and one standard dataset which is the large binary images of objects has been collected while all the preprocessing and segmentation part has been done before. Character Datasets involve numbers from 0 to 9 and capital letter A to Z and object dataset involves 10 different categories of objects. The license plate images of Malaysian vehicle has gotten from previous researches [41, 42], font style image is scanned from 50 different font styles and applied for feature extraction purpose and large binary images of shapes has been collected by the LEMS Vision Group at Brown University, under Professor
Ben Kimia [12]. Input character images has been
applied to EDMS and GLCM methods and performed classification and then the features of these two methods has been combined in order to develop a new feature extraction method. The result of classification phase was not sufficient comparing to EDMS and GLCM, so gain ratio feature selection technique is applied in order to eliminate the indiscriminative features which reduce the accuracy. After performing feature selection the accuracy improved and reached to the better
accuracy comparing to EDMS and GLCM.In order
to test the performance of the proposed method also perform a comparative study on the global and spatial feature extraction method for object and character recognition purpose, one standard dataset which is large binary dataset has been applied and some experiment has been done on this standard dataset that proves the performance of the proposed method. The results have been compared with one spatial feature extraction method such as Robinson filter [24]. In order to evaluate the performance of the proposed method and comparing to EDMS and GLCM performance some classification techniques such as Multi-layer neural network with back propagation (MLP), Bayes network and decision tree (J48) has been applied. The main important
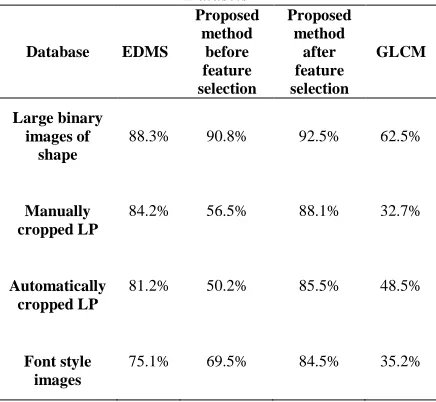
[image:7.612.309.527.365.566.2]reason for choosing these classifiers is related to the type of experimental dataset which is multiclass dataset with 35 classes and the classifiers that can work on the multiclass dataset must be appliedas well. All codes were based on WEKA data mining package with default parameters for each algorithm and experiment has been carried out by using 60% for training and 40% for testing data set. Three methods are tested with different splitting percentage from 50% to 60% in order to indicate the reason for choosing the 60% training data set as the basis of all experiments.. In order to evaluate the performance of the proposed method and comparing to EDMS and GLCM performance some classification techniques such as Multi-layer neural network with back propagation (MLP), Bayes network and decision tree (J48) has been applied. Table 3 indicates the results of experimented method with different datasets and neural network as the classifier, because the best results is gotten from neural network classifier.
Table 3: Results of Experimented Methods with Input Datasets
Database EDMS
Proposed method
before feature selection
Proposed method
after feature selection
GLCM
Large binary images of
shape
88.3% 90.8% 92.5% 62.5%
Manually cropped LP
84.2% 56.5% 88.1% 32.7%
Automatically cropped LP
81.2% 50.2% 85.5% 48.5%
Font style images
75.1% 69.5% 84.5% 35.2%
In this section some experiments has been done in order to perform a comparative study on the performance of global and spatial feature extraction methods for object and character recognition purpose. The results of proposed method on the large binary dataset has been compared to robinson filter which is a spatial feature extraction method on the same dataset and the performance of global and spatial feature extraction for character recognition is invistigater and one character dataset which is manually cropped dataset is applied as the test dataset and the results of proposed method and robinson filter is compared for the mention dataset in order to recognize the capability of methods for character recognition. Table 4 indicates the results of robinson filter and proposed method before and after feature selection with neural network as the classifier.
Table 4: Results of the Comparative Study for Global and Spatial Feature Extraction Methods
Data base
Proposed method
before feature selection
Proposed method after feature
selection
Robinson filter
Large binary images of
shape
90.8% 92.5% 88.6%
Manually cropped LP
images
50.2% 85.3% 99.8%
Table 4 shows the results of a comparative study for the application of the spatial and global feature extraction methods in recognition of objects and characters is performed. For this purpose Robinson filter as a spatial feature extraction applied to large binary shape images for object recognition and automatically cropped license plate images for character recognition as well as proposed method after and before feature selection as a global feature extraction method. The experimental results show the better performance of proposed method as a global feature extraction method for object recognition purpose while Robinson filter as a spatial feature extraction method outperformed the global feature extraction methods for character recognition purpose. As a result, it is arguable that global feature extraction methods are more appropriate for object recognition while spatial feature extraction methods have better performance for character recognition.
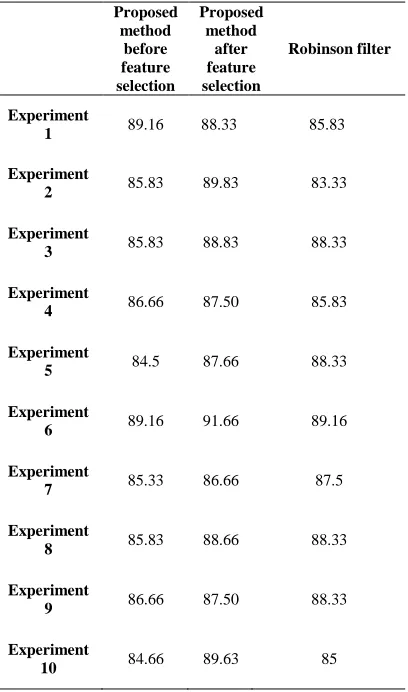
In order to analyze the consistency of the results, the ten experiments results of decision tree classifiers has been applied for proposed method before feature selection, proposed method after feature selection and Robinson filter with 60% training dataset. The experiment is repeated ten times and the results are shown in table 5. The database for all analysis is the large binary image of shapes.
Table 5: Overall Results of Ten Experiments with Decision Tree Classifier and 60% Training
Proposed method
before feature selection
Proposed method
after feature selection
Robinson filter
Experiment
1 89.16 88.33 85.83
Experiment
2 85.83 89.83 83.33
Experiment
3 85.83 88.83 88.33
Experiment
4 86.66 87.50 85.83
Experiment
5 84.5 87.66 88.33
Experiment
6 89.16 91.66 89.16
Experiment
7 85.33 86.66 87.5
Experiment
8 85.83 88.66 88.33
Experiment
9 86.66 87.50 88.33
Experiment
10 84.66 89.63 85
[image:8.612.89.302.342.480.2]4.1 Statistic Analysis for Proposed Method before Feature Selection and Robinson Filter
[image:9.612.87.299.274.354.2]In this section, the 10 overall experimental results of proposed method before feature selection with Robinson filter based on table 5 are compared. In descriptive statistic analysis for each method, mean, standard deviation and standard error is calculated for 10 experiment values proposed in table 4.31 and the results is shown in table 6.
Table 6: Statistic Analysis for Result of 10 Experiments with Decision Tree
Method N o Mean
Std. Deviation
Std. Error Mean
Proposed method before feature
selection
10 86.3620 1.63684 0.51761
Robinson filter 10 86.9970 1.89144 0.59812
As table 6 indicates, the mean of value for proposed method before feature selection is 86.36% which is slightly lower than robinson filter with value of 86.99. Standard deviation for proposed method is around 1.63 which is lower than Robinson filter with value of 1.89. It proves that proposed method experimental results are more constant comparing to Robinson filter experimental results. Standard error mean value for Robinson filter is around 0.59 which is higher than proposed method standard error mean value with 0.51 approximately. It indicates that proposed method produced less error rate comparing to Robinson filter method and proposed method results is more confident. In order to run more analysis, independent sample T-test is performed and the results are shown in table 7.
Table7: Independent Samples Test for Proposed Method and Robinson Filter
Levene's Test for Equality
of Variances
t-test for Equality of Means
F Sig. t df Sig.
(2-tailed)
Mean Difference
Std. Error Difference
95% Confidence Interval of
the Difference
Lower Upper Equal
variances assumed
0.7 0.3 -.8 18 .43 -.635 .791 -2.2 1.02
Equal variances
not assumed
-.8 17.6 .43 -.635 .791 -2.2 1.02
Based on the table 7, the p-value of Levene’s test for equality of variance is 0.394 which is higher than the threshold value which is 0.05, therefore, the equality of variances can be considered for analysis. In order to test the equality of means, the statistics in the first row is considered for analysis. As it is observable, the mean difference in the first row is -0.635. This value is between lower and upper triggers of 95% confidence interval of the difference which is in the range of [-2.29682, 1.02682] but this range contain 0 and two-tailed p-value of the test is 0.433 which is higher than 0.05. Consequently, there is no significant difference in mean for statistics of accuracy between proposed method and Robinson filter method and the test is not so significant. It shows that proposed method and Robinson filter with decision tree as the classifier worked at the same level and results are same to some extent.
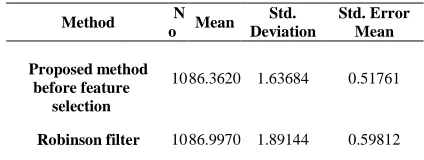
4.2 Statistic Analysis for Proposed Method after Feature Selection and Robinson Filter
Table 8: Statistic Analysis for Result of 10 Experiments with Decision Tree
Method No Mean Std. Deviation
Std. Error Mean
Proposed method after fs
10 88.6260 1.45782 .46100
Robinson filter 10 86.9970 1.89144 .59812
As table 8 indicates, the mean of value for proposed method is 88.62 which is higher than Robinson filter with value of 86.99. It shows that proposed method is more accurate compared to Robinson filter. Standard deviation for proposed method is around 1.45 which is lower than Robinson filter with value of 1.89. It proves that proposed method experimental results are more constant comparing to Robinson filter experimental results. Standard error mean value for Robinson filter is around 0.59 which is higher than proposed method standard error mean value with 0.46 approximately. It indicates that proposed method produced less error rate comparing to Robinson filter method and proposed method results is more confident. In order to run more analysis, independent sample T-test is performed and the results are shown in table 9.
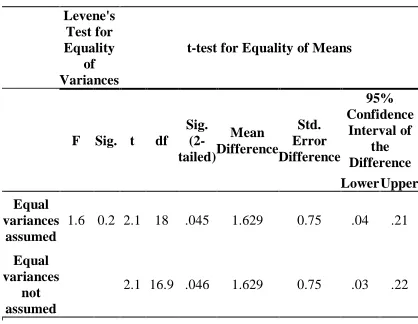
Table 9: Independent Samples Test for Proposed Method and Robinson Filter
Levene's Test for Equality
of Variances
t-test for Equality of Means
F Sig. t df Sig.
(2-tailed)
Mean Difference
Std. Error Difference
95% Confidence
Interval of the Difference Lower Upper
Equal variances
assumed
1.6 0.2 2.1 18 .045 1.629 0.75 .04 .21
Equal variances
not assumed
2.1 16.9 .046 1.629 0.75 .03 .22
According to results which are shown in table 9, the p-value of Levene’s test for equality of variance is 0.214 which is higher than the threshold value which is 0.05, therefore, the equality of variances can be considered for analysis. In order to test the equality of means, the statistics in the first row is considered for analysis. As it is observable, the mean difference in the first row is 1.62. This value falls between lower and upper triggers of 95%
confidence interval of the difference which is in the range of [0.4245, 3.21555]. The range of 95% confidence interval of the difference does not contain 0 and it shows that the test is significant. In addition, two-tailed p-value of the test value is 0.045which is lower than 0.05 confidently. As a conclusion, there is a difference in mean of accuracy between the overall results of proposed method and Robinson filter method and the proposed method produces higher accuracy compared to Robinson filter.
5. CONCLUSION
[image:10.612.89.298.453.615.2]method as a global feature extraction method for object recognition purpose with 92.5% accuracy rate with NN while Robinson filter as a spatial feature extraction method outperformed the global feature extraction methods for character recognition purpose with 100% accuracy rate with NN. As a result, it is arguable that global feature extraction methods are more appropriate for object recognition while spatial feature extraction methods have better performance for character recognition. The processing time of global and spatial feature extraction has been compared as well. The experimented Spatial feature extraction method is extremely time consuming to compare with global feature extraction methods, because it produces more features and has high dimensionality of data and takes more time for process. With applying the global feature extraction methods, the dimensionality of data is reduced and the classification performance increased.
The proposed feature extraction might be applied in other image processing application such as handwritten image recognition, printed images and so on. One of the objectives for future works in this research is to increase the recognition rate by modifying the selected features and to develop this method in other areas of research. As far as the good performance of this method on recognition of special characters with circle and curve, this property can be improved and applied for recognition of the complex characters in complex text. The proposed method before and after feature extraction can be applied for the object recognition while it produced better results for object recognition comparing with other experimented methods.
REFRENCES:
[1] X. Jianhong, "Optical Character
Recognition Based on Least Square Support Vector Machine," in Intelligent Information Technology Application, 2009. IITA 2009. Third International Symposium on, 2009, pp. 626-629.
[2] F. PirahanSiah, S. N. H. S. Abdullah, and
S. Sahran, "Comparison single thresholding method for handwritten images segmentation," in Pattern Analysis and Intelligent Robotics (ICPAIR), 2011 International Conference on, 2011, pp. 92-96.
[3] S. N. H. S. Abdullah, F. PirahanSiah, N.
H. Zainal Abidin, and S. Sahran,
"Multi-threshold approach for license plate recognition system," presented at the International Conference on Signal and Image Processing WASET Singapore August 25-27, 2010 ICSIP 2010, 2010.
[4] F. PirahanSiah, S. N. H. S. Abdullah, and
S. Sahran, "Adaptive image segmentation based on peak signal-to-noise ratio for a license plate recognition system," in Computer Applications and Industrial Electronics (ICCAIE), 2010 International Conference on, 2010, pp. 468-472.
[5] S. N. H. S. Abdullah, M. Khalid, R. Yusof,
and K. Omar, "Comparison of Feature Extractors in License Plate Recognition," in Modelling & Simulation, 2007. AMS '07. First Asia International Conference on, 2007, pp. 502-506.
[6] R. M. Haralick, "Statistical and structural
approaches to texture," Proceedings of the IEEE, vol. 67, pp. 786-804, 1979.
[7] R. M. Haralick, K. Shanmugam, and I. H.
Dinstein, "Textural Features for Image
Classification," Systems, Man and
Cybernetics, IEEE Transactions on, vol. 3, pp. 610-621, 1973.
[8] B. Bataineh, S. Abdullah, and K. Omar,
"A Statistical Global Feature Extraction Method for Optical Font Recognition," in Intelligent Information and Database Systems. vol. 6591, N. Nguyen, C.-G. Kim, and A. Janiak, Eds., ed: Springer Berlin / Heidelberg, 2011, pp. 257-267.
[9] B. Bataineh, S. N. H. S. Abdullah, and K.
Omar, "A novel statistical feature
extraction method for textual images: Optical font recognition," Expert Systems with Applications, 2011.
[10] S. N. H. S. Abdullah, M. Khalid, and K.
Omar, "Performance Comparison of License Plate Recognition System Using Multi-Features and SVM " Asia-Pacific Journal of Information Technology and Multimedia, pp. 53-62, 2011.
[11] J. C. Niebles Duque, "Extracting Moving
People and Categorizing their Activities in Video," Ph.D. 3445572, Princeton University, United States -- New Jersey, 2011.
[12] B. Kimia. (2002). large database of closed
binary shapes collected by the LEMS Vision Group. Available: http://www.lems.brown.edu/~dmc/
[13] X. Chen and I. Ahmad, "Shape-Based
<i>k</i>-Means Clustering and Neural Networks
Advances in Image and Video Technology." vol. 4872, D. Mery and L. Rueda, Eds., ed: Springer Berlin / Heidelberg, 2007, pp. 893-904.
[14] S. Hingway and K. Bhurchandi, "An
Improved Shock Graph for an Improved Object Recognition," Cyber Journals: Multidisciplinary Journals in Science and Technology: Journal of Selected Areas in Software Engineering (JSSE), 02 (05),??-??. 2011.
[15] S. Hingway and K. Bhurchandi, "A Simple
Graph Theoretic Approach for Object Recognition," 2011, pp. 200-205.
[16] R. Qureshi, J.-Y. Ramel, and H. Cardot,
"Graph Based Shapes Representation and Recognition
Graph-Based Representations in Pattern Recognition." vol. 4538, F. Escolano and M. Vento, Eds., ed: Springer Berlin / Heidelberg, 2007, pp. 49-60.
[17] M. Naeimizaghiani, S. N. H. S. Abdullah,
F. PirahanSiah, and B. Bataineh, "Character recognition based on global feature extraction," Journal of Theoretical and Applied Information Technology, vol. 51, 2013.
[18] K. Murphy, A. Torralba, D. Eaton, and W.
Freeman, "Object detection and localization using local and global features," Toward Category-Level Object Recognition, pp. 382-400, 2006.
[19] T. Yamamoto, "Applying tissue models in
teleoperated robot-assisted surgery," Ph.D. 3463573, The Johns Hopkins University, United States -- Maryland, 2011.
[20] M. Asgari, M. Shahverdy, F. Pirahansiah,
and Z. Mahdavi, "TafreshGrid: Grid computing in Tafresh university," in Communication Software and Networks (ICCSN), 2011 IEEE 3rd International Conference on, 2011, pp. 83-85.
[21] K. J. Cannons, "On Region Tracking
Unification: A Common Framework and Spatiotemporal Oriented Energy Feature Representation," Ph.D. NR80559, York University (Canada), Canada, 2011.
[22] B. V. Dhandra and M. Hangarge, "Global
and Local Features Based Handwritten Text Words and Numerals Script Identification," in Conference on Computational Intelligence and Multimedia Applications, 2007.
International Conference on, 2007, pp. 471-475.
[23] S. M. Abdallah, D. C. Asmar, and J. S.
Zelek, "A benchmark for outdoor vision SLAM systems," Journal of Field Robotics, vol. 24, pp. 145-165, Jan-Feb 2007.
[24] G. S. Robinson, "Edge detection by
compass gradient masks," Computer Graphics and Image Processing, vol. 6, pp. 492-501, 1977.
[25] K. Sudeep and J. Majumdar, "A Novel
Architecture for Real Time Implementation of Edge Detectors on
FPGA," International Journal of
Computer Science, vol. 8, 2011.
[26] X. Zhang, "Manifold learning for
video-based human motion estimation," Ph.D. 3460097, Oklahoma State University, United States -- Oklahoma, 2011.
[27] T. Peli and D. Malah, "A study of edge
detection algorithms," Computer Graphics and Image Processing, vol. 20, pp. 1-21, 1982.
[28] R. H. Park, "Complex-valued feature
masks by directional filtering of 3× 3 compass feature masks," Pattern Analysis & Applications, vol. 5, pp. 363-368, 2002.
[29] R. H. Park, "One-dimensional frequency
domain interpretation of complex compass gradient edge masks," Electronics Letters, vol. 34, pp. 2021-2022, 1998.
[30] M. Naeimizaghiani, Siti Norul Huda
Sheikh Abdullah, B. Bataineh, and F. PirahanSiah, "Character recognition based on global feature extraction," presented at the 3rd International Conference on Electrical Engineering and Informatics (ICEEI 2011), Bandung, Indonesia, 2011.
[31] I. Guyon and A. Elisseeff, "An
introduction to variable and feature
selection," The Journal of Machine
Learning Research, vol. 3, pp. 1157-1182, 2003.
[32] M. A. Hall and L. A. Smith, "Practical
feature subset selection for machine learning," 1998.
[33] T. Li, C. Zhang, and M. Ogihara, "A
comparative study of feature selection and multiclass classification methods for tissue classification based on gene expression," Bioinformatics, vol. 20, pp. 2429-2437, 2004.
[34] S. A. A. Balamurugan and R. Rajaram,
for large-scale data using Bayes’
theorem," International Journal of
Automation and Computing, vol. 6, pp. 62-71, 2009.
[35] M. Indra Devi, R. Rajaram, and K.
Selvakuberan, "Automatic Web Page Classification by Combining Feature Selection Techniques and Lazy Learners," 2007, pp. 33-37.
[36] C. Y. Ting, K. C. Khor, and S.
Phon-Amnuaisuk, "Features and Bayesian Network Model of Conceptual Change for INQPRO," 2010, pp. 305-309.
[37] E. Roglia, R. Cancelliere, and R. Meo,
"Classification of chestnuts with experiments on feature selection and noise," Citeseer2007.
[38] J. B. Steck, "Netpix: A method of feature
selection leading to accurate sentiment-based classification models," Central Connecticut State University, 2005.
[39] D. Roglia and R. Meo, "A Composite
Wrapper for Feature Selection," 2008.
[40] Nor Hanisah Zainal Abidin, Siti Norul
Huda Sheikh Abdullah, Shahnorbanun Sahran, and F. PirahanSiah, "License Plate Recognition With Multi-Threshold Based on Entropy," presented at the International Conference on Electrical Engineering and Informatics, Bandung, Indonesia, 2011.
[41] S. N. H. S. Abdullah, F. PirahanSiah, M.
Khalid, and K. Omar, "An evaluation of classification techniques using enhanced Geometrical Topological Feature Analysis," presented at the 2nd Malaysian Joint Conference on Artificial Intelligence (MJCAI 2010), Malaysia, 2010.
[42] S. N. H. S. Abdullah, M. Khalid, R. Yusof,
and K. Omar, "license plate recognition based on geometry features topological analysis and support vector machine," presented at the Malaysia-Japan International Symposium on Advanced Technology 2007 (MJISAT2007), Kuala Lumpur, 2007.