Comparative Study of Seismic Performance of a Building with and
without P-Delta Effect Using Response Spectrum Analysis
Ravishankar V Lawate
1Prof. Vishwanath.B.Patil
21
M.Tech Student
2Professor
1,2
Department of Civil Engineering
1,2
Poojya Doddappa Appa College of Engineering Kalaburagi, India
Abstract—The G+20 multi storey regular building is taken
for present study. This building is modeled and analyzed by using ETABS V9.7.4. Assuming the material property as linear and non linear. The performance of the building is studied by comparing the base shear, displacement, storey drift in response spectrum analysis. Multi-storey buildings with open (soft) ground floor are inherently vulnerable to collapse due to earthquake load, even then their construction is still widespread in the developing nations. An investigation has been performed to study the behavior of the columns at ground level of multi-storey buildings with soft ground floor as satellite bus stop and moment transfer beams in all storey subjected to earthquake loading. The structural action of masonry infill panels of upper floors has also been taken into account by modeling them as diagonal struts. Shear wall is one of the most commonly used lateral load resisting in high rise building. In this study building is modeled with different shapes of shear wall with top and bottom soft storey. Key words: Soft Storey, P-delta effect, Equivalent Diagonal Strut, Moment Transfer Beams, Shear Wall
I. INTRODUCTION
Earthquakes are natural hazards under which disasters are mainly caused by damage or collapse of buildings. Objective of seismic analysis is stated as the structure should be able to endure minor shaking intensity without sustaining any damage, thus leaving the structure serviceable after the event. Lateral forces can produce the critical stresses in a structure and in addition cause lateral sway of the structure. Many buildings constructed in recent times have a special feature that the ground stories are left open for the purpose of parking, reception etc. Such buildings are often called open ground storey buildings or buildings on stilts. The strength demand on the column in the first storey for these building is large, upper stories move almost together as a single block and most of the horizontal displacement of the building occurs in the soft ground storey. Reinforced concrete building can adequately resist both horizontal and vertical load. Whenever there is requirement for a multistory building to resist higher value of seismic forces, lateral load resisting system such as shear wall should be introduced in a building. Vertical plate like RC wall introduced in building in addition to beam, column and slab are called shear wall. Shear walls are incorporated in building to resist lateral forces and support the gravity loads. RC shear wall has high in plane stiffness. Positioning of shear wall has influence on the overall behavior of the building. For effective and efficient performance of building it is essential to position shear wall in an ideal location. Many researchers have investigated on changing position of shear wall location to determine parameter like storey shear, time period, storey acceleration
II. P-DELTA EFFECT
Any structural model will deflect when it is loaded. A deflected structure may encounter significant secondary moments because the ends of the members have changed position. To illustrate this, consider the simple cantilevered column example shown below.
Fig.1
In this example, a column of length L is encountering an axial load (P) and a lateral load (V). In a standard linear static analysis. This second-order behavior has been termed the P-Delta effect since the additional overturning moments on the column are equal to the sum of story weights “P” times the lateral displacements “Delta”. The P-Delta effect is a destabilizing moment equal to the force of gravity multiplied by the horizontal displacement a structure undergoes when loaded laterally.
P-Delta effects are caused due to geometric non-linearity and for this reason a P-Delta Analysis is often called a Non-Linear Analysis.
P-Delta effects usually become prevalent in tall structures that are experiencing gravity loads and lateral displacement (due to wind or other forces). If the lateral displacement and/or the vertical axial loads through the structure are significant then a P-Delta Analysis should be performed to account for the non-linearities. In many cases a
linear static analysis can severely
underestimate displacement among other results compared to a P-Delta (Non-Linear) Analysis.
In some sense, the P-Delta effect is similar to the buckling load.
III. OBJECTIVES OF THE PRESENT WORK
– To know the behavior of the building with ground and top soft-storey.
– To study the influence of moment transfer beams on structural behavior of multistory building.
– To study the parameters such as storey drift, storey displacement, story shear in multi-story building. – To check the results with software ETABS, with
different models, parameters.
IV. MODEL DESCRIPTION
In the present study 9 different models of 21 storey which is having 4 bays of 10m in x- direction and 13 bays of 10 m in y direction with the plan dimension of 40m X 130m and a storey height of 10m, 2m and 3m of storey 1, storey 11 and 21 and remaining all storey respectively. Following type of structure such as bare frame, both ground and intermediate floor as soft storey are considered, L, Box, swastika and I pattern shear wall are provided at corner of the plan. Providing equivalent diagonal strut of 300 mm width in place of masonry infill panel. The building is considered in zone 5 and medium strength soil. Modulus of elasticity of brick masonry is 3500x10³kN/m² density of brick masonry is20kN/m³, grade of concrete(for beams and slabs) is 25 N/mm², grade of concrete(for columns and shear walls) is 30 N/mm², floor finishes is 1kN/m², imposed loads is 3.5 KN/ m², wall load of 12kN/m2 .Slab thickness of 0.150m and thickness of slab of 200 beneath swimming pool exerting a pressure of 19.62 kN/m2 on slab .Column size of 1.2mx1.5m , Moment Transfer beam of .4mx.6m in x –direction beam at first storey of .6mx1.2m and rest of the beams as .4mx.6m.
V. MODELS CONSIDERED FOR ANALYSIS
Following 9 models are analyzed by equivalent static method response spectrum method using ETABS software.
1) Model 1: Bare frame model, however masses of brick masonry infill walls (230mm thick) are included in the model.
2) Model 2: Building model is same as model 1 with L-type shear wall at corners.
3) Model 3: Building model is same as model 1 with Box-type shear at the corners.
4) Model 4: Building model is same as model 1 with Swastik-type shear wall at corners.
5) Model 5: Building model is same as model 1 with I-type shear wall at corners.
6) Model 6: Building model is same as model 2 withfull diagonal strut.
7) Model 7: Building model is same as model 3 with Full diagonal strut.
8) Model 8: Building model is same as model 4 with full diagonal strut.
[image:2.595.364.495.66.286.2]9) Model 9: Building model is same as model 5 with full diagonal strut.
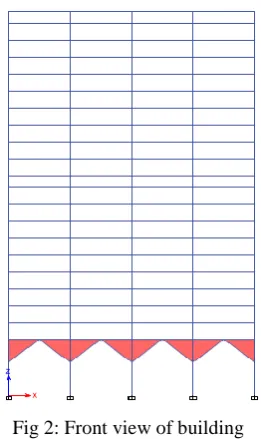
Fig 2: Front view of building
The above figure shows how beams and columns in the ground storey are connected by the use of a triangular reinforced concrete wall in order to provide extra stability and increase the resistance against seismic forces.
MODEL 1 MODEL 2
MODEL 5 MODEL 6
MODEL 7 MODEL 8
MODEL 9 Fig 3: MODELS
VI. RESULTS AND DISCUSSION
The results obtained from the ETABS analysis of G+20 model for response spectrum analysis with and without p-delta effect are tabulated and discussed for the parameters such as base shear, storey drift and storey displacement.
A. Base Shear
Base shear is an estimate of the maximum expected lateral
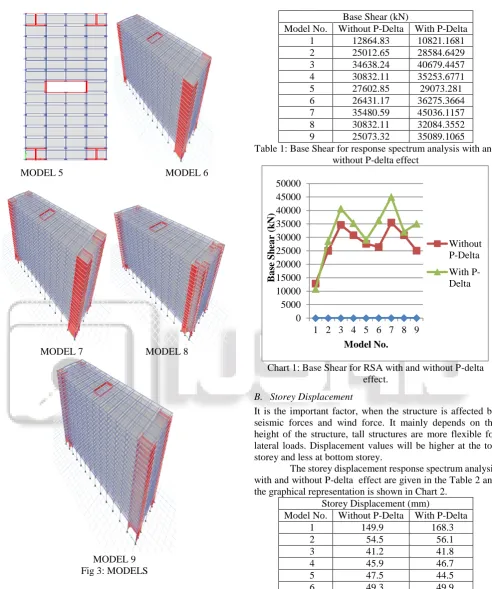
Base Shear (kN)
Model No. Without P-Delta With P-Delta
1 12864.83 10821.1681
2 25012.65 28584.6429
3 34638.24 40679.4457
4 30832.11 35253.6771
5 27602.85 29073.281
6 26431.17 36275.3664
7 35480.59 45036.1157
8 30832.11 32084.3552
[image:3.595.52.545.57.647.2]9 25073.32 35089.1065
Table 1: Base Shear for response spectrum analysis with and without P-delta effect
Chart 1: Base Shear for RSA with and without P-delta effect.
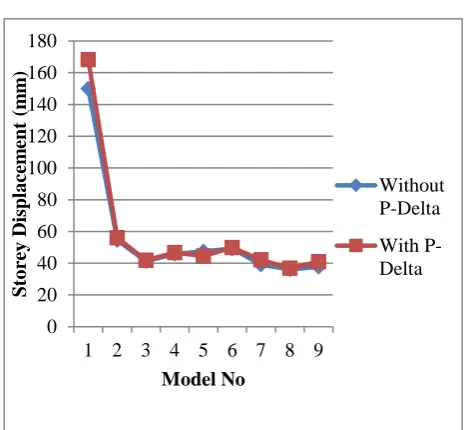
B. Storey Displacement
It is the important factor, when the structure is affected by seismic forces and wind force. It mainly depends on the height of the structure, tall structures are more flexible for lateral loads. Displacement values will be higher at the top storey and less at bottom storey.
The storey displacement response spectrum analysis with and without P-delta effect are given in the Table 2 and the graphical representation is shown in Chart 2.
Storey Displacement (mm)
Model No. Without P-Delta With P-Delta
1 149.9 168.3
2 54.5 56.1
3 41.2 41.8
4 45.9 46.7
5 47.5 44.5
6 49.3 49.9
7 39.1 42.1
8 36.1 36.8
[image:3.595.322.532.555.693.2]9 37.8 41
Table 2: Storey Displacement for Response Spectrum Analysis with and without P-delta effect.
0 5000 10000 15000 20000 25000 30000 35000 40000 45000 50000
1 2 3 4 5 6 7 8 9
B
a
se
Sh
ea
r
(k
N)
Model No.
Without P-Delta
Chart 2: Storey Displavement Vs Different Models
C. Storey Drift
It is nothing but the difference between storey displacements of one storey with respect to the other storey. As per codes its value should not exceed the limit of 0.004 of height of the storey. Its value is usually maximum at mid stories.
The storey drift for RSA method are given in the Table 3 and the graphical representation is shown in Chart 3
Storey Drift
Model No. Without P-Delta With P-Delta
1 0.003468 0.003958
2 0.001275 0.001303
3 0.00097 0.00098
4 0.001057 0.001071
5 0.001 0.001046
6 0.001124 0.001132
7 0.000917 0.000951
8 0.000819 0.000829
[image:4.595.50.285.58.273.2]9 0.000871 0.00096
Table 3: Storey Drift for response spectrum analysis with and without P-delta effect.
Chart 3: Storey Drift Vs Different Models
VII. CONCLUSIONS
1) The storey drifts are found within the limit as specified by the code IS 1893(Part-1):2002.
2) Higher storey drift values are dangerous to the building in our study Model 8 has shown least drift by response spectrum analysis.
3) Drift is almost same in with P-Delta and without P-delta and without P-delta effect.
4) Highest storey displacement is shown by bare frame Model 1.
5) Considerable amount of reduction in storey displacement observed by introduction of any type of shear wall. 6) Displacement is found to be minimum for Model 8 in
case of RSA method. Considerable amount of storey displacement is reduced using any type of shear wall. 7) The soft story effect is less at intermediate location of the
building because of increased stiffness. A service storey of lesser height can be safer for building at higher level. 8) In case of base shear, Model 7 offers high base shear with
Box-type shear wall at corner.
9) All models with different type of shear wall and models with shear wall with diagonal strut are giving good results compared to bare frame model. So it is recommended to use any type of shear wall depending on the site condition and the convenience of designer. 10) By providing shear walls at corner p-delta effect can be
minimized,
11) Seismic base shear is more in p-delta effect and less in without p-delta effect.
12) P-delta effect increases bending moment and forces. 13) P-delta effect increases joint displacement compared to
without p-delta effect.
14) A secondary beam helps to reduce span of the large slab and keep check on slab depth. It avoids load concentration and helps in redistribution of bending moments from main beams.
15) By using secondary beams we can avoid floating columns.
REFERENCES
[1] IS 13920: 1993, Ductile Detailing of Reinforced Concrete Structures Subjected to Seismic Forces; Bureau of Indian Standards, New Delhi, India
[2] Mohammed Khaja Moinuddin, Vishwanath. B. Patil, (2014), ‘Seismic Evaluation of R.C. Framed High Rise Structural System with the Effect of Ground and Intermediate Soft Storey’, International Journal of Engineering Research & Technology, vol. 3, pp. 602 - 608.
[3] IS 456: 2000.“Indian Standard Code of Practice for plain and reinforced Concrete”, Bureau of Indian Standards, New Delhi. ETABS Non-linear 9.7 Computers and Structures Inc, Berkeley.
[4] IS 1893 (Part I): 2002, 6th Edition, Criteria for Earthquake Resistant Design of Structures; Bureau of Indian Standards, New Delhi, India
[5] Md Irfanullah , Vishwanath. B. Patil.“Seismic Evaluation of RC Framed Buildings with Influence of Masonry Infill Panel”.International Journal of Recent 0 20 40 60 80 100 120 140 160 180
1 2 3 4 5 6 7 8 9
Sto re y Dis pla ce m ent ( m m ) Model No Without P-Delta With P-Delta 0 0.0005 0.001 0.0015 0.002 0.0025 0.003 0.0035 0.004 0.0045
1 2 3 4 5 6 7 8 9
Technology and Engineering (IJRTE) ISSN: 2277-3878, Volume-2, Issue-4, September 2013.
[6] Syed Mohammad Zakir Ali M.Tech Student (Structural Engineering) & Amaresha“A Seismic Analysis of RC High Rise Structural Building with Multiple Soft Storey at Various Level using ETabs ”(IJSRD) vol 3, issue 04,2015.
[7] IS 13920: 1993. “Indian Standard Code of the practice for the detailing of Reinforced Concrete Structures Subjected to Seismic Forces” Bureau of Indian Standards, New Delhi.
[8] IS 456: 2000.“Indian Standard Code of Practice for plain and reinforced Concrete”, Bureau of Indian Standards, New Delhi.
[9] Dr. Vinod Hosur.“Earthquake resistant design of