scroll down to view the document itself. Please refer to the repository record for this item and our policy information available from the repository home page for further information.
Author(s):Tanu, Eedee; Arreymbi, Johnnes
Title:An examination of the security implications of the supervisory control and data acquisition (SCADA) system in a mobile networked environment: An augmented vulnerability tree approach.
Year of publication:2010
AN EXAMINATION OF THE SECURITY IMPLICATIONS OF
THE SUPERVISORY CONTROL AND DATA ACQUISITION
(SCADA) SYSTEM IN A MOBILE NETWORKED
ENVIRONMENT: AN AUGMENTED VULNERABILITY
TREE APPROACH.
Eedee Tanu
1& Johnnes Arreymbi
2School of Computing, IT & Engineering University of East London
London, UK
Email1: [email protected]; Email2: [email protected]
Abstract The increasing demand of supervisory control systems connected remotely to critical infrastructure and recently the internet, has profiled a high threat level to the security and function of control system; more especially Supervisory Control and Data Acquisition (SCADA) systems. It is very crucial that operators and management are knowledgeable about these threats and get familiarize with ways to trace and track information required mitigating the threats. In present day very competitive markets and with high levels of infrastructural investments, it is of vital importance for corporations to be up-to-date with their SCADA networks so as to meet the challenges faced by remote and/or mobile access, use and cyber threat posed to the critical systems infrastructures. We have examined the security implications of having the SCADA system exposed to the mobile and/or internet environment. The paper deals with the following issues: Section one looks at types of infrastructures and the general functionalities of SCADA and assesses the risks in mobile environment. The second section employs some of the recent methodologies applied to the SCADA system. Section three reports on some findings from analysis and critically evaluates the risks posed to the system using an augmented vulnerability tree approach. The last section draws from the findings to re-evaluate, conclude and proposes some solutions on the risk issues of operating SCADA in a mobile networked environment.
Keywords: Supervisory control and data acquisition (SCADA) system, Industrial automation, monitoring and Control, automation application, security, risk assessment, network system vulnerability, mobile and Internet environment.
1. Introduction
Critical Infrastructure is used to best describe assets that are vitally important for the functioning of a system – organization, society and economy. Most computing, engineering, manufacturing and controls
(SCADA) systems are crucial to the safe and efficient operation of many critical infrastructure components which are in wide use today and applicable to many different industry sectors. The system monitors and control industrial systems in areas such as Oil and Gas, Air traffic and Railways, Power generation and transmission, IT,
Computational processing, Water
management, Manufacturing Production plants, and many more.
The general functionality of SCADA systems involves receiving field-data collected by remote terminal units (RTUs) and controlling physical devices such as switches and pumps by using RTUs. The master computers (MTUs) provide the information such as meter readings and equipment status to human operators in a presentable form and allow the human operators to control the field equipments or control devices automatically. The MTU initiates almost all communication with remote sites. Many early SCADA systems used mainframe computer technology making them hierarchical and centralized in nature and required human oversight to make decisions. SCADA systems were developed for gathering data from long distances using poor communication systems but providing high levels of reliability and operability. MTUs were specialized, dedicated computers which gathered information and sent control command over 1200-baud communication lines to RTUs with no local intelligence or function beyond serving the master station. Very little change occurred in SCADA system concepts during the first 30 year of the industry (Sciacca, S.C et., al Jan. 1995), The recent advances in the communication technologies and media (fiber optics, direct satellite broadcast and so forth), and
increased processing power available at substation freed the SCADA architecture and functionality from the archaic 100-baud limitation of the past communication systems.
1.1. Risk tools and methodologies
It is mandatory that all devices on our critical infrastructure have to be protected and the threat associated to them have to be identified. After which, the procedure and policy will follow, and the technology that is required for protecting them can be implemented. Risk assessment is generally a vast area, which involves different approaches and there are many tools for assessing the risk in various situations such as, in a mobile networked environment. Assessing the risk to critical infrastructures can be looked at from different approaches, for example; the Operational Critical Threat, Asset, and Vulnerability Evaluation (OCTAVE) (Alberts, et al., 2003), which is a framework for identifying and managing
information-security risks. CORAS
(RFRM) method, which builds on the hierarchical holographic model (HHM) (Haimes & Chittester, 2005) to identify risks, but then filters and ranks the risks so that the risks can be addressed in the order of priority. Haimes and Chittester (2005) also use Inoperability Input–Output Modeling (IIM) to quantify economic losses and their propagation through the various economic sectors for large-scale civil infrastructures controlled by SCADA
systems over internet protocol
communication networks. Meanwhile
(Nozick et al., (2005)) looked at representing interdependent infrastructure networks using Markov and semi-Markov processes to reflect uncertain capacity on network links. However, none of these methods deals with assessing the risk of SCADA in a mobile networked environment
1.1.1 Other methodologies
Recent methodologies by Stoneburner (2006), proposes the unified risk framework that provides a common language for risk management that may be used for describing risks. Quantitative risk analysis methods fall under the broad category of probabilistic risk assessment (PRA). A generally accepted definition of PRA is a systematic and comprehensive methodology to evaluate risks associated with a complex engineered technological entity. Although PRA technically includes a risk identification phase, it does not provide the guidance of methods like HHM, but rather assumes that the designer can identify the risks. PRA includes all fault/attack tree analyses (FTA), attack tree analysis (Schneier, 1999), event tree analysis (ETA), Vulnerability Tree Analysis (VTA) (Vidalis & Jones, 2003), failure mode and effect analysis (FMEA), or failure mode effect and criticality analysis
(FMECA) (Ayyub, 2003); and
cause/consequence analysis (CCA)
(Pumfrey, 1999), as well as methods that use directed graphs and logic diagrams (Henley & Kumamoto, 1996). Most other methods are extensions or combinations of these. Many of the tools mentioned earlier incorporate these methods to varying degrees. To perform the fundamental security analysis of computer-based information systems, one is tempted to use Dijkstra's weakest precondition approach. In fact, Yasinsac and Childs (2001) have done some initial work in this direction for general Internet security, which can be applied to information management systems.
2. Effect of SCADA Systems
Recent developments in Information and communication technologies have fueled the pushed for mobile SCADA systems within corporate IT infrastructure. This mobile devices technology presents a unique set of problems for a networked based SCADA system that need to be carefully addressed, and in fact more recent studies (Alex W. Dan E., 2008) have tried to examine how SCADA systems can optimally be operated over GPRS networks
2.1 Ass ociated Wi reless Techn ologies
Some widely used wireless media for SCADA are: private wireless networks (analog or digital), dedicated wireless
Multiple Address Systems (MAS),
Internet, providing Internet Protocol (IP) service.
The GPRS is a packet data switched technology, using the same Infrastructure as the GSM network. The intention for developing the GPRS technology was to provide broadband access ―on the move‖, similar to the wired Internet service which uses circuit switched ISDN, ADSL, or coaxial cables. Using GPRS, network resources are instantly available when data (message) actually needs to be transmitted across the wireless media. The transmitted data is divided into packets prior to being sent via the wireless modem. Common data applications over GPRS include file transfer, pictures, video, Voice over IP, and the ability to remotely access and control industrial installations.
The GPRS network offers data rates up to of 150 kbps, depending on network availability, channel coding scheme, and data terminal capability. This increase in data transmission rates with respect to GSM (circuit switching method) is achieved by using more than one timeslot of the TDMA frame. However each operator can assign one or more time slots. GSM/GPRS networks operate in four RF bands: 850/1900 MHz (USA and Latin America) and 900/1800 MHz (Europe, Africa, Asia, Middle East, and Latin America). GPRS modems manufactured today, like the Motorola g-24, operate in all four ranges (quad-band)
Naturally, not all GPRS based
communications are identical. Simple SCADA devices like standard RTUs or standard PLCs can communicate over GPRS networks using advanced type GPRS modems with embedded IP stack and having a PC based server. The network in this case is similar to a fixed server-to-mobile cellular
subscriber communication rather than being optimized for SCADA.
2.1.1 SCADA wireless network performance issues.
When a SCADA system is used over a public GSM/GPRS network, users should set realistic expectations and must remember that there is a compromise between cost and performance, since the operating parameters relating to data traffic are affected by the following factors:
• Network loading - this might be uncontrollable and unpredictable with a tendency to sudden increase during
emergencies (weather conditions,
earthquake, terror event, etc.).
• Re-establishment - a disconnected IP link might take up to 10 seconds, depending on network loading. This delay might create a
problem for time-critical SCADA
applications.
• Data loss - overloaded networks often cause messages to get lost in transit and no confirmation sent to the sender. These events might in turn trigger additional traffic and result in even more delays due to resending of messages, errors or poorly performing SCADA system.
• Network crash or downtime - while operators are doing their best to ensure good Quality-of-Service (QoS), the GRRS remains a public network and is not a fault-proof system. It might crash due to attack; overload etc. and the service to parts of the network/areas can be interrupted for an extended period.
• In principle, SCADA users on GPRS networks have no priority over regular cell phone users‘ subscribers.
players, etc.) may even be given a higher priority access than SCADA users.
3.0 An Augmented Vulnerability Tree Approach Model.
The Augmented Vulnerability Tree
Approach (AVTA) is a proposed new methodology, that combines the concepts of vulnerability tree analysis (Vidalis & Jones, 2003), fault tree analysis (Ayyub, 2003), attack tree analysis (Schneier, 1999), and the cause–consequence technology (Pumfrey, 1999); to produce what is believed to be a more effective risk analysis model.
Most, if not all of the tree-analysis methods are very similar, but they differ primarily in what defines the top event. For example, the fault tree/attack tree/vulnerability tree method is a deductive process, where, the topmost undesirable event is first postulated. Afterwards, the ways for this event to happen are deduced. The deduction process results in a tree that includes all failure components that could contribute in causing the top event. Therefore a vulnerability tree is a logical model representing the logic of system failures qualitatively. A tree diagram is often constructed as a graphical illustration showing the stepwise cause resolution using formal logic symbols.
In some instances, and depending on the revenue scheme of the operator, other data users (video, news download, games players, etc.) may even be given a higher priority access than SCADA users.
3.1 The Steps
In constructing the Augmented Vulnerability Tree Approach (AVTA), we have come up with the following steps:
Step 1: Construct the base-level and expanded vulnerability trees
To construct a vulnerability tree, the top undesirable event is first postulated which represents a pivotal event for a particular failure scenario. The possible means (attacks) for this event to occur are systematically deduced. These attack paths can result in a failure (the top event). Then, each situation (base-events) that could cause an attack is added to the tree as a series of logical expressions. Thus, the intermediate failure events (―attacks‖) are connected to the top event and basic events with logic gates, the most common of which are ―AND‖ gates and ―OR‖ gates. In a vulnerability tree, the AND gate is used when all the base-events connected by this gate must happen to launch an attack. The OR gate is used when any one of the base-events connected by this gate is sufficient for an intruder to launch an attack.
Step 2: Construct effect analysis table and calculate threat-impact
Step 3: Add threat-impact index values to vulnerability tree
The threat-impact values from the effect analysis table are marked on the vulnerability tree. The top event of a system without any implemented security (base vulnerability tree) will have the threat impact index of 100. After security enhancements are applied, this value is expected to be reduced in the new vulnerability tree.
Step 4: Calculate the vulnerability index values
The cyber-vulnerability indices are assigned to all the base-events by using the threat-impact index of their parent event in a vulnerability tree. The threat-impact index is equally divided among all the base-events at the same level. AND and OR are treated the same way while dividing the parent-level values. Once all the base-events have the cyber-vulnerability indices assigned to them, the cyber-vulnerability index for the attack tree is calculated by summing up all the cyber-vulnerability indices.
Step 5: Complete augmented vulnerability tree by adding vulnerability index values
The expanded tree now has graphical information about threats, the impact of these threats, and the vulnerability of the system to electronically launched attacks.
Step 6: Repeat steps 2 to 5 for proposed security enhancements
Security enhancement should lead to lower threat impact index and cyber-vulnerability index values. However, some security enhancements may not result in lower values if other vulnerabilities continue to enable a threat.
4. Case study
This section describes the configuration for the SCADA test bed at the University of Louisville and illustrates how the proposed method was applied to the system component that performs information communication. The method is also illustrated on the same component after two security enhancements were applied to the
protocols used for information
communication
4.1 Vulnerabilities Analysis of SCADA in a mobile networked environment
4.2 Critical Analysis and Evaluation
STEP 1: Create the base level on vulnerability tree
There is general attack against mobile network communication system which is outlined in the tree that can be instituted against Remote terminal unit and master terminal unit. Hence, the attacks are the base event for the RTU and MTU. Any attack that is launched against the MTU is a specific attack. The attack is then classified into three categories in the proposed approach: Mobile attacks among the master and the slave, attacks against the master and the slave, the possibility of an attack against the MTU necessitate an attacker attempting to trick the MTU by manipulating a control message. There are possibly Similar attacks against the RTU is classified as the response alteration to the RTU.
The possibility of an attacks on a mobile network systems can be classified as an attacker trying to resend manipulated message (replay attack) it, spoofing attempt to send a fake message, (DOS attack). Eavesdropping attacks (unauthorized interception of information in transit through the use of methods other than wiretapping), and gaining information by sniffing or tapping a line between two unsuspecting parties traffic analysis (intercepting and examining messages to deduce information from patterns in communication), are included in the augmented vulnerability tree structure attacks are in passive forms and they have direct impact on mobile SCADA security.
The tree below shows the base events that include the flaws such as nonce not included in the response. A message transmitted from a remote terminal unit in reference to a requested message from an MTU is called a response. The Mark in one of the base events is a value that is diverse every time a
message is sent is called a nonce. Message that is readable in its normal text, which every system can read as opposed to encryption, is called a Plaintext.
An MTU sends petition in a readable text which is outstanding as the base events, which means that the entire information is transmitted in a readable form. The origin authentication refers to a countermeasure modeled to form the validity of the originator of information. A session is a form of connection among an MTU and an RTU. A countermeasure that is modelled to form the validity of the content of the information is referred to as authentication. A security countermeasure that proves the uniqueness of the person who attempts to use the system is called an access authentication.
STEP 2: Calculate threat-impact values and create the damage analysis table
Table 1 below is listed as a row in the damage analysis table which is the attacks. To generate columns, show a list all the possible loss that have been produced from the result of each attack. The duplicates are then removed and the losses are put in groups. In table 2, the first eight columns show the outcome from the loss. The financial loss caused while attempting to run the operation without the full use of the SCADA control system is the loss of control or scene.
equipments is included in the cost of remedying intrusion.
Table 3 (see appendix) gives a summary of the attack tree diagram. This is a complex tree because mobile SCADA is a complex program.
Denial of service Flood network, disrupt a connection between one or more device
Control message
modification Seize and change control information
Replay Seize information and send it back later
Spoofing fake to be an RTU or MTU
Write to RTU Change or Add data on MTU
Write to MTU change response and transmit to MTU
RTU response alteration Change and Add values on RTU
Table 1: Threat Classification
Table 2: Damage analysis Table
Loss of control
($)
Loss of production
($)
Loss of staff time (operation salary)
Equipm ent loss ($)
Cost of remedying
intrusion people cost
$
Total
loss ($) Prob.
Normaliz ed loss (previous
-value / previous column) total % #
Op # Hours (h)
Pay/h ($)
Total ($)
Replay 1,000 15,000 1 40 35 1,400 0.00 20,000 37,400 0.20 8.00
Spoofing 4,000 100,000 1 80 35 2,800 25,000 35,000 166,800 0.05 9.00
Denial of
service 6,000 100,000 2 50 35 3,500 5,000 15,000 129,500 0.20 27.00
Control message modificat
ion 4,000 400,000 5 120 35 21,000 75,000 50,000 550,000 0.05 29.00
Write to
MTU 0.00 20,000 1 40 35 1,400 25,000 20,000 66,400 0.20 14.00
RTU-response
alteration 1,000 15,000 1 40 35 1,400 0.00 10,000 27,400 0.10 3.00
Write to
RTU 20,000 1 40 35 1,400 5,000 20,000 46,400 0.20 10.00
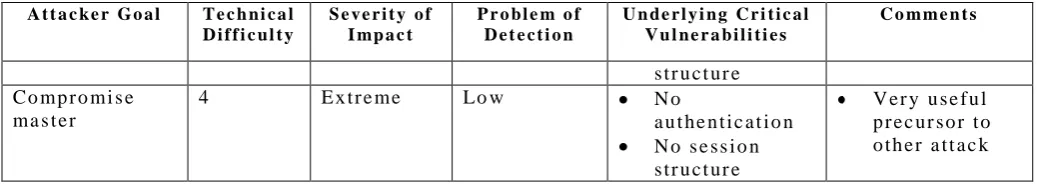
[image:9.595.45.547.164.684.2]A t t a c k e r G o a l T e c h n i c a l D i f f i c u l t y
S e v e r i t y o f I mp a c t
P r o b l e m o f D e t e c t i o n
U n d e r l y i n g C r i t i c a l V u l n e r a b i l i t i e s
C o m m e n t s
G a i n S C A D A s ys t e m a c c e s s
1 - 4 V e r y l o w Lo w W i r e l e s s
d e v i c e s S C A D A t r a n s mi s s i o n me d i a
R e mo t e f i e l d s i t e s
3r d p a r t y a c c e s s
D i f f i c ul t y hi g h l y
d e p e nd e nt o n p o i nt o f a c c e s s a nd s e c ur i t y me a s ur e s i n p l a c e G o a l fo r a l l o t h e r c r i t i c a l p r e c ur s o r I d e n t i f y R T U o r
M T U d e vi c e
2 V e r y l o w Lo w N o
c o n f i d e n t i a l i t y
G o a l fo r a l l o t h e r c r i t i c a l p r e c ur s o r D i s r up t ma s t e r
s l a ve
c o m mu n i c a t i o n s
2 M o d e r a t e H i g h N o
a u t he n t i c a t i o n N o s e s s i o n s t r u c t ur e S i mp l i s t i c fr a mi n g t e c h .
D i s a b l e s l a ve 2 M o d e r a t e H i g h N o
a u t he n t i c a t i o n N o s e s s i o n s t r u c t ur e S i mp l i s t i c fr a mi n g t e c h . R e a d d a t a fr o m
s l a ve
3 M o d e r a t e V e r y l o w N o
c o n f i d e n t i a l i t y N o
a u t he n t i c a t i o n W r i t e d a t a t o
s l a ve
3 H i g h V e r y l o w N o
a u t he n t i c a t i o n N o s e s s i o n s t r u c t ur e N o i n t e gr i t y
P r o gr a m s l a ve 3 H i g h Lo w N o
a u t he n t i c a t i o n N o s e s s i o n s t r u c t ur e N o i n t e gr i t y C o mp r o mi s e
s l a ve
3 V e r y h i g h Lo w N o o f i n t e gr i t y
N o
a u t he n t i c a t i o n
D i s a b l e ma s t e r 2 M o d e r a t e H i g h N o
a u t he n t i c a t i o n N o s e s s i o n s t r u c t ur e W r i t e d a t a t o
ma s t e r
3 H i g h Lo w N o
A t t a c k e r G o a l T e c h n i c a l D i f f i c u l t y
S e v e r i t y o f I mp a c t
P r o b l e m o f D e t e c t i o n
U n d e r l y i n g C r i t i c a l V u l n e r a b i l i t i e s
C o m m e n t s
s t r u c t ur e C o mp r o mi s e
ma s t e r
4 E x t r e me Lo w N o
a u t he n t i c a t i o n N o s e s s i o n s t r u c t ur e
[image:11.595.44.563.107.199.2]V e r y u s e f u l p r e c ur s o r t o o t h e r a t t a c k
Table 3: Summary of the attack tree
To compute the dollar amount the average loss values are used. Different means are used to compute loss orderly. First, Case studies and other literature on critical-system attacks were studied. Specifically, the loss was estimated using the data in (Rakaczky, 2005). For those who are interested in using a large volume of data on losses, Its recommended for them to use the British Columbia Institute of Technology Industrial Security Incident Database (Byres and Lowes, 2004), which provides one of the most Comprehensive event databases record on cyber-attack for critical infrastructures.
Next, used the outcome from the enhanced SCADA to find a typical range of loss they encountered. Using the data from the case study, the costs of different devices of the SCADA case study where considered, and finally I created the attack tree above with their counter measures I used the same process to get the estimate for the probabilities.
Step 3: Addition of threat impact value to tree for enhancement
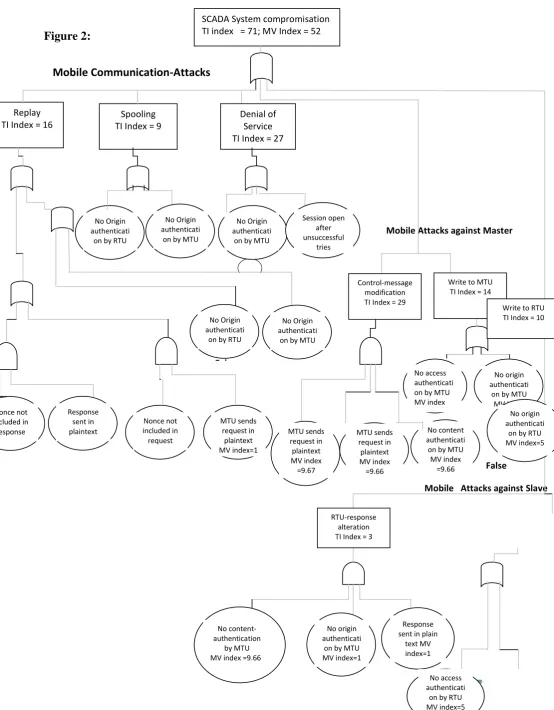
The threat-impact index value on the attack tree is shown in the last column of the damage analysis table. They are marked on the augmented vulnerability tree .the values add up to a total amount of 71 in the tree since there is no security enhancement yet.
Step 4: calculate the mobile vulnerability index values
The threat-impact index of each attack is now subdivided equally among the base events. As shown in Fig. B, a threat-impact index of 27 for the denial of service attack is divided equally into two of its base events, with each event having an index of 13.5.
Similarly, since the control-message modification attack has three events, one third of this attack's threat-impact index value is assigned to each of its base events. As noted earlier, we assume a simple, un-weighted distribution, and divide the index equally among base events. Therefore, the threat-impact index for the replay attack is divided into two at the first level, giving the MV index of 4 to the base events of no-origin authentication. The other two events are at a lower level and hence each of these base events is assigned the MV index of 2.
Step 5: add vulnerability index value to tree and complete the tree
indices and the Mobile-Vulnerability indices are marked as MV indices.
5. Case study explanation
• Nonce not included in response: one base event with a MV index of 1.
• Response sent in plaintext: one base event with a MV index of 1 and another base event with a MV index of 1, giving a total of 2.
• Nonce not included in request: one base event with a MV index of 1.
• MTU sends request in plaintext: one base event with a MV index of 1 and another with 9.67, giving a total of 10.67.
• No-origin authentication by RTU: one base event with a MV index of 4.5, one with 2, one with 13.5, one with a MV index of 9.67, and one with a MV index of 5, giving a total of 34.67.
• No-origin authentication by MTU: one base event with a MV index of 4.5, one with 2, one with 1, and one with 7, giving a total of 14.5.
• Session open after unsuccessful tries: one base event with a MV index of 13.5.
• No-content authentication by RTU: one base event with a MV index of 9.66.
• No access authentication by MTU: one base event with a MV index of 7
• No-access authentication by RTU: one base event with a MV index of 5.
• No-content authentication by MTU: one base event with a MV index of 1.
The complete augmented vulnerability tree is shown in Fig. 1 in the appendix. The mobile vulnerability indices are marked as MV indices and the threat-impact indices are marked as TI indices.
6. Proposed solution on mitigating the
risk issues of operating SCADA in a
mobile networked environment.
Two SCADA communication security
enhancements have been suggested (Patel, 2006) and implemented on the test bed described above. The proposed enhancements include the Authentication Octets and Challenge–response authentications. The Authentication Octet enhancement is based on the digital-signature algorithm. In this enhancement, additional bytes of information, referred to here as Authentication Octets, are appended to each message from an MTU to an RTU for authentication. First, the MTU performs hash on the selected bytes of the message it intends to send; which results in generating a hash digest. The MTU encrypts this digest by using its private key and then the MTU sends the encrypted digest along with the message. The message itself is not encrypted to save processing time duration.
7. Conclusion
challenging security situations. The paper looks at the types of infrastructures and the general functionalities of SCADA and assesses the risks in mobile environment. It employs some of the recent methodologies as applied to the SCADA system. The paper also reports on some findings from the detail analysis and critically evaluates the risks posed to the system using an augmented vulnerability tree approach. The last section draws from the findings to re-evaluate, conclude and proposes some solutions on mitigating the risk issues of operating
SCADA in a mobile networked
environment.
8. References
Alex W. Dan E. (n.d.). How Can SCADA Systems Optimally Operate Over GPRS Networks. Motorola , 1-5.
Byres and J.lowe. (2005). Isidious threat to control system. In Tech 52(1) , 28-31.
Byres and Lowes. (2004, October 18-20). The myths and fact behind cyber security risk for fo industrial control systems,. 213-218. Berlin.
Cavusoglu,Mishra and Raghunathan.
(2004b). The effect of internet security breach announcement on market value :capital Market reactios for breached forms
and internet security developers.
International Journal of Electronic Commerce 9(1) , 69-104.
CERT SCADA. (2007). US-CERT United state computer emergency Readiness Team.
Retrieved march 31, 2009, from
www.kb.cert.org:
http://www.kb.cert.org/vuls/byid?searchview
Chttester and Haimes. (2005). A Roadmap for Quantifying the efficacy of risk management of
information systems. . Information Technology and management 2(2) , 1-21.
Dhillon, G. (1997). Managing information system security . London : Macmillian pres Ltd.
Ettredge and Richardson. (January 7-10 2002). Assessing the risk in e commerce. In proceedings of the fifth international conference on system science, (p. 194). Big island HI. F. Farahmand, S.B. Navathe, P.H.Enslow and G.P.Sharp. (2003). Managing vulnerabilities of information system security incidents, preceedings of the 5th international conference on electronic commerce. Acm.
Haimes, Kaplan, and Lambert. (2002). Risk ranking, filtering , and management framework using HHM risk analysis. 381-395.
Hovav and D'Arcy. (2003). The impact of Danial -of- service -attack announcement on the market value of firms. R. Risk managemant and insurance review 6(2) , 97-121.
loeb, G. a. (2003). The economics cost of Publicly announced information security breaches:empirical evidence from the stock market . Journal of computer science 11(3) , 431-448.
Patel, S. (2006). Secure internet based-based
communication protocol for SCADA
networks. Ph.d dissertation university of Louisville, louisville, kentuky
Rakaczky. (2005, October 25-27). Building a security business case. Illinois.
Sandip C.P,James H.G,Patricia A.S.Ralston. (2008). Quantitaively assessing the vulnerability of Critical infrastructure system:A new method for evaluatin security enhancement . International Journal of information managemant , 483-491.
Sandip et al. (2008). Quantitatively assessing the vulnerability of critical information system: A New Method for evaluating Secuirty enhancements. International journal of inforamtion management , 483-491.
Schneier, B. (1999). Attack Trees. Dr. Dobb's Journal December .
Vidalis & Jones. (2003). Using vulnerability trees for decision making in threat
assessment. Retrieved from
http://www.glam.ac.uk/socschool/research/pu blications/technical/CS-
Walker RW. (2000). Assessment of technical
risks. proceedings of 2000 IEEE
international conference on management of innovation and technology .
Whitman, M.,& Mattord, H. (2005). Principles of information security( 2nd ed).Boston. Course Technology .
www.louisville.edu. (n.d.).
www.louisville.edu. Retrieved may 5, 2008,
from university of louisvlle:
https://louisville.edu/speed/research/centers-
Figure 2:
Mobile Attacks against Slave Mobile Attacks against Master
False False
e
SCADA System compromisation TI index = 71; MV Index = 52
Replay TI Index = 16
Spooling TI Index = 9
Denial of Service TI Index = 27 Mobile Communication-Attacks
No Origin authenticati
on by RTU cvcvcvcv
No Origin authenticati
on by MTU
No Origin authenticati
on by MTU
Session open after unsuccessful tries No Origin authenticati
on by RTU
No Origin authenticati
on by MTU
Control-message modification TI Index = 29
Write to MTU TI Index = 14
Nonce not included in response Response sent in plaintext Nonce not included in request MTU sends request in plaintext MV index=1 False MTU sends request in plaintext MV index =9.67 MTU sends request in plaintext MV index =9.66 No content authenticati on by MTU MV index
=9.66
RTU-response alteration TI Index = 3
Write to RTU TI Index = 10
No access authenticati on by MTU MV index =7
No origin authenticati
on by MTU MV index
=7
No content- authentication
by MTU MV index =9.66
No origin authenticati
on by MTU MV index=1
Response sent in plain
text MV index=1
No access authenticati on by RTU MV index=5
No origin authenticati