Study and Forecasting of Ring Road Development of Khargone City
Kunal Kewat
1Dr. Sunil Sugandhi
21
Research Scholar
2Assistant Professor
1,2JIT Borawan (M.P), India
Abstract— In this work the concentration is on the work related to traffic assessment to model a ring road for the busy area of a city. Traffic assessments can be usually carried out by municipalities for new proposed projects or developments, rezoning requests, traffic congestions, future regional planning and conducting traffic surveys in order to study the traffic behavior in accordance to specific future traffic projection. Usually traffic assessment studies the provided recommendation for some improvements to the area. Here traffic survey is followed by forecasting of traffic for future year 2045 and ring road is recommended to plan with immediate effect.
Key words: Forecasting of Ring Road Development, Data
Collection, Trip Distribution Models
I. INTRODUCTION
II. LITERATURE REVIEW
Muhammad Nomani Kabir, Yasser M. Alginahi, and Ali I. Mohamed, 2016. This document presents an assessment of the flow of traffic on the busiest road, ie the first ring road located in the central area of Madinah in Saudi Arabia. In this document, the traffic flow assessment is performed through the evaluation and analysis of traffic on First Ring Road. This includes the analysis of the number of vehicles entering and leaving the central area through the First Ring Road, the road layout, the percentage of incoming and outgoing traffic. The results of the simulation show a good agreement with the corresponding measurement data of the vehicles on First Ring Road. Thus, model can be used as a prediction model of vehicle movements.
Sudhir C, 2012, this paper aims at analyzing three different solutions suggested for traffic congestion relief in Port Louis, the busiest city of Mauritius. It evaluate impact of the three alternatives which are the use of Light Rail Transit (LRT) as an alternative mode of transportation, the construction of a Ring road around Port Louis, The upgrading of the current bus network into a Bus Rapid Transit system (BRTS).
Amol R.Rode, 2014, The present research primarily aims at evaluating various characteristics of traffic flow and noise pollution of Nagpur city by conducting experimentations at wider range of values for important parameters. This paper deals with experimental study of detailed traffic analysis of ring road of Nagpur city and formulating the strategies for effective traffic operation of the street.
Leni Stephen, Anjana Anna Sunny , Aravind S , Dipesh P Nath, 2016, Provision on adequate infrastructure is a pre-requisite for sustained growth of economy and inherent to such growth is the need to ensure cost effective movement of People and goods.We know that , The number of vehicles plying the road has increased dramatically. Hence, there is an urgent requirement to standardize the present inadequate road network in terms of its capacity. In kerala states Kottarakkara,
a town in Kollam district is considered. Due to high acquisition price, impossibility in widening due to dense population and due to cross traffic, Construction of ring road was considered.
Robert Bain, 2009, This paper addresses that shortcoming by reporting the results from the largest study of toll road forecasting performance ever conducted. The author has had access to the confidential commercial documentation provided to the project funders and, over a period of 4 years, has compiled a planned and effective traffic use database for over 100 international road toll projects financed with private funds. The results suggest whereas the toll traffic forecasts are characterized by large errors and a major detriment to optimism. As a result, financial engineers must ensure that the transaction structure is flexible and maintains liquidity, so that important deviations from traffic expectations can be met.
Tim Veitch, Aaron Alaimo, Lauren Walker, 2013, In this paper, previously unpublished forecasts made by the Zenith Toll Choice model for a number of recent toll roads are documented. These forecasts have proved to be encouragingly accurate, suggesting that the science of demand forecasting is in better shape than would be indicated by a survey of official demand forecasts. This paper also describes in detail, the innovative methods used by “Zenith Toll” Choice model, including the automatically generation of tolled alternatives, explicit modelling of the options between tolled alternatives, Detailed segmentation of the travel market and explicit treatment of toll stops and other price mechanisms.
S. .R. Pells, 1989, This paper presents a review of the known evidence on the various aspects of user response to new road capacity. The effects of traffic on new road capacity have important implications for the assessment of road conditions. The conventional method for long-distance roads (and increasingly for urban road projects) assumes that the volume of journeys and their destination is given between pairs of zones.
Jason D. Lemp, 2009, This paper represents a review of many key studies and reports dealing with uncertainty in traffic and revenue forecasts for highway projects. These studies have found that toll projects tend to suffer from substantial optimism in forecasts, with expected traffic volumes higher than actual volumes of 30% or more, about half the time.
opportunity is identified to adopt a far more ambitious position than has been possible up to now.
Artur Hołuj , Jarosław Frączek, 2015, The aim of this study is to analyse the intensity of traffic in the village of Bysina taking into account, that local municipality is planning to build ring road of Bysina nearby. Conducted traffic measurements confirmed that existing transit route – the county roadNo.K1935is characterized by allow transit traffic with a relative stabilization of its level in the various periods of the year. In addition, there is no increased arduousness at night and during all the days off from work.
S.P. Sekar and S. Kanchanamala, 2011, Chennai Metropolitan Area is experiencing a differential growth among the villages. The dynamics in the growth trends are attributable to various factors of influence. This article attempts to study the growth dynamics of CMA to discover the factors that influence it. The policies and guidelines for future development and their impact on the growth trend of the CMA are also examined. It is concluded that in the context of rapid urbanization, planning for development of the metropolitan area deserves utmost importance on par with the city area.
III. PROBLEM
Problem is taken as the route optimization of Ring Road which is taken under consideration from Khargone development authorities.
Ring road running parallel to canal starting from Bistan Road crossing Khandwa Road, Sanawad Road, terminating at St. Jude Higher Secondary School; Rs 1331.62 Lac is planned to invest for this ring road. The length of this road is 5.65 kms.
IV. ISSUES & FINDINGS
Identification of key issues help in resolving the problems in a focused manner related to traffic and transportation. Major issues related to traffic and transportation sector in Khargone town are as follows:
Due to the development of shops on footpaths, pedestrians walk on roads reducing the effective space available for traffic movement;
Due to the lack of organized off‐ street parking facility, vehicles parked along the main roads particularly in commercial areas are creating congestion and increases the chances of accidents;
All major roads of the town are of varying widths creating bottlenecks. Khandwa Road, Bistan Marg, Julwania Marg, Kasrawad Marg, Sanawad Marg, Umarkhali Marg etc. connecting to regional roads needs to be widened uniformly on priority due to high traffic volume and to reduce the bottlenecks;
In absence of any bypass various State Highways pass through the town, forcing through traffic to enter into the town creating pressure on town roads and increases the accident cases;
Some of the dense built up colonies of Mullawadi, Gurwa Darwaja Marg, road from Jhanda Chowk to
Bawadi bus stand, roads leading to localities like Baniyawadi, Mominpura etc. are inaccessible by vehicle due to extremely narrow width of lanes.
Several road intersections viz. Bistan Naka, Bawadi bus stand, Post Office Chauraha, Navgraha Chowk etc. are inconvenient due to faulty road geometrics, absence of signalization and proper lightening. Due to lack of space available in existing bus stand, it needs to be shifted to a comfortable location;
Khargone being regional service center, commercial and industrial activities necessitate inflow and outflow of huge goods transport vehicles. In absence of Transport Nagar, truck parking, loading and unloading, repairing workshops, etc. are concentrated along the roads creating congestion and pollution;
Absence of rail connectivity, puts huge pressure on road infrastructure;
Projects like bypass and ring road will directly save time, energy and reduce pollution particularly within the dense built‐ up inhabited area of the city.
V. OBJECTIVES
1) To Plan future as per traffic study. 2) To highlight peak hours of traffic load.
3) To find types of transportation vehicles and there density in peak hours.
4) To find Incoming and outward vehicles from all entrances of Ring Road.
5) To develop prediction model of vehicle movements. 6) The analysis and the outcome will substantially replicate
the traffic behavior on Ring Road.
VI. METHODOLOGY
Various parameters such as peak hour traffic volume, traffic composition, average speed of vehicles, signal timings, coordination or lack of it, delays, fuel consumption from the vehicle etc., will be considered.
The Experts recommend the factors for accurate and comprehensive congestion evaluation follow as:
Evaluate the performance of the transport system based on general accessibility (the general ability of people to obtain the desired services and activities)
Recognize changes in travel time values, And therefore the efficiency gains provided by policies, that favor higher value trips over lower-value trips.
Recognize that congestion tends to maintain a self-limited balance: it increases to the point that delays limit further peak-period vehicle travel.
when evaluating roadway expansions thus the account for generated and induced vehicle travel (additional vehicle travel resulting from reduced congestion) when evaluating roadway expansions.
A. Data Collection
1) Vehicle Type Wise O-D Survey for Peak Hrs
Survey is performed for 9 days in continue. First day survey data is presented in below table:
Sr. No. Origin Destination Vehicle Type Peak Hours
1 Chittorgarh - Bhusawal Highway
Barwani - Khargone Highway
Car / 3 Wheeler 189
Bus 8
LCV / Trolley 423
MCV 176
Indore - Khargone Highway
Car / 3 Wheeler 173
Bus 6
LCV / Trolley 397
MCV 167
Khandwa - Khargone Highway
Car / 3 Wheeler 169
Bus 9
LCV / Trolley 448
MCV 137
2 Barwani - Khargone Highway
Chittorgarh - Bhusawal Highway
Car / 3 Wheeler 197
Bus 5
LCV / Trolley 386
MCV 164
Indore - Khargone Highway
Car / 3 Wheeler 184
Bus 7
LCV / Trolley 464
MCV 185
Khandwa - Khargone Highway
Car / 3 Wheeler 176
Bus 9
LCV / Trolley 408
MCV 174
3 Indore - Khargone
Highway
Barwani - Khargone Highway
Car / 3 Wheeler 209
Bus 7
LCV / Trolley 394
MCV 143
Chittorgarh - Bhusawal Highway
Car / 3 Wheeler 202
Bus 6
LCV / Trolley 437
MCV 174
Khandwa - Khargone Highway
Car / 3 Wheeler 167
Bus 8
LCV / Trolley 447
MCV 146
4 Khandwa - Khargone
Highway
Indore - Khargone Highway
Car / 3 Wheeler 173
Bus 5
LCV / Trolley 418
MCV 127
Barwani - Khargone Highway
Car / 3 Wheeler 188
Bus 6
LCV / Trolley 428
MCV 164
Chittorgarh - Bhusawal Highway
Car / 3 Wheeler 160
Bus 7
LCV / Trolley 432
MCV 137
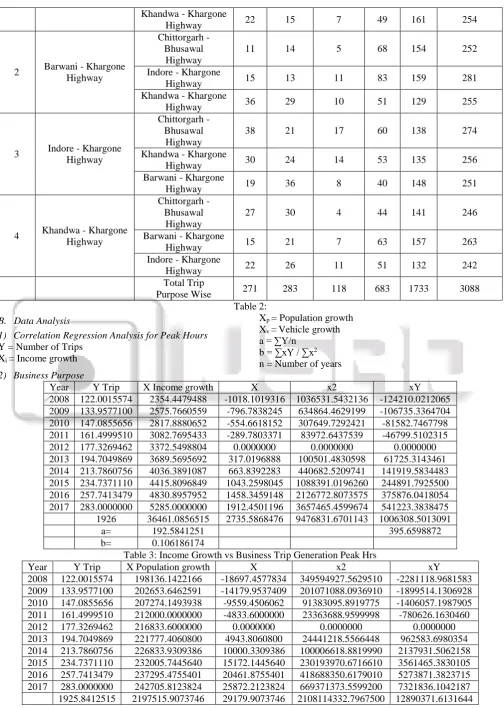
Table 1: 2) Total Trips Purpose Wise for Peak Hours
Sr. No Origine Destination Work Business Education Social Goods
Total Trip Junction
Wise
1
Chittorgarh - Bhusawal
Highway
Barwani - Khargone
Highway 20 26 11 62 147 266
Indore - Khargone
Khandwa - Khargone
Highway 22 15 7 49 161 254
2 Barwani - Khargone Highway
Chittorgarh - Bhusawal
Highway
11 14 5 68 154 252
Indore - Khargone
Highway 15 13 11 83 159 281
Khandwa - Khargone
Highway 36 29 10 51 129 255
3 Indore - Khargone Highway
Chittorgarh - Bhusawal
Highway
38 21 17 60 138 274
Khandwa - Khargone
Highway 30 24 14 53 135 256
Barwani - Khargone
Highway 19 36 8 40 148 251
4 Khandwa - Khargone Highway
Chittorgarh - Bhusawal
Highway
27 30 4 44 141 246
Barwani - Khargone
Highway 15 21 7 63 157 263
Indore - Khargone
Highway 22 26 11 51 132 242
Total Trip
[image:4.595.47.552.60.769.2]Purpose Wise 271 283 118 683 1733 3088
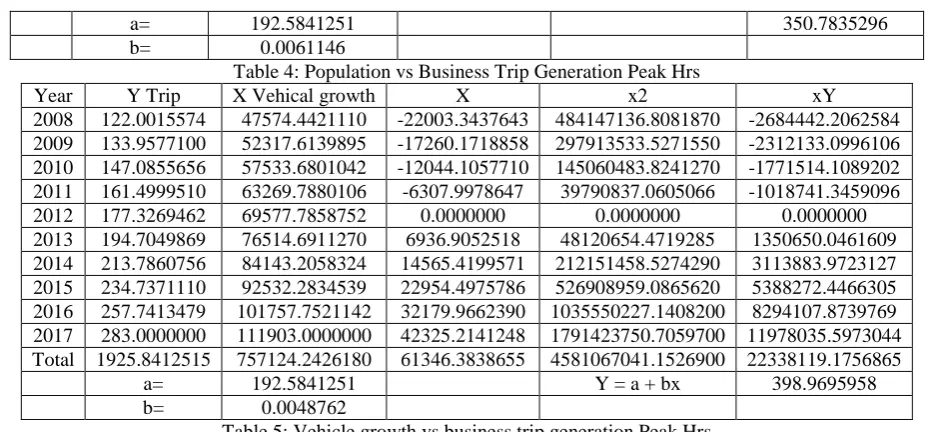
Table 2: B. Data Analysis
1) Correlation Regression Analysis for Peak Hours Y = Number of Trips
Xi = Income growth
Xp = Population growth Xv =Vehicle growth a = ∑Y/n
b = ∑xY / ∑x2 n = Number of years 2) Business Purpose
Year Y Trip X Income growth X x2 xY
2008 122.0015574 2354.4479488 -1018.1019316 1036531.5432136 -124210.0212065 2009 133.9577100 2575.7660559 -796.7838245 634864.4629199 -106735.3364704 2010 147.0855656 2817.8880652 -554.6618152 307649.7292421 -81582.7467798 2011 161.4999510 3082.7695433 -289.7803371 83972.6437539 -46799.5102315
2012 177.3269462 3372.5498804 0.0000000 0.0000000 0.0000000
2013 194.7049869 3689.5695692 317.0196888 100501.4830598 61725.3143461
2014 213.7860756 4036.3891087 663.8392283 440682.5209741 141919.5834483 2015 234.7371110 4415.8096849 1043.2598045 1088391.0196260 244891.7925500 2016 257.7413479 4830.8957952 1458.3459148 2126772.8073575 375876.0418054 2017 283.0000000 5285.0000000 1912.4501196 3657465.4599674 541223.3838475 1926 36461.0856515 2735.5868476 9476831.6701143 1006308.5013091
a= 192.5841251 395.6598872
b= 0.106186174
Table 3: Income Growth vs Business Trip Generation Peak Hrs
Year Y Trip X Population growth X x2 xY
2008 122.0015574 198136.1422166 -18697.4577834 349594927.5629510 -2281118.9681583 2009 133.9577100 202653.6462591 -14179.9537409 201071088.0936910 -1899514.1306928
2010 147.0855656 207274.1493938 -9559.4506062 91383095.8919775 -1406057.1987905
2011 161.4999510 212000.0000000 -4833.6000000 23363688.9599998 -780626.1630460
2012 177.3269462 216833.6000000 0.0000000 0.0000000 0.0000000
2013 194.7049869 221777.4060800 4943.8060800 24441218.5566448 962583.6980354
a= 192.5841251 350.7835296
[image:5.595.64.534.62.278.2]b= 0.0061146
Table 4: Population vs Business Trip Generation Peak Hrs
Year Y Trip X Vehical growth X x2 xY
2008 122.0015574 47574.4421110 -22003.3437643 484147136.8081870 -2684442.2062584 2009 133.9577100 52317.6139895 -17260.1718858 297913533.5271550 -2312133.0996106 2010 147.0855656 57533.6801042 -12044.1057710 145060483.8241270 -1771514.1089202 2011 161.4999510 63269.7880106 -6307.9978647 39790837.0605066 -1018741.3459096
2012 177.3269462 69577.7858752 0.0000000 0.0000000 0.0000000
2013 194.7049869 76514.6911270 6936.9052518 48120654.4719285 1350650.0461609
2014 213.7860756 84143.2058324 14565.4199571 212151458.5274290 3113883.9723127 2015 234.7371110 92532.2834539 22954.4975786 526908959.0865620 5388272.4466305 2016 257.7413479 101757.7521142 32179.9662390 1035550227.1408200 8294107.8739769 2017 283.0000000 111903.0000000 42325.2141248 1791423750.7059700 11978035.5973044 Total 1925.8412515 757124.2426180 61346.3838655 4581067041.1526900 22338119.1756865
a= 192.5841251 Y = a + bx 398.9695958
b= 0.0048762
Table 5: Vehicle growth vs business trip generation Peak Hrs Similarly income growth, population and vehicle growth is
tabulated with education trip, goods trip, social trip and work trip.
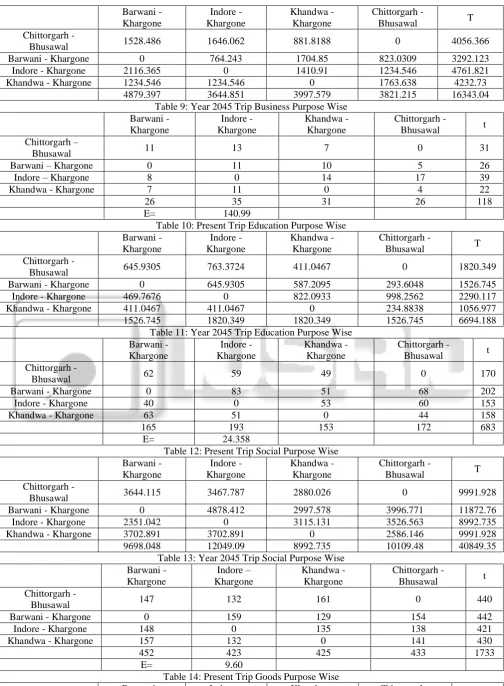
3) Trip Distribution Models
Trip Distribution Models Helps in the Separating the Number of Trips in Region or Zone wise Distribution of Total Number of Trips in Particular Region or Purpose. For a Zone the total Number of Trips Is generated by Trip generation Models but the percentage of Number of Trips in Different Purposes will identified with the trip Distribution Models. In General there are two technique First One is Growth factor Method and second is Synthetic Methods. Trip distribution models will
give the details of Percentage of Number of Trips in Particular purpose. Growth Factor Method are based on the assumption that the present travel pattern can be projected to the Design year in the future by using certain expansion factors. This can be represented by Formula:
Ti-j = ti-j X E Where,
Ti-j= Design year, Number of Trips from Zone i To Zone j. ti-j = Observed Base year , Number of Trips From Zone i To Zone j.
E = Growth Factor.
Trip Distribution Purpose Wise Barwani –
Khargone
Indore - Khargone
Khandwa - Khargone
Chittorgarh -
Bhusawal t
Chittorgarh – Bhusawal 20 16 22 0 58
Barwani – Khargone 0 15 36 11 62
Indore - Khargone 19 0 30 38 87
Khandwa – Khargone 15 22 0 27 64
54 53 88 76 271
[image:5.595.49.554.321.740.2]E= 61.391
Table 6: Present Trip Work Purpose Wise Barwani -
Khargone
Indore – Khargone
Khandwa - Khargone
Chittorgarh -
Bhusawal T
Chittorgarh -
Bhusawal 1174.809584 939.847667 1292.290542 0 3406.948
Barwani - Khargone 0 881.1071878 2114.657251 646.1452711 3641.91
Indore - Khargone 1116.069105 0 1762.214376 2232.138209 5110.422
Khandwa - Khargone 881.1071878 881.1071878 0 1585.992938 3348.207
3171.985876 2702.062043 5169.162169 4464.276418 15507.49
Table 7: Year 2045 Trip Work Purpose Wise Barwani -
Khargone
Indore - Khargone
Khandwa - Khargone
Chittorgarh -
Bhusawal T
Chittorgarh –
Bhusawal 26 28 15 0 69
Barwani – Khargone 0 13 29 14 56
Indore – Khargone 36 0 24 21 81
Khandwa - Khargone 21 26 0 30 77
83 67 68 65 283
E= 58.787
Barwani - Khargone
Indore - Khargone
Khandwa - Khargone
Chittorgarh -
Bhusawal T
Chittorgarh -
Bhusawal 1528.486 1646.062 881.8188 0 4056.366
Barwani - Khargone 0 764.243 1704.85 823.0309 3292.123
Indore - Khargone 2116.365 0 1410.91 1234.546 4761.821
Khandwa - Khargone 1234.546 1234.546 0 1763.638 4232.73
[image:6.595.46.551.62.749.2]4879.397 3644.851 3997.579 3821.215 16343.04
Table 9: Year 2045 Trip Business Purpose Wise Barwani -
Khargone
Indore - Khargone
Khandwa - Khargone
Chittorgarh -
Bhusawal t
Chittorgarh –
Bhusawal 11 13 7 0 31
Barwani – Khargone 0 11 10 5 26
Indore – Khargone 8 0 14 17 39
Khandwa - Khargone 7 11 0 4 22
26 35 31 26 118
E= 140.99
Table 10: Present Trip Education Purpose Wise Barwani -
Khargone
Indore - Khargone
Khandwa - Khargone
Chittorgarh -
Bhusawal T
Chittorgarh -
Bhusawal 645.9305 763.3724 411.0467 0 1820.349
Barwani - Khargone 0 645.9305 587.2095 293.6048 1526.745
Indore - Khargone 469.7676 0 822.0933 998.2562 2290.117
Khandwa - Khargone 411.0467 411.0467 0 234.8838 1056.977
1526.745 1820.349 1820.349 1526.745 6694.188
Table 11: Year 2045 Trip Education Purpose Wise Barwani -
Khargone
Indore - Khargone
Khandwa - Khargone
Chittorgarh -
Bhusawal t
Chittorgarh -
Bhusawal 62 59 49 0 170
Barwani - Khargone 0 83 51 68 202
Indore - Khargone 40 0 53 60 153
Khandwa - Khargone 63 51 0 44 158
165 193 153 172 683
E= 24.358
Table 12: Present Trip Social Purpose Wise Barwani -
Khargone
Indore - Khargone
Khandwa - Khargone
Chittorgarh -
Bhusawal T
Chittorgarh -
Bhusawal 3644.115 3467.787 2880.026 0 9991.928
Barwani - Khargone 0 4878.412 2997.578 3996.771 11872.76
Indore - Khargone 2351.042 0 3115.131 3526.563 8992.735
Khandwa - Khargone 3702.891 3702.891 0 2586.146 9991.928
9698.048 12049.09 8992.735 10109.48 40849.35
Table 13: Year 2045 Trip Social Purpose Wise Barwani -
Khargone
Indore – Khargone
Khandwa - Khargone
Chittorgarh -
Bhusawal t
Chittorgarh -
Bhusawal 147 132 161 0 440
Barwani - Khargone 0 159 129 154 442
Indore - Khargone 148 0 135 138 421
Khandwa - Khargone 157 132 0 141 430
452 423 425 433 1733
E= 9.60
Table 14: Present Trip Goods Purpose Wise
Barwani - Indore – Khandwa - Chittorgarh -
Chittorgarh -
Bhusawal 8296.882 7450.262 9087.062 0 24834.21
Barwani - Khargone 0 8974.179 7280.938 8691.972 24947.09
Indore - Khargone 8353.324 0 7619.586 7788.91 23761.82
Khandwa - Khargone 8861.296 8861.296 0 7958.234 25680.83
[image:7.595.45.547.66.148.2]25511.5 25285.74 23987.59 24439.12 99223.94
Table 15: Year 2045 Trip Goods Purpose Wise
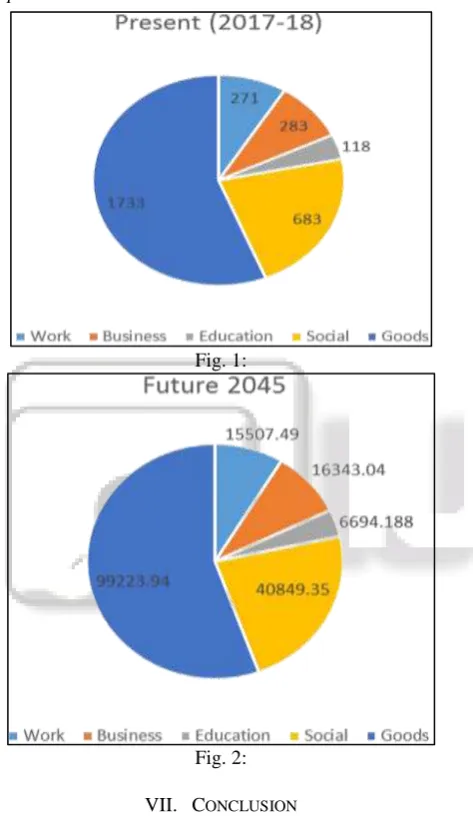
[image:7.595.56.293.178.587.2]C. Pie Chart Presentation of Present & Future Trips Purpose Wise
Fig. 1:
Fig. 2:
VII. CONCLUSION
The study is performed to analyze the future load of vehicles passing through Khargone, Madhyapradesh. The problem is to notice and analyze present traffic load and to calculate the increasing traffic load due to various reasons like population, business, works, goods and social purposes. It is found that in present state the traffic congestion is reached to upper tolerance limit. In next couple of years in the absence of ring road or a bypass the traffic will jam for hours and will cost high to transport and maintain the business and public convenience. The forecasting for 2045 in present study concluded that there is scope of growth as per trend for all purposes and the city is growing towards a hub for number of sectors. It is recommended to immediately plan and implement construction of ring road with well enough
capacity to bypass the traffic without affecting city traffic and avoiding congestions.
REFERENCES
[1] Modeling And Simulation Of Traffic Flow: A Case Study - First Ring Road In Downtown Madinah, Muhammad Nomani Kabir, Yasser M. Alginahi, Ali I. Mohamed, Modeling And International Journal of Software Engineering & Computer Systems (IJSECS) ISSN: 2289-8522, Volume 2, pp. 89-107, February 2016 [2] Todd Litman, Comprehensive Evaluation of Traffic Congestion Costs and Congestion Reduction Strategies, Smart Congestion Relief, Paper P12-5310, Transportation Research Board 2012 Annual Meeting [3] Sudhir C, et. al., Evaluation of Congestion Relief
Proposals in a Capital City, Hindawi Publishing Corporation Journal of Applied Mathematics Volume 2012
[4] Amol R.Rode, Analysis of Traffic Condition on Ring Road in Nagpur City, International Journal of Research in Advent Technology, Vol.2, No.9, September 2014. [5] Leni Stephen, Anjana Anna Sunny , Aravind S , Dipesh
P Nath, Planning And Design Of Ring Road, International Research Journal of Engineering and Technology (IRJET), Volume: 03 Issue: 09, Sep-2016. [6] Robert Bain, Error and optimism bias in toll road traffic
forecasts, Springer Science Direct, DOI 10.1007/s11116-009-9199-7, 2009.
[7] Kartikeya Jha , Nishita Sinha , Shriniwas S. Arkatkar, And Ashoke K. Sarkar, A Comparative Study On Application Of Time Series Analysis For Traffic Forecasting In India: Prospects And Limitations, Current Science, Vol. 110, NO. 3, 10 February 2016.
[8] Tim Veitch, Aaron Alaimo, Lauren Walker, Demand Forecasting for Toll Roads: An Approach to More Accurately Forecasting Traffic Volumes, Australasian Transport Research Forum 2013 Proceedings 2 - 4 October 2013, Brisbane, Australia.
[9] A.K.M. Abir and Md. Sami Hasnaine, Traffic volume study, Department Of Civil Engineering, Ahsanullah University of Science And Technology, 1995.
[10]P. .R. Pells, User Response to New Road Capacity: A Review of Published Evidence, Working Paper, Institute of Transport Studies, University od Leeds, 1989, [11]Jason D. Lemp, Understanding and Accommodating risk
And Uncertainty In Toll Road Projects: A Review Of The Literature, Transportation Research Record No. 2132: 106-112, 2009. Presented at the 88th Annual Meeting in January 2009 of the Transportation Research Board.
[13]Jingyuan Wang, Yu Mao, Jing Li, Zhang Xiong, Wen-Xu Wang, Predictability of Road Traffic and Congestion
in Urban Areas, April 7, 2015,
https://doi.org/10.1371/journal.pone.0121825.
[14]Artur Hołuj , Jarosław Frączek, The Importance Of The Measurement And Analysis Of Vehicle Traffic Volume For Designing Road Infrastructure. A Case Study Of Bysina, Infrastructure And Ecology Of Rural Areas, DOI:
http://dx.medra.org/10.14597/infraeco.2015.4.4.107, 2015.
[15]S.P. Sekar and S. Kanchanamala, An Analysis of Growth Dynamics in Chennai Metropolitan Area, Institute of Town Planners, India Journal 8 - 4, October - December 2011, 31 – 57.
[16]Bayes Ahmed, The Traditional Four Steps Transportation Modeling Using Simplified Transport Network: A Case Study of Dhaka City, Bangladesh, IJASETR, February 2012 Volume – 1, Issue – 1, Article 03.
[17]Shivendra Goel, J.B. Singh, Ashok Kumar Sinha, ( The Trip Distribution Model) for Delhi Urban Area Using Genetic Algorithm, International Journal of Computer Engineering Science (IJCES), Volume 2 Issue 3 (March 2012).
[18]S. A. Veenstra, T. Thomas, S.I.A. Tutert, The Trip distribution for limited destinations: The case study for grocery shopping trips in the Netherlands, Springerlink, Transportation (2010) 37:663–676, 676, 2010 MAY. [19]Amrita Sarkar, G.Sahoo and U.C.Sahoo, Application of
Fuzzy Logic in Transport Planning, International Journal on Soft Computing (IJSC) Vol.3, No.2, May 2012. [20]Md Majbah Uddin , Md Riad Hasan , Istiak Ahmed ,
Priyanka Das , Md Ahasan Uddin and Dr.Tanweer Hasan, A Comprehensive Study on Trip Attraction Rates of Shopping Centers in Dhanmondi Area. International Journal of Civil & Environmental Engineering IJCEE-IJENS Vol. 12 No. 04, 2012.
[21]Elyasuddin Jalal, Prof. Shoshi Mizokami, (The Transportation Policy For Kabul City), International Journal of Technical Research and Applications, Issue 32, September, 2015
[22]Mir Iqbal Faheem, A Frame Work for Traffic Impact Analysis, International Journal of Engineering, Economics and Management Volume 1, Issue 1, Sep- 2012
[23]Haitham M. Al-Deek, (The Comparison of Two Approaches for Modeling Freight Movement at Seaport), Journal of Computing in Civil Engineering, Oct, 2001. [24]Leena Samuel Panackel, Padmini A.K, Formulating a
Trip Production Prediction Model for the Residential Land Use in Medium Sized Towns of Kerala, IJRET, International Journal of Research in Engineering and Technology, Volume: 02 Issue: 09, Sep-2013.
[25]Nadezda Zenina, Arkady Borisov, Regression Analysis for Transport Trip Generation Evaluation, Information Technology and Management Science, 2013.
[26]Navya S.V, S. Sanjay K, Gymmy Joseph Kattoor, The Trip Generation Model for the Core Area of Thiruvananthapuram City kerla, International Journal of
Innovative Research in Science, Engineering and Technology, Volume 2, Special Issue 1, Dec, 2013. [27]Donald C. Shoup, Truth in Transportation Planning,
Journal of Transportation and Statistics, Vol. 6, No. 1, 2003.
[28]Kartikey Tiwari, Comprehensive Reporting Of Traffic Management System with Planning & Execution of Bus Rapid Transit Network in Indore City (M.P), India, IJIRD, Vol2, Issue 7, 2013
[29]Sustainable Urban Transport, Shanghai Manual – A Guide for Sustainable Urban Development in the 21st Century
[30]Dorina Pojani, and Dominic Stead, Sustainable Urban Transport in the Developing World: Beyond Megacities
, Sustainability 2015, 7, 7784-7805;
doi:10.3390/su7067784
[31]Dr.S.I. ONI, Issues In and Future Of The Urban Transportation and Traffic Management System in Nigeria, The Sixth International Conference on Competition and Ownership in Land Passenger Transport.
[32]Muhammad Nomani Kabir, Yasser M. Alginahi, Ali I. Mohamed, Modeling And Simulation Of Traffic Flow: A Case Study - First Ring Road In Downtown Madinah, International Journal of Software Engineering & Computer Systems (IJSECS) ISSN: 2289-8522, Volume 2, pp. 89-107, February 2016
[33]Sudhir C, et. al., Evaluation of Congestion Relief Proposals in a Capital City, Hindawi Publishing Corporation Journal of Applied Mathematics Volume 2012
[34]J. D. Ort´uzar and L. G. Willumsen. Modelling Transport, Fourth Edition, 2011, John Wiley & Sons. [35]The Institute of Transportation Engineers, Trip
Generation Handbook, 2nd ed. An ITE Recommended Practice, 2004.
[36]J.Rhee, The Improvement of Trip Generation Forecast with Category Analysis in Seoul metropolitan area. Conference on the Eastern Asia Society for Transportation Studies.
[37]J. Gonzalez-Feliu and F. Toilier and J.L. Routhier, End-consumer movements in French medium urban areas. ( The Sixth International Conference on the City Logistics), June 30 – July 2, Puerto Vallarta city, Mexico, 2009.
[38]I.Clark, The Trip Rate and Parking Databases in New Zealand and Australia. AITPM National Conference, The National Convention Centre, Canberra, Oct 31- Nov 2, 2007.
[39]M.Vrtic, P. Frohlich, A simultaneous disaggregate distribution and mode choice model: The theory and application for a regional public transport model. ERSA conference, July, 2005, Amsterdam, Netherlands. [40]Nelson\Nygaard Consulting Associates, ”Adjusting
Site-Level Vehicle Trip Generation Using URBEMIS”, San Francisco, USA, Tech. Rep. CA 94103, 2005.
[42]A.Milne, S.Abley and M.Douglass, “The Comparisons of NZ and UK Trips and Parking Rates”, Tech. Rep, NZ Transport Agency Research Report 374, 2009.
[43]A.Khalik and M.Al-Taei Amal, (The Prediction Analysis of Trip Production Using Cross-Classification Technique), Al-Rafidain Engineering, vol. 14, no. 4, pp.51-63, 2006.
[44]M.Mahmoud, M.Abdel-Aal, (“ The Cross classification trip production model for the city of Alexandria”), The Alexandria Engineering, vol. 43, no. 2, pp. 177-189, 2004.
[45]R.Cervero and K.Kockelman, “ The Travel Demand and the 3Ds: Density, Diversity, and Design”, The Transportation Research: D., vol. 2, no. 3, pp. 199-219, 1997.
[46]R.Ewing and R.Cervero, “ The Travel and Built Environment: A Meta- Analysis”, American Planning Association, vol. 76, no. 3, pp. 265-294, 2010.
[47]A.Justen,U. Beuck and K.Nagel, ”Application of the VISEVA demand generation software to Berlin using publicly available behavioral data”, 2006. Online Available: http://en.scientificcommons.org/20188383i. [Accessed May 31, 2013].
[48]Trips Rate Information Computer System. [Online]. Available: http://www.trics.org/. [Accessed May 30, 2013].
[49]The Trips Database Bureau. [Online]. Available: http://www.tdbonline.org. [Accessed May 30, 2013]. [50]Transport Roads nad Maritime Services. Road Projects.
[Online]. Available:
http://www.rta.nsw.gov.au/roadprojects. [Accessed May 30, 2013].
[51]Institutes of Transportation Engineers. [Online]. Available: http://www.ite.org. [Accessed May 30, 2013]. [52]R. Lee, J. Miller, R. Maiss,M. Campbell,K. Shafizadeh,D. Niemeier D, S.Handy, “ Evaluation of the Operation and Accuracy of Five Available Smart Growth Trip Generation Methodologies”. Online Available: pubs.its.ucdavis.edu/download_pdf.php?id=1495. [Accessed May 30, 2013].
[53]http://www.skyscrapercity.com/showthread.php?t=2636 11&page=5.
[54]http://jnnurm.nic.in/nurmudweb/cdp_apprep_pdf/CDP_ Appraisals_Nipfp/CDP‐ Indore.pdf.
[55]Comprehensive Traffic and Transportation Study for Indian Urban Area, CES in association with ICF Kaiser and Anil Verma Associates, 2004.