A Comparative Analysis of Iterative Techniques
Ensemble FSAC and Optimization Algorithms for
E-Commerce Application
J.S. Kanchana
Department of IT,
K.L.N College of Engineering, Sivagangai Dt , Tamil Nadu, India.Pincode- 630611.
S. Sujatha
Department of MCA,
Anna University of Technology, Trichy, Tamil Nadu, India.Pincode– 620024
ABSTRACT
Adaptation to individual preferences of user‟s personalization is a prominent challenge for the expansion of business application. One important factor that determines the quality of web-based customer service is the ability of a firm‟s website to provide individual caring and attention. The main objective of this research is to verify the impact of customer‟s information privacy concerns on firm‟s collection and use of consumer information for web-based personalization, where firms compete with different levels of ability in customer information utilization for personalization. Customer segmentation is achieved using direct grouping-based approach. In our paper Iterative technique partitions the customer in terms of directly combining transactional data of several consumers that forms different customer behaviour for each group, and best customers are obtained by applying approach such as IG (Iterative Growth), IR(Iterative Reduction) and IM(Iterative Merge) algorithm. The quality of clustering is improved via Ant Colony Optimization (ACO), Feature Selection aggregated Clustering approach (FSAC) and Particle Swarm Optimization (PSO).In this paper these three algorithms are compared and it is found that Iterative technique ensemble Feature selection aggregated clustering approach is better than the other two algorithms. Moreover the clustering quality is superior, along with this; response time is higher than the other algorithms.
Keywords
Mean square error, Dunn‟s Index, Chi Square Test.
1.
INTRODUCTION
Personalization has become an important business problem in various e-commerce applications, ranging from various dynamic web content presentations. Segmentation allows companies to target groups effectively, and allocate marketing resources to best effect. The tradition of dividing a customer base into groups of individuals that are similar in specific ways relevant to marketing; for instance age, gender, interests, spending habits and so on is termed as customer segmentation. Service personalization can help an online store give its customers a friendlier and individualized shopping experience which was not previously possible. Given its great potential, online service personalization has not been extensively addressed regarding the area of consumer behavioural research, so that very little guidance has been given with regard to the actual online store management. The purpose of this study is to empirically identify the dynamics of online service personalization, specifically in the context of
online apparel retail settings, and to furnish managerial insight into online retail management. Study of online service personalization is now in its infant stages.
Two significant research domains may be distinguished within web: scheduling and personalization. The main goal of scheduling is to maximize the total click-through rate for all advertisements by appropriately managing display time and advertising space on the web page. The problem is NP-hard and can be solved using linear programming extended with statistically derived entropy maximization of Lagrange and decomposition or some other approximation algorithms. Personalization seems to be an imperative and difficult challenge for current advertisers. Additionally it is more „„individualized‟‟ than target advertising, which simply divides customers in a market into specific segments. It intends to assign a suitable advertisement to a single web user rather than to a group of individuals. To achieve this goal, personalization systems need to have some information about the user. Many web portals create user profiles using information gained during the registration process or ask the user to answer some questions about their preferences. However, this requires a lot of time and effort wherein could discourage many users. Besides, users tend to give incorrect data when there are concerns about their privacy. Even reliable data become out of date with the evolution of online customer‟s interests.
An alternative solution is to exploit information stored in the web server logs. With regard to privacy fears, this method is safe and may also be useful for news portals or web sites where users do not need to log in for using the service. Another approach to advertisement personalization involves identifying short and long-term user interests. Short term interests are derived from keywords submitted by a user during a search. However, such keywords may often have nothing in common with the user‟s regular preferences. Long-term interests are taken from user profiles, which are completed by users and stored in the system database. Nevertheless, advertising personalization was performed using only short-term information.
various segmentation methods studied in the marketing literature, the one that are most closely related to our work are various clustering techniques, mixture models, (generalized) mixture regression models, and continuous mixing distributions. Clustering methods are classified into non overlapping methods, when the customer can belong to only one segment, overlapping methods when the customer can belong to more than one segment, and fuzzy methods when the customers can belong to different segments with certain probabilities. From this perspective, we prefer the non overlapping model of clustering approach, where the customers belong to only one segment.
Customer grouping by the level of family income, education, or any other demographic variable is considered as one of the standard techniques used by marketers for a long time. Recently, there has been much interest in the marketing and data mining communities in learning individual models of customer behaviour within the context of one-to-one marketing and personalization in this instance the models of customer behaviour are learned from the data pertaining only to a particular customer. These learned individualized models of customer behaviour are stored as parts of customer profiles and are subsequently used for recommending, delivering personalized products and servicing to the customers.
The similar work on research of evaluating the global optimal partition of customers are a) combinatorial optimization problems in operations research, b) customer segmentation and clustering in marketing, and c) data mining research on customer segmentation.
In this paper, we have employed iterative technique. This direct grouping approach, partitions the customer in terms of directly combining transactional data of several customers that forms different customer behaviour for each group, and finding the best partition of customers by comparing IG, IR & IM Algorithm. The clustering is performed using three algorithms ACO, FSAC and PSO. On including a small comparison it is evaluated that in FSAC approach clustering quality is better than other two algorithms. Not only cluster quality but also the response time is improved with respect to the FSO algorithm. The paper is organized containing related works in section 2, proposed work in section 3, section 4 is presented with experimental works finally this paper ends with conclusion.
2.
RELATED WORKS
To work on clustering partitions, the customer base and their transactional histories are placed into homogeneous clusters for the purpose of building better models of customer behaviour using these clusters. The authors in [1] had also provided a solution for customer segmentation. These approach problems having both the functions which are optimized and the functional form of the constraints restricting the possible solutions are linear functions. Although this linear restriction might seem overly constraining, the wealth of real-world problems that naturally assumes this form or can be acceptably transformed, possibly by adding many more variables along with constraints, into this mathematical structure which is extraordinarily large. While linear optimization belongs to the class of problems for which provably good algorithms exist; i.e. algorithms for which the running time is bounded by a polynomial in the size of the input – combinatorial optimization belongs to the class of problems(called NP-hard problems) for which provably efficient algorithms do not exist. To solve this problem the answer lies on how to resolve lack of unstimulus
characteristics of our fitness function. Several approaches are provided by the authors which are “branch & bound” enumerative Techniques [4], Lagrangian relaxation and decomposition methods [5], and cutting plane algorithms based on polyhedral combinatory [6]. As by [2] it was still complicated to come to an optimal solution. Some of the outstanding issues in personalization such as the degree of personalization, privacy, scalability, trustworthiness, intrusiveness, and usage of various metrics to measure effectiveness of personalization have been previously pointed out by several researchers, are discussed extensively in the literature. Following this the authors in [7] have proposed integration of advanced profiling and matchmaking techniques. For extracting the profiling information the authors have insisted upon certain modelling metrics such as conjunctive rules framing, signatures and sequences. Conversely adopting this methodology suffers difficulty in selection of metrics. This may not be well suited for the application at hand also not giving the accurate measurements.
In this paper to trounce the traditional approaches for clustering market basket type data, relations among transactions are modelled according to the items occurring in these transactions. However, an individual item might induce different relations in different contexts. Those contexts might be captured by interesting patterns in the overall data, having each transaction as a set of patterns through modifying the conventional pattern semantics. By clustering the patterns in the dataset, a clustering of the transactions is inferred and represented this way. For this, a novel hyper graph model is proposed in to represent the relations among the patterns. Nevertheless the time and space complexity is the major remark of this paper.
A user profile is defined as a vector of weights for a set of certain keywords as per [9]. Moreover customer profiles can be defined as sets of attributes combined with the sets of rules defining behaviour of the customer [14], sets of sequences such as sequences of Web browsing activities which are concentrated highly on [10], [11], [12], and signatures are used to capture the evolving behaviour learned from data streams of transactions [13]. There has also been some work done on modelling personalized customer behaviour by building appropriate probabilistic models of customers. Customer profiles using finite mixture models are built [9] and within [16] maximum entropy and Markov mixture models are employed for generating probabilistic models of customer behaviour.
3.
PROPOSED SYSTEMIZATION
A dataset is categorized into group of similar individuals; this process refers to cluster analysis. This is a branch in multivariate analysis and an unsupervised learning in pattern recognition. A physical or abstract structure of objects is referred as patterns. This is distinguished from others by a collective set of attributes called features, which together represents a pattern. The individuals or variables are classified based on the similarity of the characteristics they possess. It looks for minimizing within-group variance and maximizing between-group variance. The prime goal is to establish a set of clusters such that cases within a cluster are more similar to each other than they are to cases in other clusters. More particularly clustering analysis is a pre-processing step to another data mining application. There are many clustering algorithms so far prevailed for clustering. The prime substantive thing of data-clustering is to obtain optimal assignment of N objects in one of the K clusters where N is the number of objects and K is the number of clusters. In our paper three algorithms are deployed for optimization
3.1 Data Pre-processing
Prior to applying data mining algorithms a target data set must be assembled. As the raw data in the dataset is dirty, it is needed to do pre processing. The data is incomplete because the data has been arrived from “Not applicable” data value when collected and also human/hardware/software problems. Noisy data (incorrect values) may come from faulty data collection instruments Human or computer error at data entry, furthermore errors in data transmission Inconsistent data may be resulted from different data sources violating functional dependency (e.g., modify some linked data). Moreover some redundant data are also present. In our paper pre-processing is applied to clean the noisy data present.
3.2 Iterative Approach
The iterative technique makes decision on how to group customers into segments by directly combining different customers into groups and measuring the overall fitness score as a linear combination of fitness scores of individual segments.
In this iterative technique, there are three sub clustering methodologies present. The first approach commences from a single customer and tries to add one customer at a time by examining all customers that have not been assigned a group yet. This initial approach is called Iterative Growth (IG). If a new customer accompanying the group improves the fitness score of the group, then as per IG it will try to locate the “weakest” customer member in order to exclude from the group for the purpose of improving the fitness score of the group. Consequently, not only the customers lowering the performance of the group will be added, but also the worst performing customer if any, will be isolated from the group, where performance is defined in terms of the fitness function.
Assume there are set of N customers C1 . . , CN, and their
respective customer data be T= {TR (C1), TR (C2) --- TR
(CN) }. A single predictive model M on this group of
customers T is given by: Y = f(X1,X2, . . .Xt) where Y is
depending on the transaction and the independent variables X1,X2, . . .Xp ;The fitness function f can be relatively
complex, hence it represents the predictive power of an arbitrary predictive model M trained on all customer data contained in t. An instance of construction is a single predictive model M where the collection of customers T is constituted; Let M be a decision tree built on data T of customers C1 . . . CN. For the purpose of predicting Tj
variable “time of purchase”, all the transactional and demographic variables are used, except variable Tj (i.e., T U A – Tj ) as it is the independent variables. The fitness function f of model M can be its predictive accuracy on the out-of-sample data .The drawback of IG is that one particular customer group‟s fitness score may not improve until it grows to a certain “Critical mass” of an adequate number of customer purchasing transactions exhibiting “similar” purchase behaviour to train a good predictive model.
To address the “Critical mass” problem of IG, top-down IR approach was proposed where the process starts with a single group containing all the customers and eliminates the weakest performing customer one at a time until no more performance improvements are possible. The complete elimination is done by IR. Moreover all the eliminated customers are grouped together into one residual group, along with this it tries to reduce it using the same process. It is that as the removal of a single customer‟s transactions may not significantly affect the performance of large customer segments, hence IR is also prone to generate large suboptimal customer segments,
Another different approach called IM seeks to merge two existing customer groups at a time. Initially with segments containing individual customers, this approach combines two customer segments segA and segB, when the model based on the combined data performs better and combining segA with any other existing segments would have resulted in a worse performance than the combination of both segA and segB. Thus IM attempts to find the best pair of customer groups and merge them together resulting in the best merging combination.
3.3 Feature Selection Aggregated Clustering
Technique
In transactional data mining, χ2 statistic is used to measure the degree of dependency between a data and specific feature. This is done using a contingency table. Suppose there are n transactions they fall into m categories. The row variable, term, has two possible values: {w,-w}. The column variables may take either of the values {c,-c}. For example, O (w, c) is the number of transactions which lies within the category c and contain the term w, and O (-w, -c) is the number of transactions which neither belong to c nor contain w variables. In order to test the null hypothesis, the observed frequency is compared with the expected frequency calculated under the assumption that the null hypothesis is true. The value χ2 can be calculated as:
𝛘𝐰,𝐜𝟐 = 𝚺 (𝐨𝐛𝐬𝐞𝐫𝐯𝐞𝐝−𝐞𝐱𝐩𝐞𝐜𝐞𝐭𝐞𝐝)
𝟐
𝐞𝐱𝐩𝐞𝐜𝐭𝐞𝐝
where “observed” is the number of individuals of the given phenotype observed and ”expected” is the number of that phenotype expected from the null hypothesis
That test is taken for prediction of clusters.
1. For each feature perform a supervised feature selection method, such as Chi-square distribution.
2. Chi-square distribution is performed by extracting the feature and by prefixing a certain range. Depending on the chi square value acquired, the decision is taken whether to take that as cluster centroid.
3. For each transaction, compute the clustering criterion function with each cluster centroid in the new feature space. Assign each transaction to its best choice.
4. Repeat Steps 2 and 3 until convergence.
The cluster is taken depending on the observed value from the sample set of population.
3.4 ANT Colony Optimization
ACO initially engross with empty solution of strings. In the first iteration the same values are initialized for the elements of the pheromone matrix. More progressing with the iterations, depending on the solutions generated the pheromone matrix is updated. Every ant selects a cluster number with a probability value for each element of S feature to form its own solution feature S. According to the data clustering problem, the quality of constructed solution string S is measured by the value of objective function. This objective function is defined as the sum of squared Euclidian distances between each object and the centre of belonging cluster. Subsequently the agents are sorted increasingly by the objective function values. It is because objective function values and its fitness to the real solution are inversely proportional to each other. Fitness to real solution means lower objective function values are more approximated to real solution values.
[image:4.595.323.541.73.435.2]The prime objective of an optimal solution is to minimize the objective function value. The value of best solution in memory is updated with the best solution value of the current iteration if it has a lower objective function value than that of the best solution in memory, otherwise the best solution in memory is kept. This process explains that an iteration of the algorithm is finished. These steps repeatedly iterated by the algorithm until a certain number of iterations. The solution having lowest function value represents the optimal partitioning of objects from a given dataset into several groups. Obviously, lower the objective function value, the better the algorithm. In our approach the customer segmentation is done on applying ACO. A sample of data from dataset is extracted and applied in ACO. Besides that the inter distance similarity between the clusters were been evaluated based on Dunn‟s index.
Figure 1: System Architecture
3.5 PSO Algorithm
In the PSO document clustering algorithm, the multi-dimensional document vector space is modelled as a problem space. Each term in the document dataset represents one dimension of the problem space. Each document vector is represented as a dot in the problem space. The whole document dataset can be represented as a multiple dimension space by large number of dots in the space. To evaluate personal best , pbest , every particle keeps track of its coordinates in the solution space which are associated with the best solution (fitness) that has achieved so far by that particle. PSO will also trail another best value called gbest value. It is the best value obtained so far by any particle in the neighbourhood of that Particle. The crucial thing in PSO is accelerating each particle toward its pbest and the gbest locations, with a random weighted acceleration at each time step.
The current searching point is denoted as sk and the modified searching point is indicated as sk+1.. The current velocity is referred as vk , modified velocity is vk+1, velocity based on pbest as vpbes and velocity based on gbest as vgbest . The
modification of the particle‟s position can be mathematically modeled according to the following equation:
𝑽𝒊𝒌+𝟏= 𝐰 𝐕𝐢𝐤+ 𝐂𝟏 𝐫𝐚𝐧𝐝𝟏 … 𝐱 𝐩𝐛𝐞𝐬𝐭𝐢− 𝐒𝐢𝐤 +
𝐂𝟐 𝐫𝐚𝐧𝐝𝟐 … 𝐱 𝐠𝐛𝐞𝐬𝐭𝐢− 𝐒𝐢𝐤 … (1)
where, Vik implies velocity of agent i at iteration k, w
represents the weighting function, ci is the weighting factor,
uniformly distributed random number between 0 and 1 is
Dataset Pre-processing
IM IG IR
Optimization
PSO FS ACO
Performance Analysis
denoted as rand, 𝐬𝐢𝐤 represents the current position of agent i
at iteration k, pbesti indicates the pbest value of agent i, and
gbesti implies the gbest of the group. The value w represents
the weighting function.
𝒘 = 𝐖𝐌𝐚𝐱 − 𝐖𝐌𝐚𝐱 − 𝐖𝐌𝐢𝐧 ∗ 𝒊𝒕𝒆𝒓 /𝒎𝒂𝒙𝑰𝒕𝒆𝒓
(2)
Where WMax represents the Initial Weight, WMin corresponds to the final weight, Maximum Iteration is denoted
by maxIter , iter symbolizes the current iteration number.
𝐬𝐢𝐤+𝟏= 𝐬𝐢𝐤+ 𝐕𝐢𝐤 (3)
The performance of PSO is depending upon the weight value, the larger the value of w greater the global search ability, smaller the value of w greater the local search ability. Initially every particle adjusts its position using certain characteristics such as the current positions, the current velocities, the distance between the current position and the pbest, the distance between the current position and the gbest.
4. EXPERIMENTAL RESULTS
We have processed our experiments gathering Comscore data from Media Metrics which is a standard dataset. At the beginning the data is predisposed from the data set. While extracting, the data is noisy, containing missing values, subsequently the missing data are replaced with the mean squared error of that specific feature. After pre-processing the data is subjected to undergo the three suboptimal iterative segmentation approaches. Stochastically five data sets are taken for consideration.
[image:5.595.314.547.71.257.2]There are some noteworthy features for which data submits itself iterative segmentation approaches. Some of the demographic features are Domain Name, Day, Purchase Price, Customer Name, Customer city, Customer State etc. But those features are termed as significant features. An example of IM is purchase range is provided to merge the customers for which shop.com was resulted as the quite highest in purchase price and this is pictorially represented in Figure 2. Subsequently the clustering results obtained from PSO exposed in figure 3. Based on Purchase prize the clusters are detached having high, low ,very low, very high extents. An example for very low cluster is depicted in figure 3 as per PSO algorithm for which the clustering quality was observed as -0.02. Moreover as per the ACO algorithm the clustering quality was observed as 0.1739. In addition in the case of ACO the very low clustering criterion is mined for the feature purchase prize. It was experiential that the four values are obtained on this cluster centroid. This is delivered experimentally in figure 4.
Figure 2: Comprises Merging process (Datasets)
𝑸 = | 𝑪𝟏
𝒊|
𝒌
𝒊=𝟏 𝑿𝝐 𝑪𝒊𝒅(𝒙, 𝝁𝒊), where |Ci | is the number of data
points in cluster i, the value of Q will be small if (on average) the data points in each cluster are close. On scrutinizing this clustering quality is represented in figure 5.
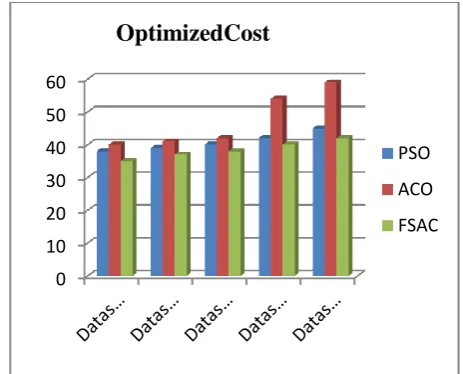
The graph is plotted between the number of transactions and the quality got in percentage. For 500 transactions the clustering quality observed was 57% for PSO, 59% for ACO and 64% for ACO. Figure 6 exemplifies the optimized cost acquired in the three approaches. The cost calculated was concerned on memory and processing time.
Figure 3: PSO based cluster (very Low cluster criteria) 0
500 1000 1500 2000
q
vc.com ae.com hsn.com
sm
ar
ter.com
gu
es
s.com
jt
v.com
in
fo
faq
.com
coa
ch
.com
elib.
o
rg
Purchase/Lakhs
Purchase/Lakhs
80 85 90 95 100 105
ebay.com elib.org
Purchase/lakhs
[image:5.595.314.543.422.629.2]Figure 4: ACO approach (with very low cluster criteria)
Figure 5: FSAC approach (with high cluster criteria)
[image:6.595.312.544.71.258.2]Figure 6: Portrayal of Clustering Accuracy
Figure 7: Depiction of cost on three approaches
4.
CONCLUSION
In this paper we have explored some approaches such as ACO, PSO and FSAC approaches. Initially applying this iterative approaches partitions the customers on combining transactional data of several customers and building a single model of customer behaviour on this combined data. Still optimizing this, data compassed is fetched into the clustering algorithms towards the goal of gaining optimized personalization. The experimental results reveal that on applying three algorithms, feature selection aggregated clustering algorithm exemplifies good performance in terms of clustering accuracy and cost wise performance is increased than the other two algorithms. In future this algorithm will be still enhanced which will be quite adaptable in text mining, web mining, fuzzy modelling domains. Moreover the accuracy of clustering can be improved too with this FSAC approach which will progress in future.
5.
REFERENCES
[1] Hoffman, K., Combinatorial Optimization: Current Successes and Directions for the Future. Journal of Computational and Applied Mathematics, 2000. 124: p. 341-360.
[2] Jiang, T. and A. Tuzhilin,” Segmenting Customers from Population to Individual Does 1-to-1 Keep Your Customers Forever?” IEEE TKDE, 2006. 18(10).
[3] Hoffman, K., Combinatorial Optimization: Current Successes and Directions for the Future. Journal of Computational and Applied Mathematics, 2000. 124: p. 341-360.
[4] Land, A.H. and A.G. Doig, “An automatic method for solving discrete programming problems” Econometrica, 1960. 28(97).
[5] Guignard, M. and S. Kim, Lagrangian decomposition: a model yielding stronger Lagrangian bounds. Mathematical Programming, 1987. 39: p. 215-228
[6] Gomory, R.E., Outline of an algorithm for integer solutions to linear programs. Bulletin American Mathematical Society, 1958. 64: p. 275-278.
0 50 100 150 200 250 300 350 400
Purchase/lakhs
Purchase/lakhs
0 500 1000 1500 2000
Purchase/Lakhs
Purchase/Lakhs
0 10 20 30 40 50 60 70 80
500 1000 1500 1700 2000
PSO
ACO
FSAC
Quality
0 10 20 30 40 50 60
PSO
ACO
[image:6.595.54.282.71.270.2][7] Adomavicius, G. and A. Tuzhilin, Personalization technologies: “A process-oriented perspective. Communication of the CAM”, 2005.
[8] M. Ozdal and C. Aykanat, “Clustering Based on Data Patterns Using Hypergraph Models,” Data Mining and Knowledge Discovery, vol. 9, pp. 29-57, 2004.
[9] M. Pazzani and D. Billsus, “Learning and Revising User Profiles: The Identification of Interesting Web Sites,” Machine Learning, vol. 27, no. 3, pp. 313-331, 1997
[10] D. Hand, H. Mannila, and P. Smyth, Principles of Data Mining, Sec. 6.3.2-6.3.3, MIT Press, 2001.
[11] B. Mobasher, H. Dai, T. Luo, and M. Nakagawa, “Using Sequential and Non-Sequential Patterns for Predictive Web Usage Mining Tasks,” Proc. IEEE Int‟l Conf. Data Mining (ICDM), 2002.
[12] M. Spiliopoulou, B. Mobasher, B. Berendt, and M. Nakagawa, “A Framework for the Evaluation of Session Reconstruction Heuristics in Web Usage Analysis,” INFORMS J. Computing, no. 2, p. 15, 2003.
[13] C. Cortes, K. Fisher, D. Pregibon, A. Rogers, and F. Smith, “Hancock: A Language for Extracting Signatures from Data Streams,” Proc. Sixth ACM SIGKDD Int‟l Conf. Knowledge Discovery and Data Mining (KDD), 2000.
[14] G. Adomavicius and A. Tuzhilin, “Expert-Driven Validation of Rule-Based User Models in Personalization Applications,” Data Mining and Knowledge Discovery, vol. 5, nos. 1/2, pp. 33-58,
2001.
[15] O. Nasraoui, M. Soliman, E. Saka, A. Badia, and R. Germain, “A Web Usage Mining Framework for Mining Evolving User Profiles in Dynamic Web Sites,” IEEE Trans. Knowledge and Data Eng., vol. 20, no. 2, pp. 202-215, Feb. 2008.
[16] E. Manavoglu, D. Pavlov, and C.L. Giles, “Probabilistic User Behavior Models,” Proc. Third IEEE Int‟l Conf. Data Mining (ICDM), 2003.
[17] P. Mitra, C. Murthy, and S.K. Pal, “Unsupervised Feature Selection Using Feature Similarity,” IEEE Trans. Pattern Analysis and Machine Intelligence, vol. 24, no. 3, pp. 301-312, Mar. 2002.
[18] Massih R. Amini 2000. Interactive Learning for text summarization, Proceedings of the PKDD workshop onMachine Learning and Textual InformationAccess. Massih R. Amini and Patrick Gallinari 2003.
[19] Semi- Supervised Learning with Explicit Misclassification Modeling, Proceedings of the 18th International Joint Conference on Artificial Intelligence, 555–560.
[20] J. Vesanto, SOM-based data visualization methods, Intell. Data Anal. 3 (2) (1999) 111–126.