http://dx.doi.org/10.4236/jcc.2015.36009
Research Model of Churn Prediction Based
on Customer Segmentation and
Misclassification Cost in the Context of Big
Data
Yong Liu, Yongrui Zhuang
School of Business, South China University of Technology, Guangzhou, China Email: [email protected]
Received 18 April 2015; accepted 1 June 2015; published 4 June 2015
Copyright © 2015 by authors and Scientific Research Publishing Inc.
This work is licensed under the Creative Commons Attribution International License (CC BY). http://creativecommons.org/licenses/by/4.0/
Abstract
Enterprises have vast amounts of customer behavior data in the era of big data. How to take ad-vantage of these data to evaluate custom forfeit risks effectively is a common issue faced by en-terprises. Most of traditional customer churn predicting models ignore customer segmentation and misclassification cost, which reduces the rationality of model. Dealing with these deficiencies, we established a research model of customer churn based on customer segmentation and misclas-sification cost. We utilized this model to analyze customer behavior data of a telecom company. The results show that this model is better than those models without customer segmentation and misclassification cost in terms of the performance, accuracy and coverage of model.
Keywords
Big Data, Churn Prediction, Customer Segmentation, Misclassification Cost
1. Introduction
numerous. Thus, rigorous data preprocessing as well as establishing a high efficiency and high precision mining models are required when analyze Big Data. Consequently, how to build a qualified mining model is of signi-ficance, which is the aim of this paper.
Churn prediction is a typical application of consumer behavior data mining. Churn is a common problem faced by enterprise and researches indicated that the cost of developing a new customer is approximate 5 times higher than the cost of retaining an old customer [4] [5]. As the competitiveness of the enterprise market would be severely weakened by churn, most companies will apply churn prediction through data mining to improve customer maintenance. Companies are able to previously recognize the consumers who are not reluctant to move toward a competitor by churn prediction, then, take appropriate marketing campaigns to maintain and re-tain these customers. Moreover, churn prediction allows companies to improve the efficiency of customer reten-tion campaigns and to reduce the costs associated with churn. Thus, how to use vast amounts of customer data effectively and improve the performance of churn prediction model is concerned by companies.
Scholars conducted a lot of research about churn prediction previously. Hung, et al. built several churn pre-diction model by data mining for wireless telecommunication company and indicated that both decision tree and neural network techniques could deliver accurate churnprediction models [6]. Gupta, et al. proposed linking Bayesian networks to structural equation modeling and applied it to decision support for customer retention in a virtual community [7]. The application results provided insights for practitioners on how to retain their customer. Owczarczuk tested the usefulness of the popular data mining models to predict churn and found that linear mod-els, especially logistic regression, were ideal choice when modeling churn of the prepaid clients [8]. Idris, et al., investigated the significance of a Particle Swarm Optimization (PSO) based under sampling method to handle the imbalance data distribution in collaboration with different feature reduction techniques [5]. Verbeke, et al., developed a novel, profit centric performance measure to select customers with the highest predicted probabili-ties to attrite in a retention campaign [9]. Their study indicated that that a small number of variables sufficed to predict churn with high accuracy, and that oversampling generally did not improve the performance significant-ly.
Reviewing previous studies, the properties of consumer selected and the model algorithms are relatively com-pleted and diverse. However, in terms of the modeling principle, most of the proposed models ignore to take customer segmentation as an important factor. Actually, the consumption habits, behaviors and characteristics in different consumer groups are different. Customer segmentation not only helps improve the recognition rate of churn prediction model, but facilitates companies to take more targeted customer retention campaigns. On the other hand, the loss which is caused by the churn prediction model misidentifying the loyal customers to the customers who intend to move toward competitors is totally different from the loss caused by misidentifying the loyal customers to the customers who intend to move toward a competitor (leave customers). But most pre-vious models do not distinguish these two situations and also reduce the practicability of the model. Furthermore, Xia summarized the intelligence degree and development course of customer churn prediction research, and in-dicated that the future research aspects of churn prediction would focus on improving the prediction accuracy and interpretability of model [10]. Based on the limitations of previous model and the future research aspects, this paper proposes a research model of churn prediction based on customer segmentation and misclassification cost factor. The proposed model will be applied to an actual customer management case of a telecommunica-tions operation.
2. Model Introduction
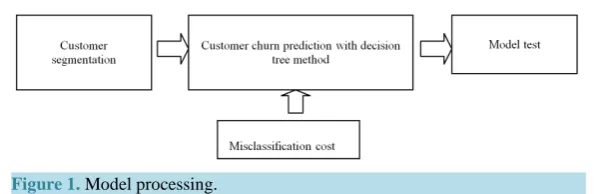
As seen in Figure 1, the main process of model is segmenting customers first, then combining decision tree al-gorithm (C5.0) with misclassification cost factor to predict customer’s status (loyal or pre-leave) on different customer groups. The case study showed that the proposed model is able to enhance the prediction accuracy of customer’s status, especially for pre-leave customers. Moreover, the output of the model includes database of customer behaviors casing customer churn, which is advantage for firms to develop targeted retention strategies.
2.1. Customer Segmentation
Figure 1. Model processing.
behavior and consumption levels, which is of benefit for enterprise to develop targeted marketing programs and reduce the cost of customer retention. Specifically, we use K-means method to cluster customers as this method is able to effectively and rapidly cluster large data sets, which is suitable to divide vast amounts of customer be-havior data.
2.2 Decision Tree Algorithm
Decision tree algorithm is fit for high-dimensional data processing because of its high classification accuracy and rapid computing process. In terms of the algorithm performance of decision tree, it is able to handle missing values of variables, and results can easily be corrected when appear new information. Furthermore, the output of decision tree is ease understanding which is of benefit for commercial purposes. Hence, decision tree is suitable to customer churn prediction when the data set is large and attached wide attributes.
We will use decision tree C5.0 which can deal with missing values, continuous or discrete data, to develop our customer churn prediction model in case study.
2.3 Misclassification Cost
Customer churn prediction aims to recognize the customers who intend to move toward a competitor. For enter-prises, the cost of developing a new customer is larger than the cost of retaining an old customer. Thus, we can infer that the loss caused by misclassifying pre-leave customers to loyal customers is larger than the loss caused by misclassifying loyal customers to pre-leave customers. When companies do not recognize pre-leave custom-ers, they will lose these customers with high probability.
3 Customer Management Case of a Telecommunication Operation
3.1 Model Data
In order to examine our model, we use customer data sets of a telecommunication operation to conduct our case study. According to the characteristics of the mobile user, we can grasp a customer’s consumption characteris-tics by analyzing his consumption listing within 3 months. Hence, we select customer consumption listings from November 2014 to January 2015 and churn data for February 2015 as our model data. This data contains a total of 1,048,575 records and 25 customer attributes like customer ID, costs, traffic, voice package information etc.
3.2 Data Preprocessing
After excluding abnormal samples, the original data sets remain a total of 1,016,610 records, including 27,925 customer churn records. The number of customer churn only accounts for 2.8% in the whole data records, which is extremely less than the number of loyal customer records. In order to deal with the data imbalance problem, we randomly select sample of loyal customer and customer churn from the processed data set and ensure their ratio is 3:1. Studies have shown that this ratio is good for customer churn prediction [4].
We excluded the customer attributes which do not affect customer churn prediction like customer ID, cus-tomer address etc, and remained 19 cuscus-tomer attributes eventually.
3.3 Model Implementation
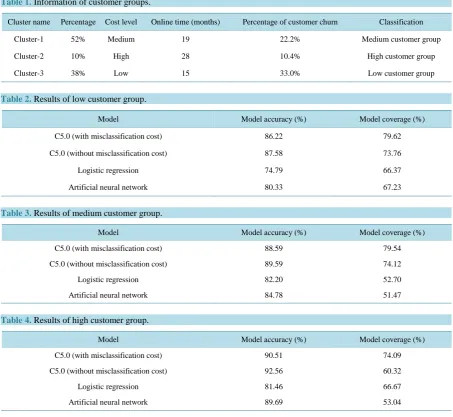
1) Customer Segmentationparameter is set to 3. Then we cluster the sample data by using K-means method with the help of Clementine. According to the average mobile data, average mobile cost and average talk time of different customer groups, we classified the customer groups shown in Table 1.
As seen in Table 1, in high customer group, the percentage and the percentage of customer churn are the smallest in three groups, but its online time is the longest. In contrast, in low customer group, the percentage and the percentage of customer churn are the largest and its online time is the shortest. Thus, information in different customer groups illustrates that this classification is reasonable.
2) Customer Churn Prediction
In order to make a comparison, we used C5.0 with misclassification cost, C5.0 without misclassification cost, logistic regression model and artificial neural network model to conduct customer churn prediction. Moreover, in order to examine the effect of customer segmentation, we also made a control group. For the purpose of eva-luating each model objectively, we calculated the accuracy and coverage of each model which are the index used to objectively assess predictive model [11].
The results of each model are listed in Tables 2-5.
4. Discussion
Based on presented results, we can make four conclusions: 1) The prediction accuracy of our proposed model is
Table 1. Information of customer groups.
Cluster name Percentage Cost level Online time (months) Percentage of customer churn Classification
Cluster-1 52% Medium 19 22.2% Medium customer group
Cluster-2 10% High 28 10.4% High customer group
Cluster-3 38% Low 15 33.0% Low customer group
Table 2. Results of low customer group.
Model Model accuracy (%) Model coverage (%)
C5.0 (with misclassification cost) 86.22 79.62
C5.0 (without misclassification cost) 87.58 73.76
Logistic regression 74.79 66.37
Artificial neural network 80.33 67.23
Table 3. Results of medium customer group.
Model Model accuracy (%) Model coverage (%)
C5.0 (with misclassification cost) 88.59 79.54
C5.0 (without misclassification cost) 89.59 74.12
Logistic regression 82.20 52.70
Artificial neural network 84.78 51.47
Table 4. Results of high customer group.
Model Model accuracy (%) Model coverage (%)
C5.0 (with misclassification cost) 90.51 74.09
C5.0 (without misclassification cost) 92.56 60.32
Logistic regression 81.46 66.67
[image:4.595.86.540.310.727.2]Table 5. Control group of customer segmentation.
Model Model accuracy (%) Model coverage (%)
C5.0 (with customer segmentation)* 87.88 79.03
C5.0 (with customer segmentation) 89.12 72.60
C5.0 (without customer segmentation) 86.58 52.06
Note: “*” means model combined misclassification cost; and the value of model accuracy and model coverage in C5.0 with customer segmentation is the weighted average number of the corresponding results of three customer groups.
relatively high. Specifically, the model accuracy is higher than 86% and the model coverage is higher than 74%. 2) The prediction accuracy presented by decision tree method is better than those presented by logistic regres-sion model and artificial neural network model. 3) Model accuracy presented by C5.0 with customer segmenta-tion is higher than C5.0 without customer segmentasegmenta-tion. Especially, in terms of model coverage, the former is significantly higher than the latter. 4) Although model accuracy presented by C5.0 with misclassification cost is slightly less than C5.0 without misclassification cost, model coverage of former is dramatically higher than latter. As, firstly, by combining misclassification cost, the proposed model will be emphasis on studying the consumer behavior of churn customers. Correspondingly, model will reduce the study weight of loyal customers’ consum-er behavior, which would obviously decrease the model accuracy when the numbconsum-er of loyal customconsum-ers in sample data set is three times larger than churn customers. The forth conclusion indicates the fact that though companies will pay slightly more maintain cost for customer retention as they pay more unnecessary maintain cost on loyal customer, they do greatly reduce the loss caused by customer churn as they enhance the prediction accuracy of pre-leave customers.
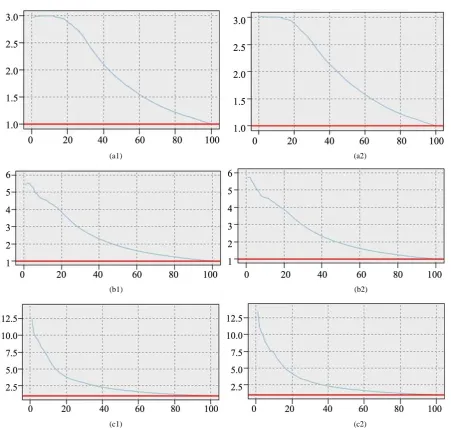
In order to make a further comparison between model with misclassification cost and model without misclas-sification cost, we calculated the lifting coefficients of each model by Clementine 12.0. Model with excellent prediction performance, the line of its lifting coefficients will star from a high value and smoothly down to 1. The results are shown in Figure 2.
As seen in Figure 2, although, in terms of low customer group, the discrepancy between them is difficult to be distinguished, in terms of the other two situations, the value of the starting points presented by models with misclassification cost are larger than control samples. Hence, we can inference that the prediction performance of model with misclassification cost is more excellent generally.
Therefore, by analyzing these two comparisons, we can conclude that conducting customer segmentation be-fore customer churn predicting is able to enhance the model accuracy and model coverage dramatically. Fur-thermore, the analysis of lifting coefficient indicates that the customer churn prediction models with misclassi-fication cost performance better than models without misclassimisclassi-fication cost, especially in recognizing pre-leave customer.
5. Conclusions
In the context of big customer behavior data, a customer churn prediction based on customer segmentation and misclassification cost is developed. The proposed model conducts customer segmentation first, which is of ben-efit for model to enhance its ability of churn customer recognition as well as facilitating companies to develop customer maintain strategy. Then, we make customer churn prediction with classification cost based on different customer groups. Finally, the proposed model is applied in a case study of a Chinese telecommunications opera-tion. The results suggest that the proposed model performances better than those models without customer seg-mentation and misclassification cost in terms of the accuracy and coverage of model.
(a1) (a2)
(b1) (b2)
[image:6.595.89.541.80.510.2](c1) (c2)
Figure 2.Lifting coefficients of each model. (a1) Result of model without misclassification cost in low customer group; (a2) Result of model with misclassification cost in low customer group; (b1) Result of model without misclassification cost in medium customer group. (b2) Result of model with misclassification cost in medium customer group; (c1) Result of model without misclassification in high customer group; (c2) Result of model with misclassification cost in high customer group.
Though reasonable solutions have been obtained, there are still some extensive research works to be done. In future work, topics like cluster features selection, similarity design as well as misclassification cost optimization would be the interesting themes that deserve future research efforts.
References
[1] Emeka, O. (2012) Readying for Big Data: Telefonica and Verizon Show the Way. America: OVUM.
[2] Ahn, H., Ahn, J.J., Oh, K.J., et al. (2011) Facilitating Cross-Selling in a Mobile Telecom Market to Develop Customer Classification Model Based on Hybrid Data Mining Techniques. Expert Systems with Applications, 38, 5005-5012. http://dx.doi.org/10.1016/j.eswa.2010.09.150
[3] Mcafee, A. and Brynjolfsson, E. (2012) Big Data: The Management Revolution. Harvard Business Review.
http://dx.doi.org/10.1016/j.asoc.2014.08.041
[5] Idris, A., Rizwan, M. and Khan, A. (2012) Churn Prediction in Telecom Using Random Forest and PSO Based Data Balancing in Combination with Various Feature Selection Strategies. Computers & Electrical Engineering, 38, 1808- 1819. http://dx.doi.org/10.1016/j.compeleceng.2012.09.001
[6] Hung, S., Yen, D.C. and Wang, H. (2006) Applying Data Mining to Telecom Churn Management. Expert Systems with Applications, 31, 515-524. http://dx.doi.org/10.1016/j.eswa.2005.09.080
[7] Gupta, S. and Kim, H.W. (2008) Linking Structural Equation Modeling to Bayesian Networks: Decision Support for Customer Retention in Virtual Communities. European Journal of Operational Research, 190, 818-833.
http://dx.doi.org/10.1016/j.ejor.2007.05.054
[8] Owczarczuk, M. (2010) Churn Models for Prepaid Customers in the Cellular Telecommunication Industry Using Large Data Marts. Expert Systems with Applications, 37, 4710-4712. http://dx.doi.org/10.1016/j.eswa.2009.11.083
[9] Verbeke, W., Dejaeger, K., Martens, D., et al. (2012) New Insights into Churn Prediction in the Telecommunication Sector: A Profit Driven Data Mining Approach. European Journal of Operational Research, 218, 211-229.
http://dx.doi.org/10.1016/j.ejor.2011.09.031
[10] Xia, G. (2010) Research on Current Situation and Development of Customer Churn Prediction. Application Research of Computers, 27, 413-416.
[11] Neslin, S.A., Gupta, S., Kamakura, W., Lu, J.X. and Mason, C.H. (2006) Defection Detection: Measuring and Under-standing the Predictive Accuracy of Customer Churn Models. Journal of Marketing Research, 43, 204-211.