Performance Evaluation of SVM and K-Nearest Neighbor
Algorithm over Medical Data set
J. S. Raikwal
Department of Information Technology, , Institute of Engineering & Technology,
Devi Ahilya University, Indore, India
Kanak Saxena
PhD, Department of Computer Application Samrat Ashok Technological Institute,
Vidisha, India
ABSTRACT
In this age of computer science each and every thing becomes intelligent and perform task as human. For that purpose there are various tools, techniques and methods are proposed. Support vector machine is a model for statistics and computer science, to perform supervised learning, methods that are used to make analysis of data and recognize patterns. SVM is mostly used for classification and regression analysis. And in the same way k-nearest neighbor algorithm is a classification algorithm used to classify data using training examples. In this paper we use SVM and KNN algorithm to classify data and get prediction (find hidden patterns) for target. Here we use medical patients nominal data to classify and discover the data pattern to predict future disease, Uses data mining which is use to classify text analysis in future.
Keywords
SVM, KNN, Patterns, Analysis, Classification.
1.
INTRODUCTION
Knowledge discovery in databases is relatively young and interdisciplinary field of computer science in this domain The actual task is the automatic or semi-automatic analysis of large quantities of data to extract previously unknown interesting patterns such as groups of data records (cluster analysis), unusual records (anomaly detection) and dependencies (association rule mining). This knowledge is formed using discovery of knowledge from the data which is generated by different domain is possible using data mining. Extraction of knowledge from data in a human-understandable structure is the main goal of data mining [7][5].Industries, education, business and many other domains required knowledge for growth and with stand in the point where they reached this kind of data is helpful.
The process of data mining consists of three stages:
1.1
Exploration
This phasetypically starts with data preparation or in other words data preprocessing which may involve cleaning data, data transformations, selecting subsets of records and - in case of data sets with large numbers of variables ("fields") - carrying out some introductory feature selection operations to bring the number of variables to a adaptable range (depending on the statistical methods which are being considered)[8][11][13]. Then, depending on the nature of the investigative problem, this first stage of the process of data mining may involve anywhere between a simple choice of straightforward interpreters for a regression model, [5] to decorative exploratory analyses using a wide variety of graphical and statistical methods (see Exploratory Data Analysis (EDA)) in order to identify the most relevant variables and determine the complexity and/or the general
nature of data models that can be taken into account in the next stage[8].
1.2
Model building and validation
This stage involves making an allowance for various models and pick out the best one based on their predictive performance (i.e., explaining the variability in question and producing stable results across samples)[5]. This may sound like a simple operation, but in fact, it from time to time involves a very elaborate process. There are a variety of techniques developed to achieve that goal - many of which are based on so-called "competitive evaluation of models," that is, applying different models to the same data set and then comparing their performance to choose the best [4].These techniques - which are often considered the core of predictive data mining - include: Bagging (Voting, Averaging), Boosting, Stacking (Stacked Generalizations), and Meta-Learning.
1.3
Deployment
That final stage involves using the model selected as best in the previous stage and applying it to new data in order to create predictions or approximations of the expected outcome[2][13]. But the output of mining is depending on data set and the algorithm used. Sometimes data is not classified as per need of application because of algorithm are not much suitable for the given data set [6]. There is a really a problem arises which data mining algorithm is most suitable for the data.
For that purpose, in this paper we are going to work with text mining technique, we work with two different techniques and compare the performance of both techniques. In this paper we conduct experiment over medical patient’s real survey data and evaluate performance of both algorithms.
2.
BACKGROUND
2.1
Related Work
With the explosive growth of data on the different domains like education, industries and others required to extract knowledge from data in such manner to explore much knowledge from that data. For that purpose we identify the most frequently used data mining algorithm and we found that for the classification purpose researchers are go through the SVM and K-NN [3].
To work with SVM and K-NN we decide to perform complete task under three steps.
Data analysis using the selected data models: here the implementation of algorithms includes. Data analysis using different algorithm includes data analysis or model building using both data models.
Result analysis: different system generated resultant parameters are generated. Result analysis includes the performance analysis of system on different parameters like accuracy, memory uses, time taken to build model and search time [4].
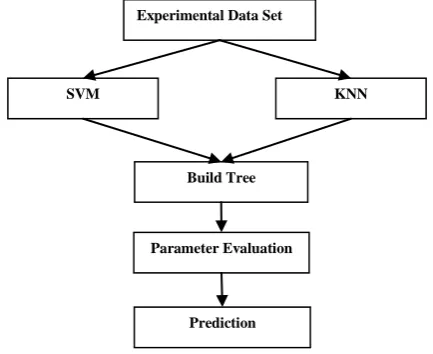
As shown in Figure 1, the considered experimental data set is applied to SVM and KNN to build the tree model. This tree model is then evaluated using certain parameters like accuracy, model build time, search time and memory used. The evaluation results are then analyzed and prediction is traced.
3.
PROPOSED WORK
In the proposed work to achieve given solution we will add these works in our goal:
1. Implementation of both Algorithms
2. Build model
3. Evaluate model
4. Extract model features (accuracy etc.)
5. Test models
3.1
System Architecture
Our complete system is combination of many small subsystems. The below given system diagram show the internal connection of the sub system.
3.1.1
Experimental data set
These data set contains information related to data by which we construct model for evaluation the selection of different data set in the format of *.arrf. This is used by a slandered machine learning tool called WEKA.
3.1.2
Data analysis models
we use three most popular models namely SVM and KNN. The data model forming process is depending upon data supplied to build model.
3.1.3
Build model
It is tree building process by which data is parsed and using the data system generates tree structure.
3.1.4
Parameter evaluation
In this phase data model is prepared and evaluation process is started. The evaluation of constructed model is done using cross validation process. In this cross validation process we randomly select data supply them over the build model, model predicts its output values and we compare the predicted values to the real values. And according to these predicted values we define accuracy, error rate and other factors.
3.1.5
Prediction
A constructed model can be used for the prediction for any given data.
4.
ANALYSIS
The complete implementation of the system is done using .net platform. Visual Studio includes a code editor supporting IntelliSense as well as code refactoring. The integrated debugger works both as a source-level debugger and a machine-level debugger. Other built-in tools include a forms
designer for building GUI applications, web designer, class designer, and database schema designer. It accepts plug-ins that enhance the functionality at almost every level— including adding support for source-control systems (like Subversion and Visual SourceSafe) and adding new toolsets like editors and visual designers for domain-specific
languages or toolsets for other aspects of the software development lifecycle (like the Team Foundation
Server client: Team Explorer). Due to this rich integrated development environment we select this framework for development [9].
To implement our model we use below given Algorithms.
4.1
KNN
In pattern recognition or classification, the k-nearest neighbor algorithm is a technique for classifying objects based on closest training examples in the problem space. KNN is a type of instance-based learning, or lazy learning where the function is only approximated locally and all computation is deferred until classification [3]. The k-nearest neighbor algorithm is amongst the simplest of all machine learning algorithms: an object is classified by a majority vote of its neighbors, with the object being assigned to the class most common amongst its k nearest neighbors (k is a positive integer, typically small). If k = 1, then the object is simply assigned to the class of its nearest neighbor.
The k-NN algorithm can also be adapted for use in estimating continuous variables. One such implementation uses an inverse distance weighted average of the k-nearest multivariate neighbors. This algorithm functions as follows [2]:
a) Compute Euclidean or Mahalanobis distance from target plot to those that were sampled.
b) Order samples taking for account calculated distances.
c) Choose heuristically optimal k nearest neighbor based on RMSE done by cross validation technique. d) Calculate an inverse distance weighted average with
the k-nearest multivariate neighbors. Experimental Data Set
SVM KNN
Build Tree
Parameter Evaluation
[image:2.595.320.537.192.369.2]Prediction
4.2
SVM
The support vector machine has been chosen because it represents a framework both interesting from a machine learning perspective. A SVM is a linear or non-linear classifier, which is a mathematical function that can distinguish two different kinds of objects. These objects fall into classes, this is not to be mistaken for an implementation [6].
To work with SVM we use leaner kernel for implementation. In linear algebra and functional analysis, the kernel of a linear operator L is the set of all operands v for which L(v) = 0. That is, if L: V → W, then
ker(L) = { v € V : L(v)=0 }
where 0 denotes the null vector in W. The kernel of L is a linear subspace of the domain V.
The kernel of a linear operator Rm → Rn is the same as the null space of the corresponding n × m matrix. Sometimes the kernel of a linear operator is referred to as the null space of the operator, and the dimension of the kernel is referred to as the operator's nullity.
5.
IMPLEMENTATION AND RESULTS
The previous section describes the used algorithm for implementation. The implementation of both algorithms is performed. And the results are described in this section.Performance evaluation of both algorithms is obtained using N cross validation process. And performance analysis is conduct under accuracy, model build time, search time, memory used.
5.1
Accuracy
It is defined as how close our prediction is? For example if we can say our data set contains 10 instances and we found 9 time our prepared model provide correct target values then the accuracy is 90%. Derived using the formula
Accuracy = (correct prediction/ total supplied values) * 100
5.2
Model build time
It is defined as time taken to build model using supplied data. Or we can simply say training time for the data model.
5.3
Search time
It is defined as time required predicting values.
5.4
Memory used
Memory used for this system is defined as required main memory for successfully working of the system.
5.5
Assumption and dependency
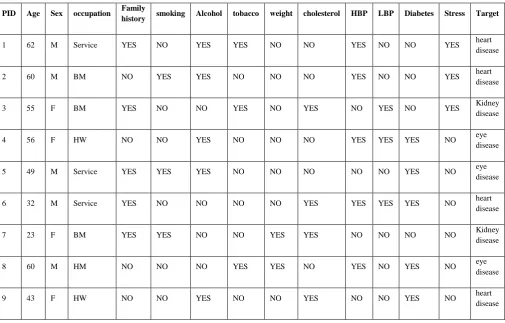
[image:3.595.52.558.428.751.2]The raw data are unstructured and individual listings aren't always clean-cut and complete as far as the fields listed above are concerned, this is problematic. Thus we select data for experiment purpose in CSV format.
Table 1. Experimental Data
PID Age Sex occupation Family
history smoking Alcohol tobacco weight cholesterol HBP LBP Diabetes Stress Target
1 62 M Service YES NO YES YES NO NO YES NO NO YES heart
disease
2 60 M BM NO YES YES NO NO NO YES NO NO YES heart
disease
3 55 F BM YES NO NO YES NO YES NO YES NO YES Kidney
disease
4 56 F HW NO NO YES NO NO NO YES YES YES NO eye
disease
5 49 M Service YES YES YES NO NO NO NO NO YES NO eye
disease
6 32 M Service YES NO NO NO NO YES YES YES YES NO heart
disease
7 23 F BM YES YES NO NO YES YES NO NO NO NO Kidney
disease
8 60 M HM NO NO NO YES YES NO YES NO YES NO eye
disease
9 43 F HW NO NO YES NO NO YES NO NO YES NO heart
5.6
Data format and their attributes
For the purpose of experiment we collect data of medical patients repeat our experiment more than five times. And produce the result obtained. Here we provide the data format and there attribute. Below given data shows our data which is used to train model and predict them.
There attributes are age, sex, occupation, family history, smoking, alcohol, tobacco, weight, cholesterol, HBP, LBP, Diabetes, Stress, and target. In machine learning there are two main things first training. Here the above given data is used to train algorithm actually training is a model building process where we design a data model to negotiate with it. And after that we use some data samples to test data. At the time of training required to supply all attributes with Target value which is required to be predicted.
After training or model building process we supply the test values to the model and negotiate with model. After negotiation we get the predicted values from the model. In our data set target is some values which is to be predicted or in ARRF format we can say target is our class value.
5.7
Results
To obtain results we use n cross validation process to find accuracy and other performance parameters. For evaluation we repeat our experiment on five different dataset with their different size. The experimental results and there attributes are given below section using tables and form of graph.
5.7.1
Accuracy
[image:4.595.313.550.111.361.2]After evaluation we found the following results of K-NN and SVM given in %.
Table 2. Table showing the accuracy of both systems
Data set size SVM k- NN
1000 82.542 79.225
500 76.279 76.538
200 81.528 86.151
100 80.73 85.245
50 78.282 86.864
As we can clearly see on the table and resultant graph accuracy of k-NN is keep high in most of the cases. But as size of dataset increases we can see accuracy of both system decreases. But k-NN simulates more poor results when size of data set increase.
5.7.2
Model build time
It is an elapse time taken by the system to build system.
Table 3. Table showing the build time of both systems
Data set size SVM (seconds) k- NN(seconds)
1000 3.273 9.155
500 1.629 6.582
200 1.284 6.114
100 0.732 3.25
50 .539 1.84
As we can clearly see on the table and graph of model build time of k-NN is keep high in most of the cases. But as size of dataset increases we can see time consumed for train model of both system increases. But KNN simulate more poor results when size of data set increase. It consumes large time for training.
5.7.3
Search time
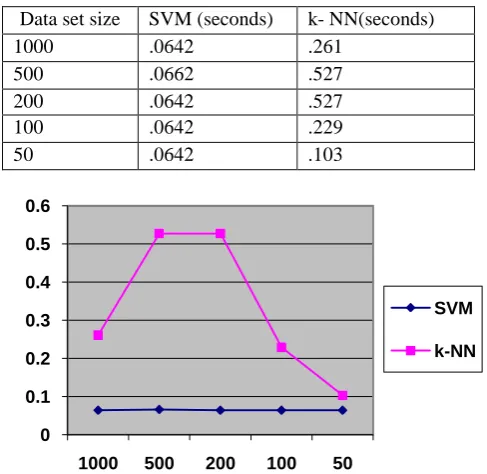
[image:4.595.46.288.427.528.2]Time taken to evaluate model is defined as search time. Below given values are for single value prediction in seconds.
Table 4. Table showing the search time of both systems
Data set size SVM (seconds) k- NN(seconds)
1000 .0642 .261
500 .0662 .527
200 .0642 .527
100 .0642 .229
50 .0642 .103
70 72 74 76 78 80 82 84 86 88
1000 500 200 100 50
SVM
[image:4.595.309.553.515.752.2]k-NN
Figure 2.Graph showing the accuracy of both systems
0 1 2 3 4 5 6 7 8 9 10
1000 500 200 100 50
SVM
k-NN
Figure 3. Graph showing the build time of both systems
0 0.1 0.2 0.3 0.4 0.5 0.6
1000 500 200 100 50
SVM
k-NN
[image:4.595.59.277.618.752.2]As we can clearly see on the table and graph of search time of k-NN is keep high in most of the cases. But as size of dataset increases we can see time consumed for predict values of KNN system increases. But in case of SVM remain constant.
5.7.4
Memory used
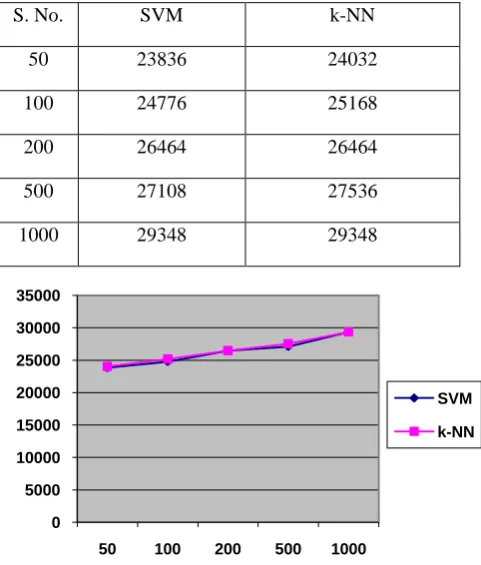
[image:5.595.52.293.174.457.2]Amount of main memory with is used to execute the algorithm is defined as memory used which is given in KB.
Table 5. Table showing the memory used for both systems
S. No. SVM k-NN
50 23836 24032
100 24776 25168
200 26464 26464
500 27108 27536
1000 29348 29348
As we can see in the graph and resultants table memory used by both systems are remain constant in all cases.
6.
CONCLUSION AND FUTURE WORK
After implementation we found that K-NN is a quit good classifier but when we apply this algorithm over textual data (Nominal data) it’s all performance parameters are varies according to the size of dataset. K-NN performs poor results as the size of data set increases it is best fit for small data set. SVM is complex classifier and here we implement leaner kernel. We found that the accuracy and other performance parameters are not too much depends over dataset size but about all factors dependent over the no of training cycles. It is best fit classifier for our text mining (contain mining).In future we use SVM for text analysis or web contains data analysis. With their application for web contains mining over medical data analysis.
7.
REFERENCES
[1] Application of Data mining in Medical Applications by Arun George Eapen A thesis presented to the University of Waterloo in fulfillment of the thesis requirement for the degree of Master of Applied Science in Systems Design Engineering Waterloo, Ontario, Canada, 2004 ©Arun George Eapen 2004
[2] Anthony S. Fauci, et al 1997. ―Harrison's Principles of Internal Medicine ed. New York‖: McGraw-Hill.
[3] Lloyd-Williams,M. ―Case studies in the data mining approach to health informationanalysis‖, Knowledge Discovery and Data Mining (1998/434), IEEEColloquium on,8May1998, 1996 Page(s): 1/1 -1/4 [4] Web mining techniques for automatic discovery of
medical knowledge David Sánchez, Antonio Moreno Department of Computer Science and Mathematics UniversitatRoviraiVirgili (URV) Avda. Països Catalans, 26. 43007 Tarragona (Spain) {david.sanchez, antonio.moreno}@urv.net
[5] Agirre, E., Ansa, O., Hovy, E., and Martinez, D.: Enriching very large ontologies using theWWW. Workshop on Ontology Construction (ECAI-00). 2000. [6] Berners-lee T., Hendler, J., Lassila O.: The semantic
web. Available
at:http://www.sciam.com72001/050lissue/0501berners-lee.html
[7] Cimiano, P. and Staab, S.: Learning by Googling. SIGKDD, 6(2), pp. 24-33. 2004.
[8] Etzioni, O., Cafarella, M., Downey, D., Kok, S., Popescu, A., Shaked, T., Soderland, S.and Weld, D.: Web Scale Information Extraction in KnowItAll. WWW2004, USA. 2004.
[9] Grefenstette G.: SQLET: Short Query Linguistic Expansion Techniques. In: InformationExtraction: A Multidisciplinary Approach to an Emerging Information Technology, volume1299 of LNAI, chapter 6, 97-114. Springer. SCIE-97. Italy, 1997.
[10]Press, William H.; Teukolsky, Saul A.; Vetterling, William T.; Flannery, B. P. (2007). "Section 16.5. Support Vector Machines". Numerical Recipes: The Art of Scientific Computing (3rd ed.). New York: Cambridge University Press. ISBN 978-0-521-88068-8. http://apps.nrbook.com/empanel/index.html#pg=883. [11]Cortes, Corinna; and Vapnik, Vladimir N.;
"Support-Vector Networks", Machine Learning, 20, 1995. http://www.springerlink.com/content/k238jx04hm87j80g /
[12]ACM Website, Press release of March 17th 2009. http://www.acm.org/press-room/news-releases/awards-08-groupa
[13]Aizerman, Mark A.; Braverman, Emmanuel M.; and Rozonoer, Lev I. (1964). "Theoretical foundations of the potential function method in pattern recognition learning". Automation and Remote Control 25: 821–837. [14]D. Coomans; D.L. Massart (1982). "Alternative k-nearest
neighbour rules in supervised pattern recognition: Part 1. K-Nearestneighbour classification by using alternative voting rules". AnalyticaChimicaActa136: 15–27. DOI:10.1016/S0003-2670(01)95359-0.
[15]D. G. Terrell; D. W. Scott (1992). "Variable kernel density estimation". Annals of Statistics 20 (3): 1236– 1265. DOI:10.1214/aos/1176348768.
[16]Mills, Peter. "Efficient statistical classification of satellite measurements". International Journal of Remote Sensing. [17]Nigsch F, Bender A, van Buuren B, Tissen J, Nigsch E,
Mitchell JB (2006). "Melting point prediction employing k-nearest neighbor algorithms and genetic parameter optimization". Journal of Chemical Information and Modeling 46 (6): 2412–2422. DOI:10.1021/ci060149f. PMID 17125183.
0 5000 10000 15000 20000 25000 30000 35000
50 100 200 500 1000
SVM
k-NN