Classification of Micro Array Gene Expression Data using
Statistical Analysis Approach with Personalized Fuzzy
Inference System
Tamilselvi Madeswaran
Research Scholar, Anna University of Technology, Coimbatore, Tamilnadu, India
G.M.Kadhar Nawaz
Director & Professor
Department of Computer Application,
Sona College of Technology, Salem, Tamilnadu, India
ABSTRACT
In this paper we describe a method to classify the micro array gene expression data based on their tissue sample types. Normally dimensionality reduction is performed over the micro array gene expression data set. Here, we propose a statistical approach for extracting significant genes from the gene expression data set. But, the statistical approach does not correctly identify the important genes. Hence, the ultimate objective is to solve the drawbacks in dimensionality reduction as they have a direct impact on the robustness of the generated fuzzy rules. Consequently, the goal is to generate fuzzy rules based on dimensionality reduced data. Hence, fuzzy inference is selected in our approach for classification and the fuzzy rules are utilized to train the fuzzy inference system (FIS). The classification performance of the fuzzy inference system (FIS) is similar to that of other classifiers, but simpler and easier to interpret. The classification performance of the FIS classifier is compared over the existing Fuzzy Genetic, Fuzzy Neural Network ProbPCA and PCA classifiers. The classification performance of the proposed technique is evaluated over the cancer datasets of Acute myeloid leukemia (AML) and Acute Lymphoblastic Leukemia (ALL).
Keywords
Micro array gene expression data, Gene patterns, Statistical approach, Fuzzy rules, Fuzzy Inference System (FIS), Dimensionality reduction
1. INTRODUCTION
Huge quantities of information are accumulated in databases that belong to diverse organization as a result of extensive computerization and availability of inexpensive storage facilities. Achieving competitive benefits by identifying formerly unidentified patterns in data that can guide the decision making process from this information is the decisive objective of this massive data collection. Hence, inventing tools and methods to extract information concealed in these databases is the need of the hour. Data mining has emerged as a successful solution for the identification of information concealed in databases. Data Mining has been conventionally defined as “the non-trivial extraction of implicit, formerly unknown and practically beneficial information from data in databases” [1] [2]. A particular enumeration of patterns (or models) over the data are produced under tolerable computational efficiency restrictions by the process of employment of computational techniques known as data mining which is the fundamental step of Knowledge Discovery in Databases (KDD) [3]. Discovery of formerly unknown, valid
patterns and relationships in huge data sets by data mining [7-9] involves the utilization of advanced data analysis tools. Statistical models, mathematical algorithms, and machine learning methods are some examples for such tools [4] [5].
The two broad categories of data mining tasks are Descriptive mining and Predictive mining [10]. Some examples for descriptive mining techniques are Clustering, Association Rule Mining and Sequential Pattern mining. Tasks such as Classification, Regression and Deviation detection are involved in predictive mining techniques. To sum up, abbreviating data and to emphasizing their interesting properties is the objective of descriptive data mining, while constructing models to predict future behaviors is the objective of predictive data mining [6]. Among these, a decisive role is played by classification in the field of micro array technology. Nowadays, concurrent measurement of the expression levels of thousands of genes, probably the entire set of genes in an organism, is practicable in a single experiment by means of micro arrays [14].
cancer classification [13] [11]. But, due to the high dimensionality and insignificant sample size of the gene expression data, classification in micro array technology is considered to be extremely difficult. Lots of researches have been performed for the successful classification of gene expression data. A few recent works available in the literature are reviewed in the following section.
2. RELATED WORKS
Li-Yeh Chuang et al. [20] have discussed that the learning method called support vector machine (SVM) produces equivalent or enhanced results than the neural networks on certain applications. They have employed SVM to take advantage of certain strategies of the SVM technique, such as fuzzy logic and statistical theories and group multiple cancer types by gene expression profiles. FSVM (fuzzy support vector machine) using the proposed strategies and outlier detection methods, has been able to achieve an equivalent or superior performance than other methods, and more adaptable architecture in distinguishing SRBCT and non-SRBCT samples.
Edmundo Bonilla Huerta et al. [21] have proposed a Genetic Algorithm (GA) approach integrated with Support Vector Machines (SVM) for the categorization of high dimensional Micro array data. A pre-filtering technique based on fuzzy logic has been associated with that approach. The gene subset whose fitness is computed by a SVM classifier has been evolved using the GA. The most informative genes have been identified by a frequency based technique using archive records of “good” gene subsets. Their approach has obtained competitive results with six existing methods when evaluated on two well-known cancer datasets.
Hieu Trung Huynh et al. [22] have discussed that DNA micro array used in molecular biology and biomedicine has been a multiplex technology. Computational methods are used to analyze the results of an arrayed sequence of thousands of microscopic spots of DNA oligonucleotides known as features contained in it. In recent times, the use of intelligent computing methods for the analysis of the micro array data has attracted the attention of numerous researchers. A significant role is played by many of the proposed machine learning based approaches such as gene expression interpretation, classification and prediction for cancer diagnosis in biomedical research. They have presented an application of the feed forward neural network (SLFN) for DNA micro array classification that employs singular value decomposition (SVD) approach for training. The activation function of the hidden units has been „tansig‟ for the classifier of the single hidden-layer feed forward neural network (SLFN). Experimental results have revealed that training procedure as well as network structure of the SVD trained feed forward neural network has been simple with minimal computational intricacy and could yield superior results with compact network architecture.
Pradipta Maji et al. [23] has discussed that the use of many information measures like entropy, mutual information, and f-information has been proved to be successful for choosing a set of relevant and non redundant genes from a high-dimensional micro array data set. But determining the true density functions and
carrying out the integrations necessary to calculate diverse information measures is extremely difficult for continuous gene expression values Consequently, the true marginal and joint distributions of continuous gene expression values have been approximated by introducing the concept of the fuzzy equivalence partition matrix. The theory of fuzzy–rough sets has been the basis of fuzzy equivalence partition matrix in which each row of the matrix characterizes a fuzzy equivalence partition that could be automatically extracted from the specified expression values. The class separability index and the predictive accuracy of the support vector machine of the proposed approach have been compared with that of existing approaches for assessing its performance. The effectiveness of the proposed method in identifying relevant and non superfluous continuous-valued genes from micro array data has been proved.
Venkatesh et al. [24] have discussed that the exhaustive study of genes and their functions has been termed as genomics. Techniques to evaluate thousands of genes in a single sample have been made possible by micro array analysis or gene expression profiling. Micro array analysis has been useful in diverse fields for obtaining beneficial information by processing huge quantity of data. Gene samples acquired from biopsy samples gathered from colon cancer patients have been presented. Artifacted states and separate malignant genes have been distinguished from normal genes by an introduced learning vector quantization method. From the review, it can be seen that most of the recent works have performed dimensionality reduction in a gene expression data but the results of those methods have drawbacks as the gene properties are not accurately presented in the gene results. Some of the methods do not correctly identify the important genes from the gene data set. Hence, the ultimate objective is to solve the aforesaid drawbacks in dimensionality reduction as they directly have impact on robustness of the generated fuzzy rules using enrichment of classifier for effective classification of micro array gene expression data.
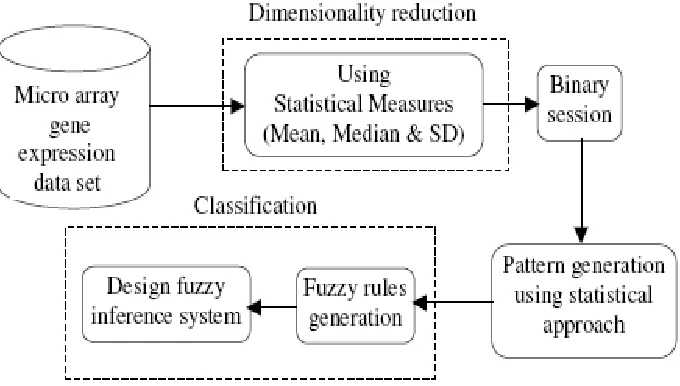
In this paper, we propose an effective classification technique that uses an enhanced fuzzy inference classifier. The dimensionality reduction of the gene expression dataset is performed by using statistical approaches. From the dimensionality reduced data, the important genes are identified and also the fuzzy rules are generated. The improved classifier is developed for classification and so it is trained using fuzzy rules. The well-trained classifier is used to the classification of micro array gene expression dataset. The rest of the paper is organized as follows. Section 3 details the proposed classification technique with required statistical operations and illustrations. Section 4 discusses about the implementation results and Section 5 concludes the paper.
3. CLASSIFICATION TECHNIQUE FOR
MICRO ARRAY GENE EXPRESSION
DATA
Figure 1: Structure of Our Proposed Classification System for Micro Array Gene Expression Data
3.1 Dimensionality reduction using statistical
approach
Let us consider the micro array gene expression data profile as
nm
X
;0
n
N
,
0
m
M
, whereN
,
M
representsthe number of samples and genes respectively. The gene data can be represented as
) , ( )
2 , ( ) 1 , (
) , 2 ( )
2 , 2 ( ) 1 , 2 (
) , 1 ( )
2 , 1 ( ) 1 , 1 (
M N N
N
M M
nm
x x
x
x x
x
x x
x
X
(1)
Each row and column of the gene expression dataset is represented in Equ. (2), where
N
andM
is the number of rows and columns in the dataset.}
,
,
{
},
,
,
{
1
2
N
m
1
2
M
n
r
r
r
C
c
c
c
R
(2)The gene data
X
nm
is higher and it is reduced by the dimensionality reduction. Dimensionality reduction is performed by using the statistical approaches such as mean, median and standard deviations that are computed over the gene expression data. But, before performing the dimensionality reduction process, distinction process is performed between the genes in the gene datasetX
nm
.Distinction process performed between first gene values of the first column
c
1(
x
(1,1))
withc
1(
x
(1,1)to
x
(N,1))
. The following algorithm describes the dimensionality reduction process by determining statistical parameters.Input:
X
nm
Output: statistical parameters
M
,
D
,
PS
and
SS
Step 1: Initialize
m
1
Step 2: for
n
1
N
)
(
)
(
(
1
,
)
(
,
)
'
m
n
m
m
m
nm
c
x
c
x
X
Step 3: Go to step1 and Increment
m
by 1 up toM
Step 4: SortX
nm
'
(
c
m
(
x
(
n
,
m
)
))
in ascending orderStep 5: Determine
T
M
v
// T is a threshold valueStep 6: Select
v
number of values from ))( ( ( , ) '
m n m nm c x X
Step 7:
v
number of ( ( ))) , ( '
m n m nm c x
X values
corresponding toXnm(cm(x(n,m))) values,
v
,are selected.Step 8: Find
M
,
D
,
PS
and
SS
forv
'valuesStep 9:
X
nm
X
nm
v
'new
, 0nN',0mM'Step 10: repeat step 1 to 7
Step 11: return
M
,
D
,
PS
and
SS
matrixesFor all genes, the values of mean
(
M
)
, population standard deviation(
PS
)
, sample standard deviation(
SS
)
and median)
(
D
are calculated in the dataset, and the results of these four matrices are obtained.3.2 Binary Session
session process and this matrixes rows and columns are represented as
}
,
,
{
},
,
,
{
1
(
)
2
(
)
(
)
(
)
1
(
)
2
(
)
(
)
)
(
' ' ' 'a
C
a
a
a
m
a
R
a
a
a
n
r
r
r
C
c
c
c
R
(3)}
,
,
{
},
,
,
{
1( ) 2( ) ( ) ( ) 1( ) 2( ) ( )) ( ' ' ' ' d C d d d m d R d d d
n
r
r
r
C
c
c
c
R
(4)}
,
,
{
},
,
,
{
1
(
)
2
(
)
(
)
(
)
1
(
)
2
(
)
(
)
)
(
' ' ' 'ps
C
ps
ps
ps
m
ps
R
ps
ps
ps
n
r
r
r
C
c
c
c
R
(5)}
,
,
{
},
,
,
{
1
(
)
2
(
)
(
)
(
)
1
(
)
2
(
)
(
)
)
(
' ' ' 'ss
C
ss
ss
ss
m
ss
R
ss
ss
ss
n
r
r
r
C
c
c
c
R
(6)The values in the matrixes are changed with the help of this binary session process threshold value. Binary session process is performed to reduce the computation complexity, because the values in the matrixes are not binary. Binary session process makes the further process in the gene classification easier. The following pseudo code explains the binary session process.
Input: Matrices
M
,
D
,
PS
,
SS
Output: Binarized matrices
M
'
,
D
'
,
PS
'
,
SS
'
Step 1: select columns from each matrix
M
,
D
,
PS
,
SS
Step 3: Determine
) ( min (')
' a m m C L
)
(
max
( ')' a
m
m
C
H
Step 5: find threshold
2
' '' m m
m
H
L
T
Step 6: Modify ( ) ) , ( ) ( ' '
' n m
a m x C with ' ' ' ' ' ' ' ' ' ) , ( ) , ( ) , ( ) ( ; 1 ; 0 ) ( m m n m m n m n a
m if x T
T x
if x
C
Step 7: repeat step 2 to 6 until all binarized matrixes are obtained for all matrixes M,D,PS,SS
Step 8:return the matrixes
M
',
D
',
PS
',
SS
'3.3 Pattern Generation
The patterns are generated from the result of the binary session process. That is, a set of matrix with each matrix having binary elements are obtained as a result of the binary session process. In a given set of matrix, the first element of each matrix is taken as one gene pattern, the second element of each matrix is taken as another gene pattern and this method is followed until the last value of the given matrix. The generated gene pattern
gh g g h hp
p
p
p
p
p
p
p
p
P
2 ) 1 ( 2 22 12 1 12 11 (7)Where
g
,
h
is the number of columns and rows.)
,
(
' (g,h) ' (g,h) ' (g,h) ' (g,h)gh
M
x
D
x
PS
x
SS
x
p
(8)Here, we used two types of gene expression datasets. The gene patterns for the two types of datasets are ALL and AML. Generated pattern
P
contains columnsg
from1
:
38
, where the ALL data type is from 1:26 and AML is from 27:38. If the gene pattern is in the form of 1011, then the first, second, third and fourth elements are from the matricesM
'
,D
'
,
PS
'
and
SS
'
respectively. Then, the pattern selection process is performed by the following pseudo code.Input: Pattern Matrix
P
Output: Selected gene patterns
P
'
Step 1: select
p
gh
Step 2: Count
p
gh
inP
Step 3: Sort
P
in ascending order based on count // row wise sortingStep 4: Compare
p
gh
) & , & , &
(p1h p27h p2h p28hp26h p38h Step 5: otherwise p p p p if p
P gh h h h h
; 0
...
; 1 27 26 38
'
Step 6:return
P
'
After this process, we perform gene classification using fuzzy interference system. The gene classification process is explained in the following section 3.4.
3.4. Classification of Micro array gene
expression using Fuzzy Inference System (FIS)
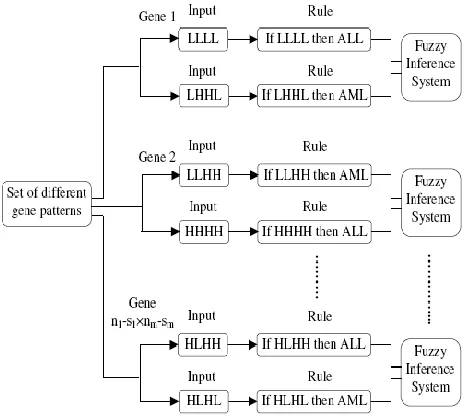
3.4.1 Fuzzy Rules Generation
We generate fuzzy rules for these selected patterns in
P
'
. The fuzzy rules are generated only for different types of gene patterns. For example we consider one gene patterns represented as,
LLLL
ALLLHHL
AMLWhere L value represents 0 and H value represents 1. The fuzzy rules are generated to the different types of gene patterns presented in
P
'
. Generally fuzzy rules are in the form of “IF A THEN B” and the IF-part of the rule is called as antecedent, and the THEN-part of the rule is called as the conclusion.The generated fuzzy rules are given below, IF input =LLLL THEN output = ALL IF input =LHHL THEN output =AML
Similarly the fuzzy rules are generated for all different gene patterns. Different fuzzy rules are generated from the gene patterns to design a fuzzy inference system.
3.4.2 Fuzzy Inference System
provides a basis from which decisions can be made, or patterns discerned. The process of fuzzy inference involves all of the pieces that are Membership Functions, Logical Operations, and If-Then Rules. We have to implement the fuzzy inference system based on fuzzy If-Then rules. The fuzzy inference system is developed for each fuzzy rule, for example if 30 fuzzy rules are generating from the fuzzy rule generation process, then we have to develop a fuzzy inference system for each of these fuzzy rules. Figure. 2 shows the generation of fuzzy rule and design of fuzzy inference system based on fuzzy rules.
Figure 2: Generation of Fuzzy Rules and Development of Fuzzy Inference System
The fuzzy inference system is trained by these fuzzy rules and training, testing processes are performed for all AML, ALL data set genes.
3.4.3 Training phase
In training process, we select all genes from the original data set but except one column and this column of genes is used for testing.
(i) Statistical operations are performed using dimensionality reduction pseudo code in section 3.1.
(ii) Then binary session and pattern generation processes in section 3.2, 3.3 are performed based on the result of statistical approach.
(iii) Finally, the fuzzy rules generation process in section 3.4 is performed over the generated patterns.
3.4.4 Testing phase
In testing phase, the particular testing column gene patterns are tested with the result of the training phase. Final decision of each experiment result depends upon the data type which occurs for a maximum number of times. This testing and training process are performed until all genes in a data set are involved in the testing process.
The proposed part illustrates that the micro array gene expression genes are classified accurately and the gene data set dimensions
are reduced effectively. The fuzzy inference system designed using statistical approaches to classify the micro array gene expression data are performs satisfactorily.
4. RESULTS AND DISCUSSION
[image:5.612.352.524.325.632.2]The proposed classification technique is implemented in MATLAB platform (version 7.8) and it is evaluated using the micro array gene expression data of human acute leukemias. The original dataset is of dimension
X
7192
andY
38
. This high dimensional dataset is subjected to dimensionality reduction using statistical approaches and so a dataset of dimensionX
100
andY
38
is obtained. In this data set 1 to 26 gene column data are ALL and 26 to 38 gene column data are AML. Here, 38 experiments are performed. For each experiment we develop a fuzzy inference system. The fuzzy inference system is trained using the fuzzy rules. Here we present the results of the 38th experiment. All data set gene values except the 38th column of the gene performs the training process. The training process gene patterns result tables for AML and ALL data set are shown in Table 1 and Table 2. These tables contain gene patterns values, gene index values and their frequency values.Table 1. ALL gene pattern
Index ALL Pattern Number of Frequency
7 11 14 15 16 17 18 27 29 31 32 36 39 44 45 49 52 54 61 62 66 70 73 75 76 79 81 87
0 0 0 0 0 0 1 1 0 0 0 0 0 0 0 0 1 1 1 1 1 0 1 1 0 0 1 1 0 0 0 0 0 0 0 0 0 0 1 1 0 0 1 1 0 0 0 0 0 0 0 0 0 0 0 0 0 0 0 0 0 0 0 0 0 0 0 0 0 0 0 0 0 1 0 0 0 1 0 0 0 1 0 0 0 0 0 0 0 0 0 0 0 1 0 0 0 1 0 0 0 1 0 0 0 0 0 0 0 0 0 0
Table 2. AML gene pattern
Index AML Pattern Number of
Frequency 7
11 14 15 16 17 18 27 29 31 32 36 39 44 45 49 52 54 61 62 66 70 73 75 76 79 81 87
0 0 1 1 0 0 0 0 0 0 1 1 0 0 1 1 0 0 0 0 0 0 1 1 0 0 0 0 0 1 0 0 0 1 1 1 0 1 0 0 0 1 1 1 0 1 0 0 0 1 0 0 0 1 0 0 0 1 0 0 0 1 0 0 0 1 0 0 0 1 0 0 0 0 0 0 0 0 0 0 0 0 0 0 0 1 0 0 0 1 0 0 0 0 0 0
0 0 0 0 0 0 0 0 0 1 0 0 0 1 0 0
6 6 5 7 5 5 4 6 4 4 4 7 6 7 7 11
9 8 9 8 7 8 7 6 9 7 6 8
[image:6.612.96.251.93.409.2]Here the 38th column gene data is taken for the testing process. Table 3 shows the testing result of the 38th gene pattern. In the first experiment, the 38th gene column is selected for testing and others for performing the training process. In the second experiment the 37th gene data is selected for testing and others for performing the training process. The statistical process and fuzzy rule generation processes are performed for the 38th column. Next we compare the result of 38th column gene patterns with training phase gene patterns. The result represents more ALL data type but the testing process 38th column is present in an AML data type. So the final decision of 38th experiment result is which data type occurs maximum number of time i.e. ALL data type.
Table 3. 38th experiment testing result
Experiment I Fuzzy
score
Decision
0 0 0 0 0 0 0 0 0 0 0 0 0 0 0 0 1 1 1 1 0 0 0 0 0 0 0 0 0 0 0 0 0 0 0 0 0 0 0 0 0 0 0 0 0 0 0 0 0 0 0 0 0 0 0 0 0 0 0 0 0 0 0 0 0 0 0 0 0 0 0 0 0 0 0 0 0 0 0 0 0 0 0 0 0 0 0 0 0 0 0 0 0 0 0 0 0 0 0 0 0 0 0 0 0 0 0 0 0 0 0 0
0.0503 0.8746 0.0503 0.0503 0.8746 1.2500 0.8746 0.0503 0.0503 1.2500 1.2500 0.0503 0.0503 0.0503 0.0503 0.0503 0.0503 0.0503 0.8746 0.8746 0.8746 0.0503 0.0503 0.8746 0.8746 0.8746 0.0503 0.0503
ALL AML ALL ALL AML AML AML ALL ALL AML AML ALL ALL ALL ALL ALL ALL ALL AML AML AML ALL ALL AML AML AML ALL ALL
Final decision ALL
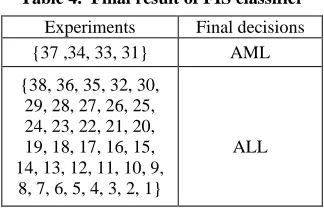
The Table 4 represents the final decision of 38 experiment results.
Table 4. Final result of FIS classifier
Experiments Final decisions
{37 ,34, 33, 31} AML
{38, 36, 35, 32, 30, 29, 28, 27, 26, 25, 24, 23, 22, 21, 20, 19, 18, 17, 16, 15, 14, 13, 12, 11, 10, 9,
8, 7, 6, 5, 4, 3, 2, 1}
ALL
Performance analysis
[image:6.612.355.522.100.434.2] [image:6.612.357.519.483.588.2]Table 5. Performance of FIS classifier and other existing classifiers
Statistical Measures
Fuzzy neural Network
PCA
Fuzzy neural Network ProbPCA
Fuzzy Genetic System
Fuzzy Inference
System (FIS)
TP 13 12 7 4
TN 17 15 18 25
FP 8 10 7 0
FN 0 1 6 9
Sensitivity
(%) 100 92 54 31
FPR (%) 32 40 28 0
Accuracy
(%) 79 71 66 76
Specificity
(%) 68 60 72 100
PPV (%) 62 55 50 100
NPV (%) 100 94 75 74
FDR (%) 38 45 50 0
MCC 1.68 0.50 0.25 0.48
True positive (TP): AML data type correctly identified as AML False positive (FP): ALL data type incorrectly identified as AML data type
True negative (TN): ALL data type correctly identified as ALL False negative (FN): AML incorrectly identified as ALL data type The FIS classifier detects the type of cancer from a given dataset with a good accuracy. The FIS classifier is established by comparing its classification performance with that of the existing Fuzzy Genetic, Fuzzy Neural Network ProbPCA and PCA classifiers. The comparison results are given in Table 6.
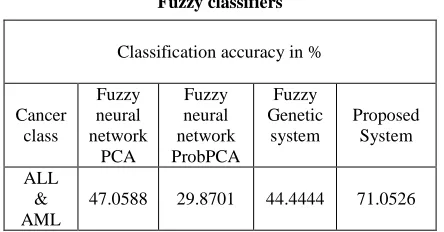
Table 6. Comparison between FIS classifier and existing Fuzzy classifiers
Classification accuracy in %
Cancer class
Fuzzy neural network
PCA
Fuzzy neural network ProbPCA
Fuzzy Genetic
system
Proposed System
ALL & AML
47.0588 29.8701 44.4444 71.0526
From the results shown in Table 6, it can be seen that the proposed technique has good classification accuracy compared to Fuzzy Genetic, Fuzzy Neural Network ProbPCA and PCA classifiers. The results show that the fuzzy inference classifier (FIS) performs satisfactorily in classifying the micro array gene expression dataset.
5. CONCLUSION
In this paper, a fast and efficient classification method called Statistical Analysis Approach using Fuzzy Inference System for gene classification based on micro array data is presented. The proposed technique is established by performing the classification of AML and ALL data set. The execution results have shown that the classification of gene data performed is of high-quality. The better classification performance realized is due to the use of an improved fuzzy inference system (FIS). The improvement in fuzzy inference system is achieved by generating fuzzy rules based on statistical approach. A statistical approach performs the dimensionality reduction in a micro array gene dataset. A very simple and effective fuzzy inference system is utilized to classify the cancer samples into their respective categories. This research overcomes the problems of dimensionality reduction and taking important genes from gene expression dataset. The comparison results for existing Fuzzy Genetic, Fuzzy Neural Network ProbPCA and PCA classifiers have established that the classification accuracy is more in the FIS classifier when compared to other classifiers. Hence, it can be concluded that the proposed classification technique is more effective in classifying the micro array gene expression data with higher classification accuracy.
6. REFERENCES
[1] Osmar, “Introduction to Data Mining”, In: Principles of Knowledge Discovery in Databases, CMPUT690, University of Alberta, Canada, 1999
[2] Kantardzic and Mehmed, “Data Mining: Concepts, Models, Methods, and Algorithms”, John Wiley & Sons, 2003 [3] Umarani and Punithavalli, "A Study on Effective Mining of
Association Rules from Huge Databases", International Journal of Computer Science and Research, Vol. 1, No. 1, pp. 30-34, 2010
[4] Chieh-Yuan Tsai and Min-Hong Tsai, " A dynamic Web service based data mining process system", In Proceedings of the 5th IEEE International Conference on Computer and Information Technology, pp. 1033-1039, 21- 23 September, 2005
[5] Lamine M. Aouad, Nhien-An Le-Khac and Tahar M. Kechadi, "Distributed Frequent Itemsets Mining in Heterogeneous Platforms", Journal of Engineering, Computing and Architecture, Vol. 1, No. 2, 2007
[6] J. Han and M. Kamber, “Data Mining: Concepts and Techniques. Morgan Kaufman, San Francisco, 2000
[7] Bigus, “Data Mining with Neural Networks”, McGraw-Hill, 1996
[8] Klaus Julisch,” Data Mining for Intrusion Detection -A Critical Review”, In Proceedings of the IBM Research on application of Data Mining in Computer security, Chapter 1 , 2002
[image:7.612.64.286.491.607.2][10] Umarani and Punithavalli, "A Study on Effective Mining of Association Rules From Huge Databases", International Journal of Computer Science and Research, Vol. 1, No. 1, pp. 30-34, 2010
[11] Yendrapalli, Basnet, Mukkamala and Sung, “Gene Selection for Tumor Classification Using Microarray Gene Expression Data", In Proceedings of the World Congress on Engineering, London, U.K., Vol. 1, 2007
[12] Sandrine Dudoit, Jane Fridlyand and Terence P. Speed, “Comparison of Discrimination Methods for the Classification of Tumors Using Gene Expression Data”, Journal of the American Statistical Association, Vol. 97, pp. 77-87, 2002
[13] Peterson and Ringner, “Analyzing Tumor Gene Expression Profiles”, Artificial Intelligence in Medicine, Vol. 28, No. 1, pp. 59-74, 2003
[14] Anandhavalli Gauthaman, "Analysis of DNA Microarray Data using Association Rules: A Selective Study", World Academy of Science, Engineering and Technology, Vol.42, pp.12-16, 2008
[15] Chintanu K. Sarmah, Sandhya Samarasinghe, Don Kulasiri and Daniel Catchpoole, "A Simple Affymetrix Ratio-transformation Method Yields Comparable Expression Level Quantifications with cDNA Data", World Academy of Science, Engineering and Technology, Vol. 61, pp.78-83, 2010
[16] Khlopova, Glazko and Glazko, “Differentiation of Gene Expression Profiles Data for Liver and Kidney of Pigs”, World Academy of Science, Engineering and Technology, Vol. 55, pp. 267-270, 2009
[17] Ahmad m. Sarhan, "Cancer classification based on microarray gene expression data using DCT and ANN", Journal of Theoretical and Applied Information Technology, Vol. 6, No. 2, pp. 207-216, 2009
[18] Ying Xu, Victor Olman and Dong Xu, "Minimum Spanning Trees for Gene Expression Data Clustering", Genome Informatics, Vol. 12, pp. 24–33, 2001
[19] Lucila Ohno-Machado, Staal Vinterbo and Griffin Weber, "Classification of Gene Expression Data Using Fuzzy Logic", Journal of Intelligent & Fuzzy Systems, Vol. 12, No. 1, pp. 19-24, January 2002
[20] Li-Yeh Chuang, Cheng-Hong Yang and Li-Cheng Jin, "Classification Of Multiple Cancer Types Using Fuzzy Support Vector Machines And Outlier Detection Methods",
Biomedical Engineering applications, Basis and
Communications, Vol. 17, No. 6, pp. 300-308, December 2005
[21] Edmundo Bonilla Huerta, Beatrice Duval and Jin-Kao Hao, "A hybrid GA/SVM approach for gene selection and classification of micro array data", In Lecture Notes in Computer Science, pp. 34-44, Springer, 2006
[22] Hieu Trung Huynh, Jung-Ja Kimand Yonggwan Won, "Classification Study on DNA Micro array with Feed forward Neural Network Trained by Singular Value
Decomposition", International Journal of Bio- Science and Bio- Technology Vol. 1, No. 1, pp. 17-24, December, 2009 [23] Pradipta Maji and Sankar K. Pal, "Fuzzy–Rough Sets for
Information Measures and Selection of Relevant Genes from Micro array Data", IEEE Transactions on Systems, Man, and Cybernetics, Vol. 40, No. 3, pp. 741-752, June 2010 [24] Venkatesh and Thangaraj, "Investigation of Micro Array
Gene Expression Using Linear Vector Quantization for Cancer", International Journal on Computer Science and Engineering, Vol. 02, No. 06, pp. 2114-2116, 2010
Tamilselvi Madeswaran received the B.Sc. and MCA. Degrees from the Department of Computer Science affiliated to Madras Univeristy in 1995 and 1998, respectively. She has done her Master of Philosophy degree in the department of Computer Science from Allagappa University in the year 2006.She is currently pursuing Ph.D. degree, working closely with Prof. G.M.Kadhar Nawaz. She worked at Lecturer and senior Lecturer in the Sona College Of Technology from 2000 to 2008. She served in the TULEC Computer Education Center as Programmer and acted as Guest Lecturer in the Government College, Salem,India. She is also worked as Academic councellor and University coordinator in the Indira Gandhi Open University and TamilNadu Open University. She is also a member in Computer society of India. She works in the field of Fuzzy Logic, Semantic Web and Networks. She is author of more than 9 publications in
national and international conferences. She Received
Appreciation award for the producing Best Results in the University Exam. She has guided 50MCA Projects.