How to cite this paper: Nada, S. and Hamed, M. (2014) Energy Pricing in Developing Countries. Open Access Library Journal, 1: e869. http://dx.doi.org/10.4236/oalib.1100869
Energy Pricing in Developing Countries
Sara Nada1, M. Hamed2*
1Università degli studi di Roma “Tor Vergata”, Rome, Italy
2Department of Electrical Engineering, Faculty of Engineering, Port Said University, Port Said, Egypt
Email: *[email protected]
Received 31 June 2014; revised 1 August 2014; accepted 11 September 2014 Copyright © 2014 by authors and OALib.
This work is licensed under the Creative Commons Attribution International License (CC BY). http://creativecommons.org/licenses/by/4.0/
Abstract
This paper investigates the electric energy tariff in the developing countries on the basis of per unit system analysis. The smallest actual value of a tariff in the sample of countries is considered as the base for the studied system and so, a comparison is done. A tariff map is proposed for the dynamic variation of tariffs in different countries where the map becomes as a texture image. This simplifies comments and conclusions for the tariff traveling within others. The sample of coun-tries is extended to three continents in order to differentiate between different systems of energy tariffs. It contains four groups as: Arab countries in two divisions, Asian group and African coun-tries where different investigations and directions may be applied with. Single-phase and three- phase electric loads have been inserted and analyzed. A normalized fluctuation factor is proposed as an indicator to determine the philosophy of tariff variation in each country relative to others. Both domestic and commercial tariffs are analyzed and a sample of industrial energy price is in-vestigated for specified power demands. It is recommended to use normalized fluctuation factor and tariff map for the evaluation of economic support.
Keywords
Economic, Energy, Tariff, Developing Countries, Domestic, Commercial, Industrial
Subject Areas: Engineering Management, Marketing, Strategic Management Policy
1. Introduction
Recently, the energy generation is the subject facing the world due to lake in the future traditional sources of fu-els besides the expensive situation for the utilization of renewable energy. So, the specialists in both fields are interested in reduction of the electric power generation and its transmission to be handled by customers at the terminals of electric distribution systems. Then, the aimed generation may be troubled to some economic prob-lems if the system required is a high cost for installation or even continuous operation and maintenance. This is *
OALibJ | DOI:10.4236/oalib.1100869 2 September 2014 | Volume 1 | e869
a direct connection to the reliability level of continuous supply at the terminals of consumers so that an addition for the initial cost may be necessary [1]-[3].
In developed countries, this problem may be ignored because they can optimize the cost for such cases. Con-trary, this is difficult for not only the developing countries but also the rapid developing countries since the problem basis is still the same. Thus, the study of economic media for the energy consumption appears to be a vital point but the subject entry may be varied according to the side of analysis [4] [5].
The present paper faces this target in two directions where the first one will be the tariff of electricity in some developing countries. Secondly, the dynamic state for tariffs in the selected countries can be investigated in or-der to reach the final actual situation for the tariff comparison. Since the tariff is varying from a country to another, a united style may be suggested. This leads to the per unit system dependency where all values should be referred to a single base value. The proposed concept simplifies the investigation to get the real difference between the sampled countries. However, each country has its self financial or economic structure although the strategy of the variation in the dynamic state of tariffs can represent as actual image—the real position of the energy costing in each [6] [7].
2. Problem Formulation
The tariff is a wide varying subject around the world in spite of the different economic base (capitalism, etc.) for each. Mainly, a tariff should reflect the real cost of energy although in some countries this is not the rule. Many countries directed towards the supporting of this tariff while some others went to a permissible free market. Also, others can depend on the cooperation between different companies in the field to decide the suitable tariff within the open competitive market. The competition here goes to the benefit of consumers while this case could help well in the activation of the marketing conditions [8].
Otherwise, Tariff setting is guided by the balance between consumers and electric companies where the con-sumers may be simple domestic persons, investors, big investors, different types of private and governmental companies (industrial, commercial, service, etc.) including all loading systems (single phase, or 3 phase). Nor-mally, there is a legal customer but sometimes a deviant consumer may be found. This is an important point if the deviant consumer number is increased on the country scale. This will be a hurt for others so that the electric companies must put the suitable regulations to prevent this phenomenon. On the other hand, the legal consumers should be encouraged by providing them with fair and reasonable price structures consistent with maintenance of a financially and operationally secure electricity supply system. Also, the future progress towards a commer-cially competitive system could be introduced and tariff structure discrimination for cost reflective tariff to each customer group would be based clearly. However, the investment sector may represent a large consuming ener-gy so that companies may permit a reasonable return/profit to give confidence to current investors as well as to attract new investors [4] [9].
It should be noted that, electric companies can encourage consumers to make efficient utilization of energy based on price signal while they must encourage, also, the operators to make efficient use of plants besides the operational efficiency based on financial benefits and penalties [10]. However from the economic point of view, the price stability appears to be the major factor for electric tariffs in general. Sharp fluctuations in prices are de-trimental to commercial functioning because they can result in deviant consumer behavior and increase the level of theft. Sharp price hikes can also damage the public credibility of reform in terms of their consumer welfare enhancing impact. Thus, the tariff item takes the majority roll in the developing countries where the poverty may be increased than the developed countries [11]. The tariff is normally depends on the three steps of connections of united networks in order to determine the optimal value for the tariff. These steps are the generation, trans-mission and distribution till the final terminals of customers (consumers). The slab tariff countries would be se-lected and so, the analysis can be based on the comparison style as well as the statistical evaluation for the han-dled data [12].
3. Domestic Tariff
Monthly tariffs (in USA Cents) for the first division of Arab countries in the selected sample, as available for the
study is collected in Table 1 where the slab style of tariffs for the domestic energy consumption is shown. Also,
all data of tariffs may be getting together in a single sheet (Table 1) although the step of each slap is different
OALibJ | DOI:10.4236/oalib.1100869 3 September 2014 | Volume 1 | e869
then an extension can be implemented as shown in the first column of the Table 1.
These monthly values are repeated in the drawing shape (Figure 1) where the raising style of each value in a
slab is viewed. Similarly, another group of Arab countries (Division 2) are introduced in order to enlarge the sample of study while the actual monthly tariffs for them are presented in the same manner of segmentation for
the considered steps and their values are drawn in a chart as shown in Figure 2.
Now, a new system for these values will be chosen because the variation between them should be referred to a single value. The base value (the smallest value in all tariffs) is taken as the unity where the Syrian tariff appears
to be the smallest within the selected sample of listed countries in Table 1. So, the initial data can be converted
[image:3.595.90.539.215.725.2]into the per unit system as listed in Table 2.
Table 1. Electric energy slab tariffs (monthly) for Arab countries (Division 1) [9].
kWh Egypt Morocco Yemen Jordon UAE Tunis Syria Bahrain
0 - 20 0.94 12.33 2.01 4.51 5.44 6.34 0.54 0.8
21 - 30 0.94 12.33 2.01 4.51 5.44 6.34 0.54 0.8
31 - 50 0.94 12.33 2.01 4.51 5.44 11.23 0.54 0.8
51 - 60 2 12.33 2.01 4.51 5.44 11.23 0.54 0.8
61 - 90 2 12.33 2.01 4.51 5.44 11.23 0.54 0.8
91 - 100 2 12.33 2.01 4.51 5.44 11.23 0.54 0.8
101 - 120 2 13.25 2.01 4.51 5.44 11.23 0.76 0.8
121 - 160 2 13.25 2.01 4.51 5.44 11.23 0.76 0.8
161 - 180 2 13.25 2.01 10.01 5.44 11.23 0.76 0.8
181 - 200 2 13.25 2.01 10.01 5.44 11.23 0.76 0.8
201 - 250 2.79 14.42 3.52 10.01 5.44 11.23 1.09 0.8
251 - 300 2.79 14.42 3.52 10.01 5.44 11.23 1.09 0.8
301 - 350 2.79 14.42 3.52 11.99 5.44 11.23 1.09 0.8
351 - 400 4.04 14.42 5.03 11.99 5.44 11.23 1.09 0.8
401 - 500 4.04 14.42 5.03 11.99 5.44 11.23 1.63 0.8
501 - 600 4.04 19.71 5.03 15.93 5.44 11.23 1.63 0.8
601 - 650 4.04 19.71 5.03 15.93 5.44 11.23 4.35 0.8
651 - 700 5.82 19.71 5.03 15.93 5.44 11.23 4.35 0.8
701 - 800 5.82 19.71 8.55 15.93 5.44 11.23 4.35 0.8
801 - 900 5.82 19.71 8.55 15.93 5.44 11.23 6.52 0.8
901 - 1000 5.82 19.71 8.55 15.93 5.44 11.23 6.52 0.8
1001 - 1400 7.11 19.71 8.55 15.93 5.44 11.23 7.61 0.8
1401 - 2000 7.11 19.71 8.55 15.93 5.44 11.23 7.61 0.8
2001 - 3000 7.11 19.71 8.55 15.93 6.53 11.23 8.69 0.8
3001 - 4000 7.11 19.71 8.55 15.93 6.53 11.23 8.69 2.39
4001 - 5000 7.11 19.71 8.55 15.93 7.62 11.23 8.69 2.39
5001 - 6000 7.11 19.71 8.55 15.93 7.62 11.23 8.69 4.24
6001 - 7000 7.11 19.71 8.55 15.93 8.98 11.23 8.69 4.24
7001 - 8000 7.11 19.71 8.55 15.93 8.98 11.23 8.69 4.24
8001 - 9000 7.11 19.71 8.55 15.93 8.98 11.23 8.69 4.24
9001 - 10,000 7.11 19.71 8.55 15.93 8.98 11.23 8.69 4.24
10,000 - 15,000 7.11 19.71 8.55 15.93 8.98 11.23 8.69 4.24
OALibJ | DOI:10.4236/oalib.1100869 4 September 2014 | Volume 1 | e869
Table 2. The calculated P. U. tariffs for Division 1 of Arab countries.
kWh Egypt Morocco Yemen Jordon UAE Tunis Syria Bahrain
0 - 20 1.74 22.83 3.72 8.35 10.07 11.74 1 1.48
21 - 30 1.74 22.83 3.72 8.35 10.07 11.74 1 1.48
31 - 50 1.74 22.83 3.72 8.35 10.07 20.80 1 1.48
51 - 60 3.70 22.83 3.72 8.35 10.07 20.80 1 1.48
61 - 90 3.70 22.83 3.72 8.35 10.07 20.80 1 1.48
91 - 100 3.70 22.83 3.72 8.35 10.07 20.80 1 1.48
101 - 120 3.70 24.54 3.72 8.35 10.07 20.80 1.41 1.48
121 - 160 3.70 24.54 3.72 8.35 10.07 20.80 1.41 1.48
161 - 180 3.70 24.54 3.72 18.54 10.07 20.80 1.41 1.48
181 - 200 3.70 24.54 3.72 18.54 10.07 20.80 1.41 1.48
201 - 250 5.17 26.70 6.52 18.54 10.07 20.80 2.02 1.48
251 - 300 5.17 26.70 6.52 18.54 10.07 20.80 2.02 1.48
301 - 350 5.17 26.70 6.52 22.20 10.07 20.80 2.02 1.48
351 - 400 7.48 26.70 9.31 22.20 10.07 20.80 2.02 1.48
401 - 500 7.48 26.70 9.31 22.20 10.07 20.80 3.02 1.48
501 - 600 7.48 36.5 9.31 29.5 10.07 20.80 3.02 1.48
601 - 650 7.48 36.5 9.31 29.5 10.07 20.80 8.06 1.48
651 - 700 10.78 36.5 9.31 29.5 10.07 20.80 8.06 1.48
701 - 800 10.78 36.5 15.83 29.5 10.07 20.80 8.06 1.48
801 - 900 10.78 36.5 15.83 29.5 10.07 20.80 12.07 1.48
901 - 1000 10.78 36.5 15.83 29.5 10.07 20.80 12.07 1.48
1001 - 1400 13.17 36.5 15.83 29.5 10.07 20.80 14.09 1.48
1401 - 2000 13.17 36.5 15.83 29.5 10.07 20.80 14.09 1.48
2001 - 3000 13.17 36.5 15.83 29.5 12.09 20.80 16.09 1.48
3001 - 4000 13.17 36.5 15.83 29.5 12.09 20.80 16.09 4.43
4001 - 5000 13.17 36.5 15.83 29.5 14.11 20.80 16.09 4.43
5001 - 6000 13.17 36.5 15.83 29.5 14.11 20.80 16.09 7.85
6001 - 7000 13.17 36.5 15.83 29.5 16.63 20.80 16.09 7.85
7001 - 8000 13.17 36.5 15.83 29.5 16.63 20.80 16.09 7.85
8001 - 9000 13.17 36.5 15.83 29.5 16.63 20.80 16.09 7.85
9001 - 10,000 13.17 36.5 15.83 29.5 16.63 20.80 16.09 7.85
10,000 - 15,000 13.17 36.5 15.83 29.5 16.63 20.80 16.09 7.85
>15,000 13.17 36.5 15.83 29.5 16.63 20.80 16.09 7.85
Similarly, the calculated per unit values of tariffs for Division 1 of Arab countries are drawn in Figure 2
where the results are synonym for the above one of Figure 1. It must be noted that, the tariff of Syria is repeated
in both cases above because it represents the reference characteristic for per unit system implemented in the re-search. This long characteristic is given in spite of the initial value of 0.54 Cents for the first (smallest) tariff is only the base for the considered per unit system of computations. Consequentially, the tariff for the rest of Arab
countries as a second division is illustrated in Figure 3.
The tariff in per unit system for Division 2 of Arab nations is computed and the results are directly drawn in Figure 4.
OALibJ | DOI:10.4236/oalib.1100869 5 September 2014 | Volume 1 | e869
[image:5.595.141.495.86.650.2]Figure 1. Tariffs for Division 1 of Arab countries [9].
Figure 2. Tariffs for Division 2 of Arab countries [9].
Figure 3. The calculated P. U. tariffs for Division 1 of Arab countries.
The initial data of Asian countries [9] [11], sampled in this paper, converted into the proposed per unit system
and the results of evaluations can be seen directly in Figure 5. Firstly, we see that, all of these countries have the
same style and strategy for the tariff because their behavior is the same. Curves are similar in the first part to that of Arab countries but in the last part they are opposite. In Arab countries characteristics [9] [10], the step up is
0 5 10 15 20 25 0-20 21 -3 0 31 -5 0 51 -6 0 61 -9 0 91 -1 00 10 1-12 0 12 1-16 0 16 1-18 0 18 1-20 0 20 1-25 0 25 1-30 0 30 1-35 0 35 1-40 0 40 1-50 0 50 1-60 0 60 1-65 0 65 1-70 0 70 1-80 0 80 1-90 0 90 1-10 00 10 01 -1 40 0 14 01 -2 00 0 20 01 -3 00 0 30 01 -4 00 0 40 01 -5 00 0 50 01 -6 00 0 60 01 -7 00 0 70 01 -8 00 0 80 01 -9 00 0 90 01 -1 00 00 10 00 0-15 00 0 >1 50 00 pr ic e i n Ce nt s
kWH / Month
[image:5.595.133.495.440.651.2]OALibJ | DOI:10.4236/oalib.1100869 6 September 2014 | Volume 1 | e869
[image:6.595.138.488.294.538.2]Figure 4. The calculated P. U. tariffs for Division 2 of Arab countries.
Figure 5. Tariffs for Asian countries [10].
always for increasing in general even at the big energy consumptions but contrary for Asian countries we see. In these last countries, we have a step down characteristics in the last part of the curves in spite of the difference in the value between each other.
4. Domestic Tariff Map
Since a comparison between tariffs could be reachable, for suitability of presentation a symbol system would be
considered. Then, interesting countries in the present investigation are listed again in Table 3 in order to draw
the map proposed later. It should be mentioned that, the symbols are not standard but their choice depends on the smallest number of digits. This direction is taken to introduce a large number of countries inside the sug-gested map.
The above sample data for tariff around the world leads us to think more about the philosophy of tariff rising (when and why) while a new imaging should be useful. The proposed tariff map in this research leads to
show-ing all tariffs in a sshow-ingle image although some of them may be tabulated as given in Table 4. So, the tariff
dis-placement between different included countries would be appeared but it indicates only about the position of the
0 5 10 15 20 25 30 0-20 21 -3 0 31 -5 0 51 -6 0 61 -9 0 91 -1 00 10 1-12 0 12 1-16 0 16 1-18 0 18 1-20 0 20 1-25 0 25 1-30 0 30 1-35 0 35 1-40 0 40 1-50 0 50 1-60 0 60 1-65 0 65 1-70 0 70 1-80 0 80 1-90 0 90 1-10 00 10 01 -1 40 0 14 01 -2 00 0 20 01 -3 00 0 30 01 -4 00 0 40 01 -5 00 0 50 01 -6 00 0 60 01 -7 00 0 70 01 -8 00 0 80 01 -9 00 0 90 01 -1 00 00 10 00 0-15 00 0 >1 50 00 KSA Syria Sudan Iraq Libya Lebanon Qatar Oman 0 20 40 60 80 100 120 140 160
OALibJ | DOI:10.4236/oalib.1100869 7 September 2014 | Volume 1 | e869
tariff relative to others within a specified slab. Thus, the remakes should be indicated for each slab as indicated
in each row in Table 4.
Table 3. The symbols of some countries (used in the research).
Country Syria Pakistan KSA Bahrain Qatar Libya Sudan
Symbol S P K Bh Q Ly Su
Country Nepal Sri Lanka India Lebanon Oman Tunis Egypt
Symbol N Sr I L O T E
Country Iraq Bangladesh Jordon Morocco UAE Yemen
[image:7.595.91.538.203.723.2]Symbol Ir B J M U Y
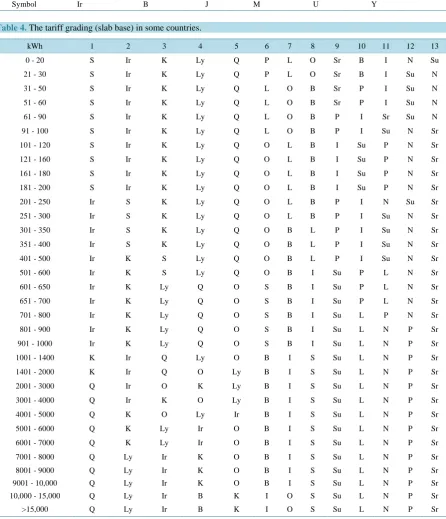
Table 4. The tariff grading (slab base) in some countries.
kWh 1 2 3 4 5 6 7 8 9 10 11 12 13
0 - 20 S Ir K Ly Q P L O Sr B I N Su
21 - 30 S Ir K Ly Q P L O Sr B I Su N
31 - 50 S Ir K Ly Q L O B Sr P I Su N
51 - 60 S Ir K Ly Q L O B Sr P I Su N
61 - 90 S Ir K Ly Q L O B P I Sr Su N
91 - 100 S Ir K Ly Q L O B P I Su N Sr
101 - 120 S Ir K Ly Q O L B I Su P N Sr
121 - 160 S Ir K Ly Q O L B I Su P N Sr
161 - 180 S Ir K Ly Q O L B I Su P N Sr
181 - 200 S Ir K Ly Q O L B I Su P N Sr
201 - 250 Ir S K Ly Q O L B P I N Su Sr
251 - 300 Ir S K Ly Q O L B P I Su N Sr
301 - 350 Ir S K Ly Q O B L P I Su N Sr
351 - 400 Ir S K Ly Q O B L P I Su N Sr
401 - 500 Ir K S Ly Q O B L P I Su N Sr
501 - 600 Ir K S Ly Q O B I Su P L N Sr
601 - 650 Ir K Ly Q O S B I Su P L N Sr
651 - 700 Ir K Ly Q O S B I Su P L N Sr
701 - 800 Ir K Ly Q O S B I Su L P N Sr
801 - 900 Ir K Ly Q O S B I Su L N P Sr
901 - 1000 Ir K Ly Q O S B I Su L N P Sr
1001 - 1400 K Ir Q Ly O B I S Su L N P Sr
1401 - 2000 K Ir Q O Ly B I S Su L N P Sr
2001 - 3000 Q Ir O K Ly B I S Su L N P Sr
3001 - 4000 Q Ir K O Ly B I S Su L N P Sr
4001 - 5000 Q K O Ly Ir B I S Su L N P Sr
5001 - 6000 Q K Ly Ir O B I S Su L N P Sr
6001 - 7000 Q K Ly Ir O B I S Su L N P Sr
7001 - 8000 Q Ly Ir K O B I S Su L N P Sr
8001 - 9000 Q Ly Ir K O B I S Su L N P Sr
9001 - 10,000 Q Ly Ir K O B I S Su L N P Sr
10,000 - 15,000 Q Ly Ir B K I O S Su L N P Sr
OALibJ | DOI:10.4236/oalib.1100869 8 September 2014 | Volume 1 | e869
Generally, these 13 countries represent a small sample within the total number of countries on the universe where more detailed shape must be handled. If a large scale comparison is required, a new style of thinking
should be achieved. Thus, a new large scale can be accounted through the proposed tariff map as shown in
Fig-ure 6 where this number can be enlarged according to the size you have. Otherwise, this style of indication may be prepared to be suitable on the actual maps later although it is here has a simple shape with a concentration on the dynamic variation (traveling) of tariff for a country relative to all others on the same sheet (map). The map indicates the economic situation of each country relative to others where a tariff goes back with the slab in-creasing such as Syria begins at level 1 and ends at level 10 approximately. Otherwise, some countries go for-ward such as Tunis (begins at 20 and ends at 14) Sudan begins at 19 and ends at 13. This leads to the view of economic situation of both and others because the support of small consumers may help in GDP growth.
5. The Fluctuation Factor
A Per Unit fluctuation factor (FF)P.U. is suggested in order to read the actual support for the poverty class
be-cause this factor expresses the difference between tariff for approximately non user of electric energy and those with heavy power consumption in the domain of domestic loads. On the other side, this factor is highly related
to the political policy of a country (Table 5) in spite of its technology character. The political profile in the tariff
can be deduced from the proposed above “tariff map” as well as this fluctuation factor (FF)P.U. says a lot about
the dynamic change on the map.
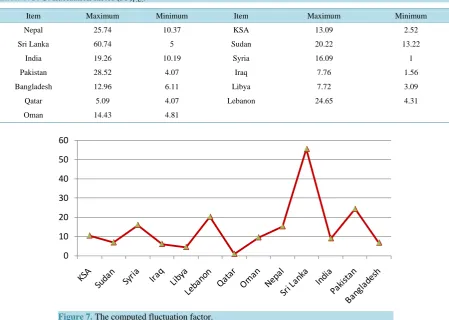
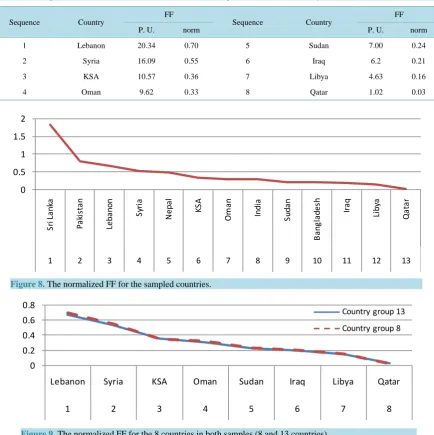
This view is implemented to the sample of countries under study and the initial primary data have been listed in Table 5 while the absolute factor of fluctuation (FF)P.U. is estimated accordingly and the results are presented in Figure 7. From this figure it is seen that, the highest value of fluctuation factor belongs to Sri Lanka.
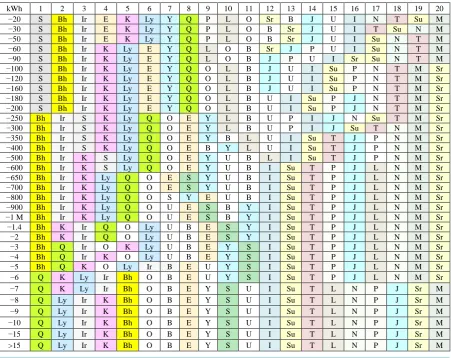
[image:8.595.88.540.352.710.2]kWh 1 2 3 4 5 6 7 8 9 10 11 12 13 14 15 16 17 18 19 20 −20 S Bh Ir E K Ly Y Q P L O Sr B J U I N T Su M −30 S Bh Ir E K Ly Y Q P L O B Sr J U I T Su N M −50 S Bh Ir E K Ly Y Q P L O B Sr J U I Su N T M −60 S Bh Ir K Ly E Y Q L O B Sr J P U I Su N T M −90 S Bh Ir K Ly E Y Q L O B J P U I Sr Su N T M −100 S Bh Ir K Ly E Y Q O L B J U I Su P N T M Sr −120 S Bh Ir K Ly E Y Q O L B J U I Su P N T M Sr −160 S Bh Ir K Ly E Y Q O L B J U I Su P N T M Sr −180 S Bh Ir K Ly E Y Q O L B U I Su P J N T M Sr −200 S Bh Ir K Ly E Y Q O L B U I Su P J N T M Sr −250 Bh Ir S K Ly Q O E Y L B U P I J N Su T M Sr −300 Bh Ir S K Ly Q O E Y L B U P I J Su T N M Sr −350 Bh Ir S K Ly Q O E Y B L U I Su T J P N M Sr −400 Bh Ir S K Ly Q O E B Y L U I Su T J P N M Sr −500 Bh Ir K S Ly Q O E Y U B L I Su T J P N M Sr −600 Bh Ir K S Ly Q O E Y U B I Su T P J L N M Sr −650 Bh Ir K Ly Q O E S Y U B I Su T P J L N M Sr −700 Bh Ir K Ly Q O E S Y U B I Su T P J L N M Sr −800 Bh Ir K Ly Q O S Y E U B I Su T P J L N M Sr −900 Bh Ir K Ly Q O U E S B Y I Su T P J L N M Sr −1 M Bh Ir K Ly Q O U E S B Y I Su T P J L N M Sr −1.4 Bh K Ir Q O Ly U B E S Y I Su T P J L N M Sr −2 Bh K Ir Q O Ly U B E S Y I Su T P J L N M Sr −3 Bh Q Ir O K Ly U B E Y S I Su T P J L N M Sr −4 Bh Q Ir K O Ly U B E Y S I Su T P J L N M Sr −5 Bh Q K O Ly Ir B E U Y S I Su T P J L N M Sr −6 Q K Ly Ir Bh O B E U Y S I Su T P J L N M Sr −7 Q K Ly Ir Bh O B E Y S U I Su T L N P J Sr M −8 Q Ly Ir K Bh O B E Y S U I Su T L N P J Sr M −9 Q Ly Ir K Bh O B E Y S U I Su T L N P J Sr M −10 Q Ly Ir K Bh O B E Y S U I Su T L N P J Sr M −15 Q Ly Ir K Bh O B E Y S U I Su T L N P J Sr M >15 Q Ly Ir K Bh O B E Y S U I Su T L N P J Sr M
OALibJ | DOI:10.4236/oalib.1100869 9 September 2014 | Volume 1 | e869
Table 5. P. U. fluctuation factor (FF)P.U..
Item Maximum Minimum Item Maximum Minimum
Nepal 25.74 10.37 KSA 13.09 2.52
Sri Lanka 60.74 5 Sudan 20.22 13.22
India 19.26 10.19 Syria 16.09 1
Pakistan 28.52 4.07 Iraq 7.76 1.56
Bangladesh 12.96 6.11 Libya 7.72 3.09
Qatar 5.09 4.07 Lebanon 24.65 4.31
Oman 14.43 4.81
Figure 7.The computed fluctuation factor.
Since a common per unit system is applied for all countries inside the sample, the comparison can be easy
evaluated according to the deduced values. Also, Figure 7 shows the estimated per unit fluctuation factors for
different countries and appearing the highest value well. These results express a real situation for the actual tariff pricing in the studied countries.
If we rearrange this proposed factor for these countries we can get the results given in Table 6 where the
se-quence order has been indicated in Table 6.
From Table 6 the high difference means that, a good graded slab system is achieved where this style helps the
poverty class and depends on the income value received from the high economic class. This is remarked for Sri Lanka and Pakistan. Contrary, the minimum fluctuation factor appears at Libya and Qatar while the small value of fluctuation means a cheap tariff or the sociality characteristics for the society structure. This is a view; as an indicator reflecting the energy dependency with the economic base for a country; although there are many other factors may determine the actual view better than the proposed factor. It should be said that, both proposed fac-tors (tariff map and the fluctuation factor) represent the actual positioning for the country policy towards the energy support while the free price for energy may be necessary sometimes to cover indirectly the macroeco-nomic of a country.
Since the normalization of the P. U. values should give more realistic condition, a new estimation for the P. U. values would be applied through a normalized reference value. This reference must consider the number of
countries (n) in the sample as well as all initial values of tariffs of these countries, and so the new reference is
evaluated (Rn) according to the formula
(
)
n = ∑ initial n2
New reference R tariff (1) This means as:
(
) (
)
(
)
= ∑ 2+ 2+ + 2
n initial 1 initial 2 initial n
R tariff tariff tariff (2)
OALibJ | DOI:10.4236/oalib.1100869 10 September 2014 | Volume 1 | e869
Table 6. The sequential order of ((FF)P.U. and (FF)norm) for the sample investigated.
Sequence Country FF Sequence Country FF
P. U. norm P. U. norm
1 Sri Lanka 55.74 1.82 8 India 9.13 0.30
2 Pakistan 24.45 0.80 9 Sudan 7.00 0.23
3 Lebanon 20.34 0.67 10 Bangladesh 6.85 0.22
4 Syria 16.09 0.53 11 Iraq 6.2 0.20
5 Nepal 15.37 0.50 12 Libya 4.63 0.15
6 KSA 10.57 0.35 13 Qatar 1.02 0.033
7 Oman 9.62 0.31
So, we get this reference R8 for the first 8 Arab countries of Table 2 as
(
.) (
.) (
.) (
.) (
.) (
.) ( ) (
.)
= 2+ 2+ 2+ 2+ 2+ 2+ 2+ 2
8
R 1 74 22 83 3 72 8 35 10 07 11 74 1 1 48 (3)
Then,
[
.]
.= =
8
R 850 2203 29 16 (4)
This reference R13for the 13 countries of Table 4 equal to
.
= 13
R 30 58 (5)
Thus, we reached to the given sample of P. U. fluctuation factors calculated in Table 5 and their sequence in
Table 6 however, the normalized fluctuation factors (FF)norm would be estimated accordingly for each. The
re-sults are tabulated in Table 7 compared to the corresponding P. U. values (absolute). Therefore, the normalized
fluctuation factor (FF)norm is expressed mathematically by
( )
[
]
nnorm
Maximum−Minimum
=
13 FF
R (6)
The deduced normalized factors have been listed in Table 6 where the high difference in some values has
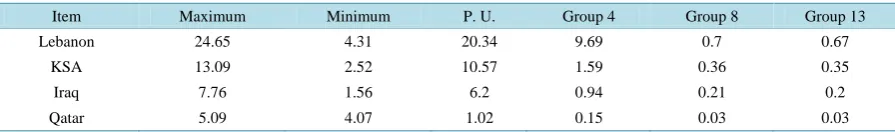
been disappeared totally. This leads to the importance of the normalization process for the consideration of such fluctuation factor although the per unit factors represent an image for the data entry. Referring to both curves of Figure 7 and Figure 8, we find that the scale of fluctuation factor in P. U. is a wide one (0 - 60) relative to the normalized fluctuation factor (0 - 2) for the same sample and same condition.
The sequential graph for the normalized fluctuation factor has been drawn in Figure 8 where the descending
style is recognized starting at Sri Lanka and ending at Qatar. This type of evaluation is more suitable and is recommended to be utilized in study and analysis of the energy costing or pricing. Similarly for the sample of 8
readings, we have the sequential curve as shown in Table 7 where the same sequential is repeated as in the
group of 13 countries (Figure 8).
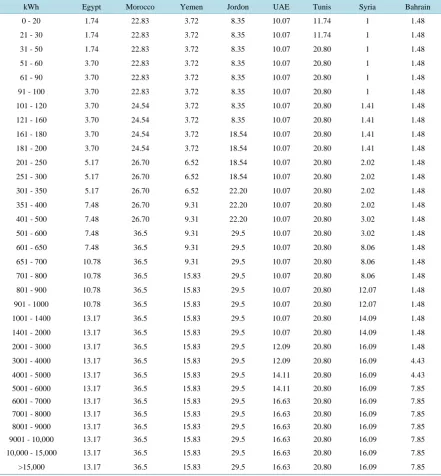
The summation of both results of the normalized fluctuation factor for the 8 countries in the samples of 8
countries and 13 countries is accounted and the results of all samples are shown in Figure 9. It is well seen that,
the normalized FF is mostly close to each other of the same country where the variation is small and can
practi-cally be neglected.
Also, this graph tells us that, Qatar has a strong stable domestic tariff while Lebanon reach the top within the sampled studied. However, the check for the validity of the normalized fluctuation factor for the determination the place of standing for a country within the others in a specified group, more theoretical calculations could proof. So, we choose 4 countries from the 8 group as the limit countries would be taken besides any other two. Then, the chosen countries are Lebanon and Qatar (the limits) and selected two as KSA and Iraq where the
re-sults are compared with the P. U. factor and that for 8 and 13 groups above. Firstly, the value of the reference R4
for group of 4 countries can be determined according to the above equation as
.
= 4
OALibJ | DOI:10.4236/oalib.1100869 11 September 2014 | Volume 1 | e869
Table 7. The sequential order of (FF)P.U. and (FF)norm for the sample of 8 countries investigated.
Sequence Country
FF
Sequence Country
FF
P. U. norm P. U. norm
1 Lebanon 20.34 0.70 5 Sudan 7.00 0.24
2 Syria 16.09 0.55 6 Iraq 6.2 0.21
3 KSA 10.57 0.36 7 Libya 4.63 0.16
4 Oman 9.62 0.33 8 Qatar 1.02 0.03
Figure 8. The normalized FF for the sampled countries.
Figure 9. The normalized FF for the 8 countries in both samples (8 and 13 countries).
Then, the calculated values are shown in Table 8 where results proof that for a lot of countries the normalized
fluctuation factors becomes stable and the results becomes approximately the same. This is proofed from Table
8 and also Table 7 because the absolute P. U. fluctuation factor is tending to a constant value with the increase
of the countries in the group. The acceptance of validity of the normalized fluctuation factor for indication with a large group of countries is clear and real.
6. Energy Price
The tariff as investigated above is a good face for the country direction towards the energy consumption al-though most results reflect the self policy as explained. Now, we are going to evaluate the energy price charac-teristics directly without the per unit system since we have a single financial unit (USA Cent). So, the published values for a specified value of energy consumption for some Arab countries are considered for the analysis as a sample. The study may take three branches of energy such as domestic loads, commercial loads and the indus-trial loads where the initial data have been published before. We will take the priority to investigate the meaning of their pricing within the comparison with other countries [13]-[15].
0 0.5 1 1.5 2
Sr
i L
an
ka
Pak
is
tan
Le
ba
no
n
Syr
ia
Ne
pal KSA
Om
an
Indi
a
Suda
n
Ban
glad
es
h
Ira
q
Li
bya
Q
at
ar
1 2 3 4 5 6 7 8 9 10 11 12 13
0 0.2 0.4 0.6 0.8
Lebanon Syria KSA Oman Sudan Iraq Libya Qatar
1 2 3 4 5 6 7 8
OALibJ | DOI:10.4236/oalib.1100869 12 September 2014 | Volume 1 | e869
Table 8. Results of the calculated normalized FF for different groups of countries.
Item Maximum Minimum P. U. Group 4 Group 8 Group 13
Lebanon 24.65 4.31 20.34 9.69 0.7 0.67
KSA 13.09 2.52 10.57 1.59 0.36 0.35
Iraq 7.76 1.56 6.2 0.94 0.21 0.2
Qatar 5.09 4.07 1.02 0.15 0.03 0.03
6.1. Domestic Energy
The most important type of loads relative to the population appears to be the domestic loads because nowadays all people are using all devices and tools and all life services within the electric power utility. So, the domestic energy is always floating on the surface although the industrial loads are heavy and applied as a bulk [16]. Whatever, the electricity average monthly tariff (domestic) for some Arab countries based on slab system (in USA Cents) as explained above could be analyzed. Initially, the price data for the specified energy consumption in these selected countries; specified for values of 250, 500, 750, and 1000 kWh of energy; are accounted in the study as a sample of Arab countries.
The data have been plotted in Figure 10 where both Morocco and Palestine prices represent the maximum
value for all four specified energy consumptions. Palestine is the highest price for small energies but Morocco goes to head for the large energy, where they intersect at about the energy of 750 kWh. The double or even triple intersection in the prices is a common performance for this sample. It should be mentioned that, a fixed
domes-tic tariff in the range of 1000 kWh is appeared in some countries as tabulated in Table 9 [9].
A second sample for African countries has been selected and the analysis may be taken in three steps: the first
for the poverty class specified monthly consumption of 100 kWh and the results are given in Figure 11. The
demand power is taken as 1 kW. Also, the fixed domestic tariffs for some African countries are added to Table
9.
These are individual values without any variations but the monthly price changes from about 20.1 for Burkina Faso to a minimum price of 1.05 for Nigeria.
The second category is chosen for the single phase consumers at two levels of demand power as 2 and 3 kW
where the results of monthly price for the same above countries are driven directly in Figure 12.
In the same manner the third type is taken for 3 phase systems and the results are given in Figure 13.
6.2. Commercial Energy
The commercial energy represents a large part of the country energy consumption, especially in the developing countries because they have normally the utilization economic base. This means that the industrial part is usually less than the commercial. Therefore, the study of this sector of loads may be needed in order to cover the wide branch of study. This is important since the tariff of domestic load is usually differs from that for the commer-cial sector.
Otherwise, the energy support could be useful for some countries although it may hurt others, who are trying to build a strong infrastructure. This is a far subject but it helps sometimes. So, the commercial data must be ac-counted as done above for the domestic sector and so, the same sequence would be implemented. Thus, the group of Arab countries may be sampled for the commercial tariff and the results of tariffs are directly drawn in Figure 14. The P. U. system of tariff here may be not necessary because a simple comparison will be the target. However, a constant price is seen for both Qatar and Algeria while it is approximately fixed (small variation) for both Tunis and Morocco.
The data of Arab countries are accounted for three values of energy consumption where these values are 0.5,
1, and 5 MWh as shown in Figure 14. The second sample for the commercial sector would be introduced
through the African countries but the monthly energy consumption has been taken for a tariff of 100 kWh. On the other level, a second value of consumption has been estimated for the 1800 kWh/month at different values of
demand such as 12 kW and 15 kW (demand power) and consequentially, the results are shown in Figure 15
[10].
It should be noted that, a commercial actual fixed tariff (1800 kWh monthly) is appeared for some countries
as tabulated in Table 10. Also, some countries have a small variation in the tariff as shown in results of Table
OALibJ | DOI:10.4236/oalib.1100869 13 September 2014 | Volume 1 | e869
Table 9. Countries with actual fixed domestic tariff in the range of 1000 kWh.
Countries UAE KSA Iraq Oman Qatar Bahrain
Value 5.44 1.36 0.84 2.59 2.2 0.8
Countries Guinea Liberia Libya Niger Congo Libya
[image:13.595.130.507.231.555.2]Value 8.7 34 1.52 11.23 6.72 1.63
Figure 10. The initial monthly prices for domestic energy in some Arab countries.
Figure 11. The social consumption 100 kWh.
6.3. Industrial Power
The industrial sector in the field of energy consumption may be the biggest consumer because it utilizes bulk energy directly although their numbers as consumers is little. So, the study a sample for this sector could tell a lot about the electric energy consumption within. Contrary, the domestic branch has a lot of consumers but with small energy consumption. This leads to the view required to be appointed in this situation since the total energy consumption of domestic loads can’t reach that for the industrial sector [12].
A sample of industrial consumption is accounted for the users on the medium voltage level at two levels of demand power. These demands are 20 kW and 25 kW since the consumers here are not the biggest. The initial
data are tabulated in Table 12 for some countries according to the sample given. These values are very close as
shown in Figure 16 where the overlapping for both curves is the general face of the figure. The presented data
are appeared for both values of demand as a single value per each for all countries of the sample.
0 2 4 6 8 10 12 14 16
250 kWh 500 kWh 750 kWh 1000 kWh
Egypt
Jordon
Tunis
Algeria
Sudan
Syria
Palestine
Lebanon
Morocco
Yemen
0 5 10 15 20 25
Eg
yp
t
M
or
oc
co
Alg
er
ia
Tu
ni
s
Dr
C
on
go
Ga
bo
n
Ch
ad
Ce
nt
ra
l A
fr
ica
n
Re
p
Ca
m
er
on
An
go
la
Zam
bi
a
RS
A
M
al
aw
i
M
oz
am
bi
qu
e
Tan
zan
ia
M
ad
ag
as
ca
r
Zi
m
ba
bw
e
N
am
ib
ia
Co
te
D’
Iv
oir
e
To
go
Bu
rk
in
a F
as
o
M
al
i
Sen
eg
al
N
ig
er
ia
Be
ni
n
Gh
an
a (
VR
G)
Ga
m
bi
a
Gh
an
a (
EC
[image:13.595.136.495.386.555.2]OALibJ | DOI:10.4236/oalib.1100869 14 September 2014 | Volume 1 | e869
[image:14.595.139.489.96.655.2]Figure 12. Single phase energy pricing for 2 and 3 kW demand.
Figure 13. 3 phase energy pricing for 6 and 10 kW demand.
Figure 14.Electricity average monthly commercial tariff for some Arab countries (Cents).
It is well seen from Figure 16 that, the energy price in African countries differs widely between the countries
of the studied sample beginning from the minimum tariff of Zimbabwe (1.04) till the maximum of 34 corres-ponding to Liberia. This means that, each country in the sample is still trying to get the best way for excellent tariff since the self electric energy may be not enough. The difference between the two conditions of demand power can be neglected because the two demand values are approximately close.
0 5 10 15 20 25 30 Eg yp t M or oc co Alg er ia Tu ni s Dr C on go Ga bo n Ch ad Ce nt ra l A fr ica n Re p Ca m er on An go la Zam bi a RS A M al aw i M oz am bi qu e Tan zan ia M ad ag as ca r Zi m ba bw e N am ib ia Co te D’ Iv oir e To go Bu rk in a F as o M al i Sen eg al N ig er ia Be ni n Gh an a ( VR G) Ga m bi a Gh an a ( EC G) 2 kW demand 3 kW demand 0 5 10 15 20 25 30 35 Eg yp t M or oc co Al ge ria Tuni s Dr C on go Ga bo n Ch ad Ce nt ra l A fr ic an R ep Ca me ro n An go la Za mb ia RS A M al aw i M oz am bi que Tan zan ia M ad ag as ca r Zi m ba bw e Na mi bi a Cot e D ’Iv oi re To go Bu rk in a F as o M al i Se ne ga l Ni ge ria Be ni n Gh an a ( VR G) Ga mb ia Gh an a ( EC G) 6 kW 10 kW 0 2 4 6 8 10 12 14 16 18 20
0.5 MWh 1MWh 5 MWh
[image:14.595.137.490.434.641.2]OALibJ | DOI:10.4236/oalib.1100869 15 September 2014 | Volume 1 | e869
Figure 15. Commercial energy pricing for 12 and 15 kW demand.
Figure 16.A sample for the energy pricing at 20 and 25 kW demand.
Table 10. Countries with actual fixed commercial tariff.
Countries Guinea Liberia Libya Niger Ghana (ECG) & (VRG) Gambia
Value 12.4 34 3.64 ≈13.5 14.61 24.17
Countries Benin Nigeria Mali RSA Mozambique Malawi
Value 16 6.45 30.57 3.64 14.75 6.57
Countries Zambia Angola Congo Dr Congo Zimbabwe Egypt
Value 4.13 5.88 6.4 11 1.11 8.02
Table 11. Countries with approximately fixed commercial tariff.
Country Madagascar Central African Rep Gabon Tunis Algeria
Value 23.12/23.34 16.8/16.66 17.23/17.58 12.44/12.48 6.66/6.7 0 20 40 60 80 100 120 140 160 180
12 kW 15 kW
Senegal Burkina Faso Togo Cote D’Ivoire Namibia Tanzania Cameron Chad Morocco 0 5 10 15 20 25 30 35 40 Eg yp t M or oc co Li by a Al ge ria Tuni s Dr C on go Ga bo n Co ng o Ch ad Ce nt ra l A fr ic an R ep Ca me ro n An go la Za mb ia RS A M al aw i M oz am bi que Tan zan ia M ad ag as ca r Zi m ba bw e Na mi bi a Cot e D ’Iv oi re To go Bu rk in a F as o M al i Ni ge r Se ne ga l Ni ge ria Be ni n Gh an a ( VR G) Ga mb ia Li be ria Gh an a ( EC G) Gui ne a
20 kW demand
[image:15.595.119.510.87.309.2]OALibJ | DOI:10.4236/oalib.1100869 16 September 2014 | Volume 1 | e869
Table 12. The monthly tariff for semi-industrial and motive power electricity in different African countries (in USA Cents).
Demand kW 20 kW 25 kW Demand kW 20 kW 25 kW
Egypt 8.33 8.33 Central African Rep 14.27 14.13
Togo 18.4 18.95 Mozambique 9.28 10.13
Libya 3.18 3.18 Madagascar 22.2 22.5
Algeria 6.68 6.72 Zimbabwe 1.04 1.04
Tunis 12.53 12.58 Cote D’Ivoire 18.89 19.33
Mali 23.19 23.19 Burkina Faso 24.95 24.95
Gabon 14.76 15.8 Ghana (VRG) 13.22 13.22
Congo 5.64 5.64 Ghana (ECG) 13.22 13.22
Chad 23.26 23.26 Dr Congo 15 15
Benin 16 16 Tanzania 10 11.48
Angola 5.5 5.5 Namibia 10.13 12.15
Zambia 4.52 4.92 Morocco 12.62 13.44
RSA 3.38 3.55 Cameron 14.09 15
Malawi 12.44 14.53 Gambia 24.17 24.17
Niger 13.52 13.68 Liberia 34 34
Senegal 24.63 25.31 Guinea 12.4 12.4
Nigeria 6.44 6.44
This view for the small industrial customers is clarified through the national tariff of each country although there is other segments inside the industrial sector could be inserted. So, one middle type of industrial would be indicated in order to reach the philosophy of tariff system around. Thus, a sample for the tariff of energy con-sumption at medium voltage for 35 MWh monthly is included and the relative comparison between the countries
of the sample is shown in Figure 17.
It is seen from this figure that similarly, the remarks of the previous small industrial consumption are repeated in the same manner so that the profile of the industrial sector is still constant for energy consumptions at all sizes. It is important to mention that, the present work is directed to find out the relationship between the electric ta-riffs of different countries in the world where the paper takes the effort to determine the interference between pricing the electric tariff in the developing countries for all scales. It should be mentioned that, the investigation contains different classes of loads besides various types of power systems and finally all possible types of loads such as domestic, commercial and industrial energy consumptions.
Thus, it is seen that the tariff in all countries are considering the slab base for all studied fields either for do-mestic or commercial or even for industrial one. It is varied in a wide range for the investigated developing countries while some of them have a high consumption at the medium voltage of 35 kV. The new texture map for the motion of economy is provided to be the most effective of the given research. Also, the personal con-sumption is high in Arab countries relative to the Asian although the economy state is better in Asian countries. The oscillation in the pricing value is determined through the proposed fluctuation factor and then it is consi-dered as a normalized fluctuation factor as a modification. It is a mirror for the pricing process in a country.
7. Conclusions
From the results of the above analysis it can be concluded that:
OALibJ | DOI:10.4236/oalib.1100869 17 September 2014 | Volume 1 | e869
Figure 17. Relative tariff for energy consumption at medium voltage 35 kV (MWh/month).
must has a great attention from governments to support. The economic situation of a country relative to others can be determined by the proposed tariff map.
References
[1] Hamed, M. and Hamed, I. (2011) Electric Distribution Networks. Lambert Academic Publishing (LAP), Germany. [2] Tariff book.pdf, Jan. 2014.
[3] The World Bank (2014) Reports of The World Bank about the Electricity in Different Countries.
http://www-wds.worldbank.org/external/default/WDSContentServer/WDSP/IB/2013/06/24/000333037_20130624101
834/Rendered/PDF/768200Revised00rt0REVISED0JUNE02013.pdf
[4] Tariff Base Information (2014). www.era.or.ug
[5] Alexander, L. (2014) Tariff Setting Guidelines: A Reduced Discretion Approach for Regulators of Water and Sanita-tion Services—A Technical Guide (English).
http://documents.worldbank.org/curated/en/2009/01/10201002/tariff-setting-guidelines-reduced-discretion-approach-re gulators-water-sanitation-services-technical-guide
[6] Hamed, M. and Nada, S. (2011) Analysis of Electric Loads. Lambert Academic Publishing (LAP), Germany. [7] Hamed, M. and Hamed, I. (2014) Protection Systems in Electric Networks, 2014. Project ID: #106399, cmuchi Editor. [8] Raja, V.P., Kulkarni, S.B. and Sonavane, V.L. (2010) Aggregate Revenue Requirement and Tariff Determination for
FY 2010-11.
[9] Union Report: The Arab Union for Electricity 2012 (2012). http://www.auptde.org/UsefulLinks.aspx?lang=ar
[10] Annual Repot of National Electricity Co. in Jordon (2013). http://www.nepco.com.jo/
[11] Jamil,F. (2014) Comparison of Electricity Supply and Tariff Rates in South Asian Countries.
http://www.efsl.lk/reports/electricity_supply_south_asian_countries.pdf
[12] The World Bank (2013) Electricity for All Options for Increasing Access in Indonesia. [13] Ministry of Energy and Mineral Development (MEMD) (2014) Energy Policy for Uganda.
http://www.energyandminerals.go.ug/
[14] Annual Reports of Uganda Electricity Regulatory Authority, End-User Consequences of Generation Contracts (2011).
OALibJ | DOI:10.4236/oalib.1100869 18 September 2014 | Volume 1 | e869
[15] Sandra Crist’ovao: National Director for Renewable Energies (2014) The Renewable Energies in Angola Current Pic-ture and Perspectives.
http://www.energyafrica.de/fileadmin/user_upload/Energy-Africa__12/Presentation_Ministry%20of%20Energy%20an d%20Water_The%20renewable%20energies%20in%20Angola.pdf
![Table 1. Electric energy slab tariffs (monthly) for Arab countries (Division 1) [9].](https://thumb-us.123doks.com/thumbv2/123dok_us/8113327.791725/3.595.90.539.215.725/table-electric-energy-tariffs-monthly-arab-countries-division.webp)
![Figure 1. Tariffs for Division 1 of Arab countries [9].](https://thumb-us.123doks.com/thumbv2/123dok_us/8113327.791725/5.595.133.495.440.651/figure-tariffs-division-arab-countries.webp)
![Figure 5. Tariffs for Asian countries [10].](https://thumb-us.123doks.com/thumbv2/123dok_us/8113327.791725/6.595.138.488.294.538/figure-tariffs-asian-countries.webp)