Munich Personal RePEc Archive
Measuring the Effectiveness of
Competition Policy: Evidence from the
Turkish Cement Industry
Kulaksizoglu, Tamer
25 March 2004
Measuring the Effectiveness of
Competition Policy: Evidence from the
Turkish Cement Industry
Tamer Kulaksızoˇ
glu
Department of Economics
Purdue University
March 25, 2004
Abstract
In this paper, we develop a method to measure the impact of the
introduc-tion of competiintroduc-tion policy in a country on the performance of an industry.
Our method employs the New Empirical Industrial Organization (NEIO).
We apply the method to the Turkish cement industry, which has been
heavily investigated by the Turkish Competition Authority. The results
indicate that the degree of market power has gradually decreased in the
Turkish cement industry over time. However, we cannot detect any clear
evidence that the decrease is due to the introduction of competition policy
in Turkey.
1
Introduction
Since the signing of the Treaty of Rome in 1957, Turkey has sought to become a member of the European Union (then the European Economic Community). During this mostly disappointing and as yet unfinished process, Turkey has adopted many economic (like customs union) and political (like human rights issues) laws, rules, and practices of the European Union. The most important economic adoption, though, was the passage of the Law on the Protection of Competition in the Turkish Parliament in 1994. As a consequence of the Law, the Competition Authority, which is the body responsible for applying the Law, was established in 1997.
our knowledge, Turkey’s competition policy has not been the subject of any economic research up to now. Thus, this is the first study investigating the effectiveness of competition policy implementation in Turkey.
There are other studies similar in spirit to this one for different countries. For instance, [7] “investigate the impact of competition policy on the level and the dynamics of firm price cost margins in two European countries, Belgium and the Netherlands.”1
[13] makes a similar investigation for the U.S. [14] looks at the price-cost margins in the U.S. manufacturing and aim to detect the relation between these margins and the toughness of antitrust policy. Unlike these stud-ies, we focus on one sector only, because we think that effects of competition policy might not be felt evenly in every sector in a country. Some sectors are more important or strategic than others and keeping a healthy competition in those sectors might be a priority.
The paper is organized as follows. Section 2 briefly looks at the current competition policy in Turkey. Section 3 draws a relatively detailed portrait of the Turkish cement industry. Section 4 presents the theoretical model within the New Empirical Industrial Organization (NEIO) framework. Section 5 develops the econometric model based on the theoretical model. Section 6 discusses the data we use. Section 7 presents the results and Section 8 concludes. Appendix A explains the data we use in detail. Appendix B contains the most relevant articles of the Law on the Protection of Competition.
2
Competition Policy in Turkey
Competition policy in Turkey began in 1994 with the passage of the Law on the Protection of Competition, Law No. 4054, by the Turkish Parliament2
.
1
[7], p. 841.
2
Article 167 of the Turkish Constitution attributed to the government the duty and the responsibility to take measures to provide and improve healthy and regular procedures in money, credit, capital, product, and services markets and to prevent monopolization and cartelization created as a result of any activity or agreement in these markets. But there was no separate body in Turkey directly responsible for applying Article 167 until 1997 nor was there a separate law until 1994.
In 1997, three years after the passage of the Law, the Competition Authority was established. The Competition Authority is the body responsible for apply-ing the Law. The implementation of the Law by the Competition Authority can be broadly summarized in three categories: Competition infringement, negative clearance and exemption, and mergers and acquisitions.
2.1
Competition Infringement
The relevant articles here are Article 4 and Article 6 of the Law.3
Article 4 aims to prevent the distortion of competition by collusive behavior in the form of decisions, agreements, or concerted practices between undertakings in a certain market of goods or services. Article 4 is similar in nature to Article 85, Paragraph 1 of the 1957 Treaty of Rome4
. Article 6 aims to prevent the abuse of a dominant position by undertakings which have a dominant position in a certain market of goods or services. Article 6 is similar to Article 86 of the 1957 Treaty of Rome5
.
If it is thought that any of these articles has been infringed, either upon application by a third party or on its own initiative, the Competition Author-ity applies Article 40, which basically calls for either a preliminary inquiry in
3
All the relevant articles are in the appendix.
4
The paragraphs of the EU Treaty have been renumbered by the Treaty of Amsterdam. So Article 85, Paragraph 1 is now Article 81, Paragraph 1, but the substance of the Article is unchanged.
5
order to decide whether it is necessary to initiate an investigation or for mov-ing directly to an investigation. If the Competition Authority decides that an infringement exists, then it imposes fines based on Article 16 of the Law.
2.2
Negative Clearance and Exemption
Article 5 of the Law provides for exemptions to Article 4. Under this article, even if there exists an agreement, concerted practice, or decision which restricts competition, the Competition Authority may declare an exemption from the ap-plication of Article 4 upon the apap-plication of the parties concerned and if certain conditions are met. These conditions include agreements, concerted practices and decisions which allow consumers to share from the resulting benefit, con-tribute to new developments and progress or technical or economic improvement in production or distribution of goods and in providing services, which do not eliminate competition in a substantial part of the relevant market and do not induce a restraint on competition that is more than essential to obtain the re-sulting benefits. Article 4 is similar in nature to Article 85, Paragraph 2 of the 1957 Treaty of Rome.
2.3
Mergers and Acquisitions
legally valid.
Thus, Articles 4, 5, 6, and 7 altogether define the essence of Turkish com-petition policy. The Comcom-petition Authority’s role is important here because it has both investigation and jurisdiction power. Firms can, however, appeal its decisions to the Council of Appeals.
3
The Turkish Cement Industry
3.1
Cement and Its Characteristics
Cement is a hydraulic binder produced by grinding clinker, which is obtained as a result of the burning of raw materials containing calcium (limestone), silica, aluminium oxide, and iron oxide (clay and sand) at high temperatures, with gypsum in certain amounts. The economic characteristics of cement can be summarized as follows. On the supply side, the main characteristics are that
• it is an intermediate (producer) good,
• its production requires high investments (large fixed costs, mainly plant costs),
• there are scale economies in its production,
• long term storage, which is costly, is not economically feasible6
, and
• its value-to-weight ratio is low, which is why transportation is costly and shipment to destinations further than 200 kilometers is not economical.
On the demand side, the main characteristics of cement are that
• it is homogenous,
6
• its price elasticity of demand is low because it has no close substitutes7
,
• its demand is geographically dispersed and corresponds to the population density, and
• its demand is seasonal as a result of changes in construction activities.
Turkey is one of the biggest cement producers in the world8
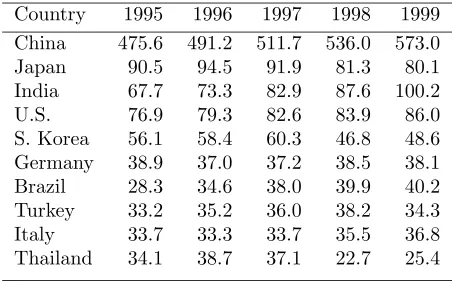
. Table 1 shows the 10 biggest cement producers for the 1995-1999 period sorted by the mag-nitude of their average production for the period. As can be seen, Turkey is always one of the 10 biggest producers in the world and one of the 3 biggest in Europe.
Cement production has a long history in Turkey. The first plant was es-tablished in 1911. However, from 1911 to the early 1950s, cement production was carried out only by the state. In 1950s, the state launched a series of aids to the private sector in order to encourage investments in the cement industry. From that time on, cement plants were established by both the state and the private sector. However, production was not enough for the domestic demand and cement import continued until 1970s.
3.2
Production, Sales, and Distribution
Figure 2 shows production and domestic sales of cement in Turkey. As can be seen, except for the last few years, most of the cement is used within Turkey. Since imports are low and holding stocks is too costly, the difference between production and domestic sales is very close to exports. Unlike the situation in industrialized countries, the demand is increasing over time. The upward
7
There are three possible substitutes for cement: asphalt in road construction and steel and wood in building construction. However, steel and wood are not legitimate substitutes for cement in Turkey due to their high costs.
8
trend is clearly visible and the peak occurred in 1998. The major earthquake in 1999 and the economic crisis in the following two years caused the demand to fall. Until 1998, the trend was encouraging for the entry of new competitors. Between 1978 to 1997, 20 new plants started to operate throughout Turkey and 2 plants exited the industry. Out of these 20 plants, 7 belonged to new firms entering the market, 6 belonged to already existing firms, and the other 7 belonged to the state, which eventually would be privatized. Since 1998, no new plants have been established, but one plant exited the industry.
The distribution of cement in Turkey is carried out through two channels: either from plants directly to the final destination or from plants to middlemen, which distribute cement to the final destination. Among the final destinations of cement are ready-mixed concrete companies, including the cement companies themselves since many cement companies also produce ready mixed concrete, construction companies, and the state. Roughly 60% of total cement sales go to middlemen, 20% to ready-mixed concrete companies, 10% to construction companies, and 1-2% to the state.
3.3
Ownership
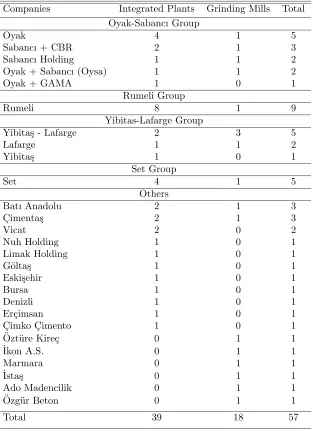
Turkey’s cement industry currently consists of 57 cement plants, 39 of which are integrated cement plants and 18 are grinding-packaging plants9
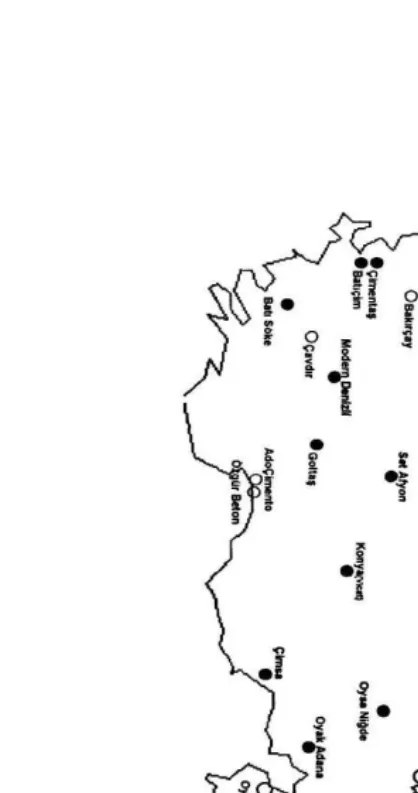
. All of the plants are in the private sector. As can be seen in Figure 1, the plants are homogeneously distributed all over Turkey although there is a bit concentration in the northwestern part. This is to be expected because that part of Turkey has the highest population density and is the most developed region.
Table 2 shows plants and their owners. There are 27 cement companies
oper-9
ating in Turkey. However, there are strong business ties among some companies and we include them in groups. For instance, Oyak and Sabancı together have 9 integrated plants and 4 grinding-packaging mills. Similarly, Yibita¸s and La-farge have common and separate plants. The companies shown in the “Others” section do not belong to a group. Those in the last 6 rows have only a single grinding mill and are very small companies. Their annual production is usually less than 100 thousand tons.
3.4
Capacity
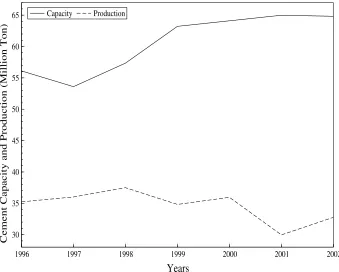
The industry has almost always produced under capacity. Figure 3 shows the total capacity and cement production from 1996 to 2002. As can be seen, cement production has a clear, albeit gradual, decreasing trend. Nevertheless, the total capacity shows a clear uprising trend. The result is an increasing trend in excess capacity. It seems that the plants invested heavily in capacity, especially for the last 6 years. The main reason for the excess capacity is state aids specifically granted to create new capacity10
. In cement production in Turkey, capacity constraints are more likely to show themselves in clinker production.
3.5
Cost Structure
The main cost items in cement production are electricity, fuel (coal and/or oil), labor, kraft paper for packaging, and raw materials. Table 3 shows the main elements in the cost of cement production in Turkey. As can be seen, the most important cost item is electricity. Fuel is the second most important cost item. As a result of the oil crisis in 1970s, coal has replaced oil as the main energy source for many plants11
. Labor costs take the third place. Kraft
10
Even the President of the TCMA complained about the situation in an address published in the Annual Reports of the TCMA. He claimed the state aids should aim at investments for decreasing costs rather than increasing capacity
11
paper, which is used as the packaging material in cement production, is the fourth most important cost item. Although the ratio of bagged cement to bulk cement has somewhat decreased over time, it was more than 50% for most of our sample period. That’s why its share in unit cost cannot be disregarded. We were able to collect price data for kraft paper long enough to cover the sample period 1986-2002. That’s why we did include it in our econometric analysis. Unfortunately we were not able to collect price data for raw materials. However many firms have their own quarries12
but we do not have detailed information about which firms have their own quarries and which do not. If most of the firms have their own quarries then including prices of raw materials might not be a good idea. In short, our econometric specification covers approximately 70% of the cost items in cement production.
3.6
Foreign Trade
The cement industry enjoyed the benefits of tariff protection until the 1980s13
. The 1980s saw Turkey open up its economy. However the industry started to export in large amounts only recently. Imports have never been significant14
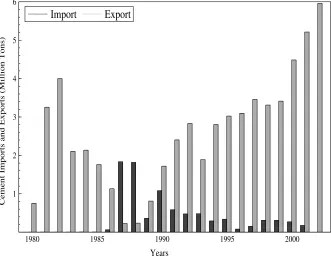
. It is interesting to observe that the sector exported in large amounts only when the domestic demand shrank. For instance, the economic crisis of 2001 caused the industry to export an unprecedented amount of cement. This may show that the domestic market is profitable enough and producers turn to export only when they...
Figure 4 shows the cement exports and imports in million tons from 1980 to 2002. As can be seen, the volume of exports were relatively high in 1980s, an era when Turkey adopted open economy policies for the first time in its history. The 1990s saw an even greater increase in exports. During this period, the
12
Personal interview with an expert in the Turkish Cement Producers’ Association.
13
[3], p. 275.
14
volume of exports steadily increased, reaching a record level of 6 million tons in 2002, approximately a quarter of domestic sales. As the figure shows, during 1980s cement imports were basically zero. Late 1980s and early 1990s saw a little bit of imports. From that date on, imports were of minor levels. Thus the figure tells that domestic cement producers in Turkey have never faced serious import competition.
Turkey exports cement to Africa, America, Asia, Europe, and Middle East. But most of the cement is exported to European Union countries like Italy, Spain, France, Ireland, and Belgium. U.S. has been the second biggest market for Turkey, especially for the last few years. Almost all export is carried out by sea. That gives cement companies that have plants near the coasts an edge. The driving force behind export is Turkey’s low cement prices, which may be due to low wages and relatively cheap raw materials. Still another factor may be that they cut their prices15
in world markets rather than keeping their excess production in stocks. Initially, one of our explanations behind Turkey’s low cement prices in international markets was some form of state aids. However, a recent report by the State Institute of Planning claims that there are no export subsidies in the cement industry16
.
Note that the fact that some cement firms export does not necessarily mean that they make profits from it. The real issue for cement firms can be stated as follows. Firms make production and domestic sale plans at the beginning of each period. If, for some reason, their plans could not be realized, they find themselves with large amounts of excess production. At this stage, the behav-ior of cement firms depends on their location. Those firms that are close to the coasts turn to exporting. In-land firms enter other nearby territories. In either
15
The same price cut may not be likely to invoke the same amount of sales in domestic market compared to international markets. That may be the reason the cement firms especially turn to world markets when there is recession in the Turkish economy.
16
case, they cut their prices in order to sell off their excess production. This may mean that they do not make profits at this stage. However, their other alterna-tive, keeping excess production in stocks, is either physically impossible, if their excess production is becoming too large, or too costly to be feasible. In either case, cutting prices and entering other territories, domestic or international, is a better choice.
3.7
Concentration
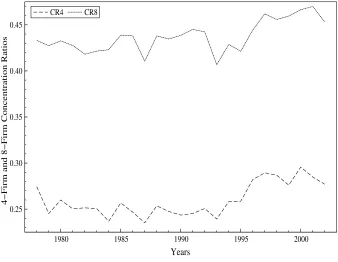
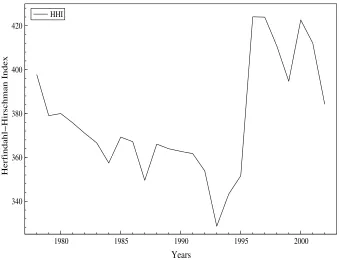
Concentration has been very stable in the industry over the last 25 years. Table 4 shows the various concentration measures and their summary statistics. The four-firm concentration ratio (CR4) has a mean value of 26%. The standard deviation is very low, showing that the mean value has not changed much dur-ing the last 25 years. The minimum CR4 was around 25.5% in 1987 and the maximum was around 29.5% in 2000. The 8-firm concentration ratio has also been very stable. Over the last 25 years, its mean value was approximately 44% with a very low standard deviation. Table 4 also shows the the Herfindahl-Hirschman Index (HHI), which gives a better idea about the overall situation in the industry.
year before the Competition Authority was established. The merged company, Ak¸cansa, produces around 10-15% of total cement production in Turkey.
The figures indicate that there are around 8-10 big plants producing approx-imately half of total cement production in Turkey. The rest, which is around 40 plants, are relatively small and share the other half.
3.8
External Shocks
There have been a couple of external shocks to the sector in the near past, which changed the structure of cement production in Turkey. The earliest one was the oil crises in the 1970s, which caused many plants to switch from fuel oil to coal17
. Currently most of the plants use coal as fuel source. Another effect of the oil crises was that most of the plants were transformed to the dry system18
. Another negative shock, which began in 1997, was the Far East Financial Crisis. The shock hit the Turkish cement industry in 199819
.
Earthquakes create negative external shocks to the cement industry all over the world. The major earthquake in 1999 and its after-shocks caused many construction projects to halt. The result was a major negative effect on the demand for cement. Finally, the worst economic crisis in Turkey, which started in late 2000 or early in 2001 and lasted into 2002, hit the cement industry as well as other industries. For instance, many sectors experienced negative growth rates in 2002.
The reaction of plants to these external shocks can be divided into two sections. On the one hand, plants that are close to the coast depended on exports during difficult times when domestic demand shrank. On the other hand, in-land plants competed fiercely among each other, entering each other’s
17
Coal is basically petroleum coke coal, import coal, and lignite in decreasing order of usage.
18
There are basically three types of cement production: wet, half-dry, and dry. The dry system is the most energy efficient.
19
territories20
. They usually cut prices in order to sell excess production.
3.9
Government Intervention and Privatization
In the past, government intervention in cement industry has taken various forms, although it has substantially decreased over time. One form of government in-tervention is state aids aiming at capacity increases21
. The main purpose of these state aids may be a desire to avoid cement imports. The state may want to make sure that the domestic production is always capable of satisfying do-mestic demand. Developing countries like Turkey try to avoid imports because they usually experience financial instabilities, which result in shortages of for-eign currencies like the dollar. Another possible explanation is the lingering mercantilist view Turkey still has that exports are good and imports are bad for the country’s economy. This view gained momentum in 1980s when the state started to grant export subsidies in large amounts to various industries.
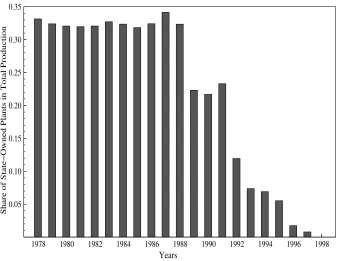
A sign of decrease in the scale of government intervention in the industry is privatization, which started in 1989 and ended in 1997. The number of state-owned plants was 24 in 1988. 5 of them were sold in 1989. The second large-scale privatization occurred in 1992, in which year 7 plants were privatized. The rest, a total of 12 plants, were sold between 1993 and 1997. Figure 7 shows the share of state-owned plants in total cement production between 1978 and 1998. As can be seen, the state-owned plants were relatively small and their total share in production was never significant. For instance, the 24 plants, around two third of the total number of plants, produced only a third of total cement output between 1978 and 1988. Between 1990 and 1994, state shares in 5 plants, apart
20
There are implicitly drawn territories in the cement industry in Turkey. There are seven territories, which are Aegean, Marmara, Black Sea, Central Anatolia, Mediterranean, Eastern Anatolia, and Southeastern Anatolia, and any plant within a territory primarily aims to sell within it. Of course, these territories do not necessarily represent economic markets or antitrust markets. However, the Competition Authority used these territories as the bases for defining geographic markets in cement investigations.
21
from the 24 plants in the privatization program, were sold to private sector. We exclude them in Figure 7 because they were small shares and the state never had any influence in management.
Privatization also attracted foreign capital into the sector. Currently there are four foreign firms operating in Turkey: Lafarge Coppee (French), Hei-delberger Zement/CBR (German), Ciment Francais-Italcementi joint venture (Italian-French), and Ciment Vicat (Belgian). They are among the 10 leading companies in world cement production.
Another sign of decrease in the scale of government intervention was the relaxation of price controls in the industry following the open economy policies adopted at the beginning of 1980s, which changed the face of cement industry as well as many other industries. For instance, until 1982, cement prices were determined by the state22
. In 1982, the Ministry of Industry authorized the Turkish Cement Manufacturers’ Association to determine cement prices subject to its approval. Cement prices were completely set free in December 1985 and have been determined by the market conditions since then.
3.10
Cement Industry Investigations
Law.
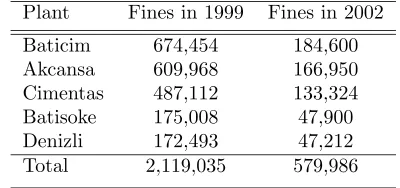
The first cement industry investigation by the Competition Authority con-cerned 5 cement companies operating on the west of Turkey. The plants were Ak¸cansa, Batı¸cim, Batıs¨oke, C¸ imenta¸s, and Denizli, whose combined produc-tion constituted around 20-30% of total cement producproduc-tion in Turkey. The complaint was originally filed by the ˙Izmir Trade Chamber to the Ministry of Industry and Commerce. It claimed that the cement plants applied parallel prices. On February 21, 1997, the Ministry decided to convey the complaint to the Competition Authority, which was not established yet. When the Authority was established later in the same year, the Board immediately decided to start an initial examination. The initial examination report suggested the need for a preliminary research and the preliminary research report suggested an inves-tigation though the research committee was not able to find any evidence for parallel pricing. The investigation committee determined the relevant product market as Portland cement, Portland pozzolana cement, and Portland limestone cement and determined the relevant geographic market as Aegean, obeying the implicit territorial classification we mentioned earlier. The investigation com-mittee claimed that the plants determined their annual sales collusively, shared the relevant geographical market, determined prices outside the market con-ditions through continuous meetings, and created an export cartel in order to keep a certain domestic price level. The Competition Board announced its de-cision on June 17, 1999 and penalized the five cement firms. The cement firms immediately appealed the decision. As of 2002, the case is still pending in the courts.
exchange rate of the dollar to the Turkish Lira increased about 3.5 times between 1999 and 200223
, the real value of the fines substantially decreased. This case is a generic example of the situation of the competition policy implementation in Turkey.
The second cement industry investigation, which was decided by the Com-petition Authority on its own initiative on June 20, 2000, was much bigger in scale. The Authority decided to simultaneously investigate the cement plants operating in Central Anatolia, Marmara, and Mediterranean regions. The inves-tigation included 21 cement plants24
. The investigation concerned price fixing and market sharing issues. The investigation committee determined the relevant product market as Portland gray cement and blended Portland gray cement and the relevant geographic markets as Central Anatolia, Marmara, and Mediter-ranean. The Competition Board decided on February 2, 2002 and penalized 18 of the 21 cement companies investigated25
Table 6 shows the monetary fines in dollars26
.
4
The Theoretical Model
We use the New Empirical Industrial Organization (NEIO) approach originated by [1] and [9]. The NEIO approach, using aggregated industry data and spec-ifying a demand and a supply equation, estimates the degree of market power in an oligopoly market. A clear exposition can be found in [11]. We follow [1].
Let the demand function be
23
One dollar was 412,533 TL in June 1999 and 1,507,230 TL in 2002.
24
The plants were Adana, Ado, Afyon, Ak¸cansa, Anadolu, Ba¸sta¸s, Batı¸cim, Bolu, Bursa, C¸ imsa, Denizli, Eski¸sehir, G¨olta¸s, Konya, Lafarge Aslan, Marmara, Nuh, Oysa ˙Iskenderun, Oysa Niˇgde, Set, and Yibita¸s-Lafarge.
25
Namely, Adana, Ado, Afyon, Ak¸cansa, Anadolu, Ba¸sta¸s, Batı¸cim, Bolu, Bursa, C¸ imsa, Eskisehir, Konya, Lafarge Aslan, Nuh, ˙Iskenderun, Niˇgde, Set, and Yibita¸s-Lafarge.
26
Q=D(P, Y, Z;α) +ǫ
where Q is quantity, P is price, Y is a vector of exogenous variables shifting the demand curve, e.g. income, and Z is another vector of exogenous variables ro-tating demand curve, e.g. price of a substitute good,αis a vector of parameters to be estimated,ǫ is the error term, andD(·) is the demand function.
If the sellers in the market are price takers, then price, marginal revenue, and marginal cost are equal in long-run equilibrium and the supply equation can be expressed as
P =c(Q, W;β) +η
where W is a vector of exogenous variables affecting the supply side, e.g. factor prices,β is the vector of parameters to be estimated,η is the error term, and
c(·) is the marginal cost function.
If the sellers are not price takers, then perceived marginal revenue, instead of price, and marginal cost will be equal. Now we have a supply relation in the form of
P =c(Q, W;β)−λ·h(Q, Y, Z;α) +η
where λ is a conduct parameter measuring the degree of market power and
h(·) is the first derivative of the inverse demand function with respect to Q
times Q27
. Note that 0 ≤ λ ≤ 1. If the market is perfectly competitive, then λ = 0 and price equals marginal cost. If the market is monopoly, then
λ = 1 and monopoly marginal revenue, P +h(·), not price, equals marginal cost. 0< λ <1 corresponds to various degrees of market power for oligopolistic
27
markets and P +λ·h(·), which is called perceived marginal revenue, equals marginal cost.
If demand function,D(·), is linear in the variables, then there is an identifi-cation problem ofλ. [1] solved this problem by defining a demand curve which is nonlinear in a special way. His demand function specification is
Q=α0+α1P+α2Y +α3P Z+α4Z+ǫ, (1)
where the interaction termP Z implies that the demand function rotates when the exogenous variables vector changes in value. If we also specify the marginal cost function as
M C=β0+βQQ+βWW,
then the supply relation is given by
P =β0+βQQ+βWW−λ
Q
α1+α3Z
+η. (2)
Note that
h(Q, Z;α) =
Q
α1+α3Z
,
which is the first partial derivative of the inverse demand function with respect to Q multiplied by Q. In practice one estimates equations (1) and (2) together.
5
The Econometric Model
The empirical analysis begins with the specification of a demand equation for cement. Our demand specification is very simple:
wheretis a period in time,Qtis the quantity of cement shipped at timet,Ptis
the price of cement at timet, andT CEtis the total, housing plus non-housing
(infrastructure), construction expenditures at timet. Unlike some other studies, e.g. [6], [2], and [10], we do not include the price of a substitute good for cement in the demand specification. The reason is that there is no good substitute for cement in Turkey. Steel and wood may be considered as substitutes for cement in housing construction. But in Turkey almost all housing construction uses bricks or concrete as the main ingredient and cement is used as the main product to bind bricks and it is the main ingredient in concrete. Note that this is not the case in the U.S. where, for instance, wood is used in many construction projects, which is almost never the case in Turkey. As to non-housing construction28
, only asphalt can be considered as a feasible substitute for cement. But asphalt is used only in inter-city road construction and thus constitutes a minor part of non-housing construction.
Although some construction projects may last longer than a year and this may affect the future demand for cement, we do not include any lagged housing and/or non-housing construction expenditures because they did not turn out to be statistically significant in our experiments with different demand specifica-tions, which implies that most of the projects are finished within a year. Also using total construction expenditures instead of using housing and non-housing construction expenditures separately conserves degrees of freedom without any significant changes in the results for the demand estimation. Finally, we expect
α1 to be negative andα2 positive.
The specification of the supply side begins with the marginal revenue equa-tion. If the cement market is perfectly competitive, then the marginal revenue is equal to price. But if there is imperfect competition in the cement market,
28
then the perceived marginal revenue is
M Rt=Pt+λ
Qt
α1
whereλis the conduct parameter. λis specified to be between zero and one. For instance, ifλ= 0, then the cement market is perfectly competitive. If it is one, then a monopoly or perfect cartel applies. Cournot equilibrium hasλ= 1/n if there arenidentical firms in the market.
Since the equality of marginal cost and marginal revenue is the profit max-imization condition and is independent of market type, the next thing to do is to specify the marginal cost equation for the cement industry. In cement production, we assume that marginal cost depends only on input prices29
:
M Ct=c(P Lt, P Et, P Ct)
where P Et is the price of electricity,P Ct is the price of coal, andP Lt is the
price of labor. Our MC specification, linear in input prices30
, is
M Ct=β0+β1P Lt+β2P Et+β3P Ct+δt
If we equate the marginal revenue and the marginal cost equations and arrange, we get
Pt=β0+β1P Lt+β2P Et+β3P Ct−λ
Qt
α1
+δt (4)
We are going to specifyλin such a way that it will let us capture the impact
29
The theoretical framework assumes that the firms are price-takers in input markets. The prices of electricity, coal, and kraft paper are exogenous in the cement industry since they are either produced by the state or imported. The only input price that cement firms may have control over is labor. However, Turkey has been applying a minimum-wage rule for years under which it is illegal for employers to employ workers, which prevents firms from enforcing their buyer powers.
30
of the competition policy introduction on the performance of the Turkish cement industry. We have three different specifications31
:
λ1
t =λ
1
0+λ
1
1T+ε
1 t
λ2
t =λ
2
0+λ
2
2D97 +ε
2 t
λ3
t =λ
3
0+λ
3
1T+λ
3
2D97 +ε
3 t
whereD97 is a dummy variable taking a value of 0 before 1997 and 1 after, and including, 1997 since 1997 is the year that competition policy was effectively introduced and T is a time trend32
. We include the dummy variable to test whether or not the introduction of competition policy had an immediate effect on market performance. If λ2 turns out to be statistically insignificant, then
we can conclude that introduction of competition policy did not have a discrete impact on the cement industry. We include the time trend to test whether the value of the market power parameter decreases (λ1 <0) or increases (λ1>0)
over time. This specification will also let us make some inferences. For instance, if both of the parameters turn out to be statistically significant andλ2<0, then
we can conclude that the competition policy implementation has been effective at decreasing the market power in the cement industry over time.
Adding our most general conduct parameter specification forλt, the equation
becomes
Pt=β0+β1P Lt+β2P Et+β3P Ct λ
3
0+λ
3
1T +λ
3
2D97
Q
t
α1
+ξt (5)
31
Similar specifications for the conduct parameter appear in [6], p. 395. and [2], p. 1004.
32
where
ξt=δt−
Qt
α1
ε3
t
and similarly for the other two specifications. Note that this introduces het-eroscedasticity into the model. We use nonlinear three-stage least-squares to estimate the non-linear simultaneous equations system composed of equations 3 and 4.
6
Data
Our data set includes 9 variables and covers 1986-2002 period. We have data for the earlier years but exclude them from our estimations since cement prices were freely determined in the market only with the beginning of 1986. Table 7 presents some summary statistics of the data. All monetary series are deflated with the consumer price index taking 1995 as the base year in order to remove the inflationary effects.
The endogenous variables are domestic cement sales (Q) and real cement prices (P). Domestic cement sales are measured in million tons. The table shows that domestic cement sales was around 27 million tons on average between 1986 and 2002. Real cement prices are measured in million Turkish Liras (TL) with a base year of 1995.
The other exogenous variables are time and competition policy dummy. Time variable is a sequence starting from 1 and ending in 17. Dummy vari-able takes a value of zero before the introduction of competition policy and zero after it.
7
Estimation and Results
In this section, we present our results. Our estimation technique is nonlinear three-stage least-squares33
. During the estimation process, we used all the ex-ogenous variables and their squares as the instruments (following [4], p. 440). Table 8 shows the estimation results for different system specifications.
The main purpose of model 1 is to estimate the market power in the ce-ment industry. Each variable is statistically significant at least at 5% level of significance. The signs of the variables are as expected. On the demand side, we experimented with once- and twice-lagged total construction expenditures but they never turned out to be significant. It seems that most of the con-struction projects are finished within a year. We also experimented with the price of asphalt, the price of a substitute good for cement. It also did not give statistically significant results, which suggests that asphalt is a weak substitute for cement. We decided to include total construction expenditures instead of including housing and non-housing (infra-structure) construction expenditures separately in order to conserve the degrees of freedom. On the supply side, the results show that each of the inputs is significant in cement production and has a significant contribution to the value of constant marginal cost. The value of the conduct parameter shows that the cement industry as a whole enjoyed some degree of market power over the sample period. In other words, if we
33
assume that the industry is composed of a single firm, this firm has some degree of market power. Since the industry is composed of many firms, the conduct parameter shows the average degree of market power over the firms34
.
Model 2 looks at the change of the conduct parameter over time, keeping demand and supply specifications the same. It assumes that the conduct pa-rameter is a linear function of time. The results indicate that the market power gradually decreased in the cement industry over time. The coefficient of the time variable is statistically significant at the 10% significance level. A nat-ural question here is whether the introduction of the competition policy had something to do with the fact that the market power gradually decreased 1986 through 2002.
Model 3 assumes that the conduct parameter is a linear function of a dummy variable which takes a value of zero before 1997 and a value of 1 after and in-cluding 1997. The results are surprising. We find that the introduction of competition policy had no effect on the market power in the cement industry since the coefficient of the dummy variable is not statistically different from zero. The estimation ofλ0 shows that the market power before the introduction of
competition policy was around 0.415. The introduction of competition policy seems to have a positive effect on the degree of market power. However, theλ2
coefficient is not statistically different from zero. So we conclude that compe-tition policy had no effect in the cement industry. Since the other parameters are approximately the same as in Models 1 and 2, the specification seems to be robust.
Finally, Model 4 assumes that the conduct parameter is a function of both time and the dummy variable. This formulation will let us look at the imme-diate effects of the introduction of competition policy in a better way since the time variable controls the change in the market power over time. The results
34
corroborate our earlier findings. The coefficient of the dummy variable is still not statistically different from zero, which once again shows that the introduc-tion of competiintroduc-tion policy had no apparent effect on the market performance of the cement industry. On the other hand, the coefficient of the time variable is still negative and statistically significant at the same degree, showing once more that the market power gradually decreased for the time interval between 1986 and 2002.
The fit measures R2
and ¯R2
are very high for both demand and supply equations for every model, showing that our specifications fit the data very well. The LM p-value rows show the p-values of the Lagrange Multiplier test for serial correlation in the error terms and the DW statistic rows show the Durbin-Watson test statistics for the same purpose. The demand equation is free of serial correlation as both the LM test and the DW test show. The supply equation is also free of serial correlation when the specification includes a time trend, which is model 2 and model 4. We get mixed results for models 1 and 3. The LM test shows the existence of serial correlation in these models. However, the DW test statistic for these models fall into the no serial correlation area. We conclude that we cannot clearly accept the existence of serial correlation in the specifications 1 and 3. We also use White’s test for heteroscedasticity in the error terms and accept the null hypothesis that there is no heteroscedasticity.
10%. The dummy variable is also negative but still insignificant. This may imply that the impact of the introduction of competition policy may be kicking off in time since the sign of its coefficient changed from positive in 1997 to negative in 1998. It would be interesting to experiment with other dummy variables, but with the current data set, these experiments would not be meaningful. We also experimented with dummies for the external shocks mentioned in the third section but none of them produced statistically meaningful results.
Table 9 shows the partial derivatives of the demand and supply equations evaluated at the sample means for each model. The slope of the demand curve is negative as expected and statistically significant for each model. The sign of the partial derivative of the demand equation with respect to the current total construction expenditures is positive as expected and also statistically significant for each model. The results show that our demand specification is very robust.
As to the supply equation, models 1 and 3 exhibit good results. The ef-fects of the labor, electricity, coal, and kraft prices on the equilibrium price of cement are always positive, as expected, and statistically significant. The partial derivatives of the supply equation with respect to output are positive and significant. Both of the models show that the market power in the cement industry is around 0.40-0.44. Since the introduction of the competition policy does not produce statistically significant results, we do not attempt to measure the degree of market power before and after it. Price cost margin shows that the real price over the sample period was around 1.2-1.4 million TL above the constant marginal cost with 1995 prices.
not assumed that a causality relation between them exists. We wanted to see if there is a time trend in the market power and if there was, how our results would change if we accounted for it. The results showed that there is a slight decrease in the degree of market power. However, the relation was not too strong since the coefficient of the time variable was significant only at a 10% level. Model 4 showed that accounting for the slight time trend did not change our results at all.
8
Conclusion
In this paper we tried to evaluate the impact of the introduction of competition policy on the performance of the Turkish cement industry. Based on our results, we can conclude that the cement industry has gradually become more compet-itive over time since the sign of the parameter of the time trend in our supply equation is negative and the parameter itself, although small in absolute value, is statistically significant. The Competition Authority dummy turned out to be statistically insignificant even when we assume that it might have a lagged impact. These results are contrary to our initial expectations and show that the introduction of competition policy has not made the cement industry more competitive despite all the investigations and monetary penalties. However, the results are consistent with our finding that the competition policy implementa-tion in Turkey has serious obstacles35
. On the other hand, these results may change over time. The impact of competition policy may show itself in the data in the coming years.
Our method to assess the introduction of competition policy is general enough. It can be applied in other settings. A natural extension of the method is to use plant-level data and to delineate geographical markets and measure
35
market power in each of them. That’s for the future research.
Appendix A
This appendix explains the data set we use in the text in more detail. The following is a detailed discussion of the data we use.
Total Construction Expenditures (T CEt): Annual total construction
expen-ditures at 1995 prices in billions of Turkish Liras are obtained from SourceOECD Databases, Annual National Accounts, Main Aggregates, GDP: Expenditure Approach. It is composed of housing construction expenditures (HCEt) plus
non-housing construction expenditures (N CEt), that is, infrastructure
expen-ditures.
Price of Coal (P Ct): Annual average steam coal prices per tonne for
in-dustry in 1000 Turkish Liras are obtained from International Energy Agency (IEA) Statistics, Energy Prices and Taxes, various issues. These prices include value added tax. We remove inflationary effects in the series by using wholesale (producer) price index.
Price of electricity(P Et): Annual average electricity prices per kilowatt hour
for the industrial sector in 1000 Turkish Liras are obtained from International Energy Agency (IEA) Statistics, Energy Prices and Taxes, various issues. These prices include excise tax and value added tax. We remove inflationary effects in these prices by using wholesale (producer) price index.
Price of labor (P Lt): Annual average amount of wages and salaries per
UN Statistical Yearbook database, International Yearbook of Industrial Statis-tics, United Nations Industrial Development Organization (UNIDO), various issues. Unfortunately, the series stop at 1997. After 1997, the series is updated by using a earning index per employee in manufacturing sector which takes 1997 as the base year and is published by the State Institute of Statistics, Turkey. We remove inflationary effects in these prices by using wholesale (producer) price index.
Kraft Paper Prices (P Kt): Kraft paper prices were obtained from the State
Institute of Statistics.
Consumer price index (CP It): Consumer price index numbers are obtained
from International Financial Statistics (IFS) database which takes 1995 as the base year.
Price of cement (P Ct): Annual prices of cement per ton are obtained from
the State Institute of Statistics, Turkey.
Domestic Cement Sales (Qt): Total domestic cement sales were obtained
from the annual reports of the Turkish Cement Manufacturers’ Association.
Appendix B
The following are Articles 4, 5, 6, and, 7 of the Law on the Protection of Competition, No. 4054, which are included in Part II, Chapter One, Prohib-ited Practices. Article 4 takes place under the heading Agreements, Concerted Practices and Decisions Restricting Competition.
Article 4- Agreements and concerted practices of the enterprises and
Such practices are, in particular, as follows:
a. To fix purchase or sales prices or the factors such as cost or profit which form
the price or all other trading conditions concerning purchase and sales of goods and services;
b. To share the markets for goods and services or to share or control the market
sources and components;
c. To control or to determine the quantities of supply or demand in the markets
for goods and services outside the market conditions;
d. To impede or restrict the activities of the competitors or to eliminate other
enterprises operating in the market by boycotts or by other practices or to prevent the newcomers in the market;
e. Except exclusive dealing agreements, to apply dissimilar conditions to
per-sons which have equivalent transactions with equal rights and obligations;
f. Contrary to the nature of the agreement or to the commercial customary
rules, to make the conclusion of contracts subject to the purchase of other goods and services or acceptance by the intermediary purchasers to display of other goods and services or acceptance of resale conditions for the goods or services concerned.
In cases where the existence of an agreement cannot be proved, if the price changes or the balance of supply and demand or the areas of activity in the markets of the enterprises concerned are similar to those of the markets where competition is prevented, distorted or restricted, this constitutes a presumption that the enterprises concerned are engaged in a concerted practice.
Article 5 - The Board, in the existence of all the conditions stated below
and upon the application of the parties concerned, may declare the provisions of Article 4 inapplicable to any agreement or concerted practice between enter-prises or decision by associations of enterenter-prises which:
a. Contributes to new developments and progress or technical or economic
im-provement in production or distribution of goods and in providing services;
b. Allows consumers to get a share from the resulting benefit;
and which does not:
c. Eliminate competition in a substantial part of the relevant market;
d. Induce a restraint on competition that is more than essential for the
attain-ment of the objectives set out in paragraphs (a) and (b);
A decision for exemption shall be issued for a specified period of not more than five years. Certain conditions and/or obligations may be attached to an exemption decision. Upon the termination of the specified period of exemption, the decision for exemption may, upon the application of the parties concerned, be renewed if the requirements for exemption continue to be satisfied.
In cases where the requirements stated in the first paragraph are satisfied, the Board may issue communiqus by which certain categories of agreements shall be exempted as a group and the conditions attached thereto are shown.
Article 6- Any abuse, by one or more enterprises acting alone or by means
of agreements or practices, of a dominant position in a market for goods and services within the whole or part of the territory of the State, is unlawful and prohibited.
a. To prevent, directly or indirectly, other enterprises in its area of commercial
activities or practices which aim to impede the activities of the competitors in the market;
b. To make discrimination, directly or indirectly, by way of imposing dissimilar
conditions for equivalent and same rights and obligations to the purchasers who have equivalent position;
c. To make the conclusion of contracts subject to the acceptance of restrictions
concerning resale conditions such as the purchase of other goods and ser-vices or acceptance by the intermediary purchasers to display other goods and services or maintenance of a minimum resale price;
d. Practices which aim to distort competition in a market for goods and services
by means of taking financial, technological and commercial advantages created by the dominant position in another market;
e. To restrict production, marketing or technical development thereby causing
a disadvantage for the consumers.
Article 7 - Merger of two or more enterprises and acquisition, except
ac-quisition by way of inheritance, by an enterprise or by a person, of another enterprise, either by acquisition of all or part of its assets or securities or other means by which that person or enterprise acquires a controlling power in that enterprise concerned, which creates or strengthens the dominant position of one or more enterprises as a result of which, competition is significantly impeded in the market for goods and services in the whole or part of the territory of the State, is unlawful and prohibited.
References
[1] T. F. Bresnahan. The oligopoly solution concept is identified. Economics Letters, 10:87–92, 1982.
[2] D. E. Buschena and J. M. Perloff. The creation of dominant firm market power in the coconut oil export market. American Journal of Agricultural Economics, 73:1001–1008, November 1991.
[3] E. H. C¸ akmak and O. Zaim. Privatization and comparative efficiency of public and private enterprise in turkey: The cement industry. Annals of Public and Cooperative Economics, 63(2):271–284, 1992.
[4] A. R. Gallant. Nonlinear Statistical Models. Wiley, 1987.
[5] M. Guzel. Cimento sektoru raporu. Technical Report 3, T.C. Bas-bakanlik Dis Ticaret Mustesarligi, Orta Anadolu Ihracatci Birlikleri Genel Sekreterligi, 1997.
[6] I. Jans and D. I. Rosenbaum. Multimarket contact and pricing: Evidence from the u.s. cement industry. International Journal of Industrial Organi-zation, 15:391–412, 1996.
[7] J. Konings, P. Van Cayseele, and F. Warzynski. The dynamics of indus-trial mark-ups in two small open economies: does national competition policy matter? International Journal of Industrial Organization, 19:841– 859, 2001.
[8] T. Kulaksızoˇglu. Competition policy inTurkey. 2004.
[10] S. Shaffer. A test of competition inCanadian banking. Journal of Money, Credit and Banking, 25(1):49–61, February 1993.
[11] F. Steen and K. G. Salvanes. Testing for market power using a dynamic oligopoly model. International Journal of Industrial Organization, 17:147– 177, 1999.
[12] Cimento ve Hazir Beton Sanayi Alt Komisyonu. Tas ve topraga dayali urunler sanayii ozel ihtisas komisyonu raporu: Cimento ve hazir beton. Technical report, Devlet Planlama Teskilati, 2000.
[13] F. Warzynski. Did though antitrust policy lead to lower mark-ups in the us manufacturing industry? Economics Letters, 70:139–144, 2001.
[image:36.595.192.418.412.553.2][14] F. Warzynski. Is antitrust policy effective in reducing market power? 2003.
1980 1985 1990 1995 2000 15
20 25 30 35
Production and Domestic Sales (Million Tons)
Years
[image:38.595.140.477.264.523.2]Domestic Sales Production
1996 1997 1998 1999 2000 2001 2002 30
35 40 45 50 55 60 65
Years
Cement Capacity and Production (Million Ton)
[image:39.595.147.486.249.521.2]Capacity Production
1980 1985 1990 1995 2000 1
2 3 4 5 6
Cement Imports and Exports (Million Tons)
Years
[image:40.595.145.476.264.521.2]Import
Export
1980 1985 1990 1995 2000 0.25
0.30 0.35 0.40 0.45
4−Firm and 8−Firm Concentration Ratios
[image:41.595.139.477.264.526.2]Years CR4 CR8
1980 1985 1990 1995 2000 340
360 380 400 420
Herfindahl−Hirschman Index
[image:42.595.139.478.262.525.2]Years HHI
1978 1980 1982 1984 1986 1988 1990 1992 1994 1996 1998 0.05
0.10 0.15 0.20 0.25 0.30 0.35
Share of State−Owned Plants in Total Production
[image:43.595.140.477.147.408.2]Years
Table 2: Groups, Companies, and Plants
Companies Integrated Plants Grinding Mills Total Oyak-Sabancı Group
Oyak 4 1 5
Sabancı + CBR 2 1 3 Sabancı Holding 1 1 2 Oyak + Sabancı (Oysa) 1 1 2
Oyak + GAMA 1 0 1
Rumeli Group
Rumeli 8 1 9
Yibitas-Lafarge Group
Yibita¸s - Lafarge 2 3 5
Lafarge 1 1 2
Yibita¸s 1 0 1
Set Group
Set 4 1 5
Others
Batı Anadolu 2 1 3 C¸ imenta¸s 2 1 3
Vicat 2 0 2
Nuh Holding 1 0 1
Limak Holding 1 0 1
G¨olta¸s 1 0 1
Eski¸sehir 1 0 1
Bursa 1 0 1
Denizli 1 0 1
Er¸cimsan 1 0 1
C¸ imko C¸ imento 1 0 1 ¨
Ozt¨ure Kire¸c 0 1 1
˙Ikon A.S. 0 1 1
Marmara 0 1 1
˙Ista¸s 0 1 1
Ado Madencilik 0 1 1 ¨
Ozg¨ur Beton 0 1 1
Table 3: Cost Items and Their Average Share
Cost Items Average Share in Unit Cost (%) Electricity 23.5
Fuel (Oil or Coal) 20.0
Labor 14.0
Packaging & Packaging Labor 11.5 Raw Materials 9.5
Total 78.5
[image:45.595.160.452.387.444.2]Source: State Planning Institute, Cement and Concrete Report
Table 4: Concentration Measures in the Turkish cement industry Concentration N Mean Std. Dev. Min. Max. CR4 25 0.25983 0.017955 0.23513 0.29558 CR8 25 0.4375 0.01682 0.40674 0.46992 HHI 25 376.7104 26.225578 328.63 424.06
[image:45.595.204.404.543.637.2]Table 6: Second Investigation and Fines in Dollars Plant Fines
Akcansa 770,772 Set 593,260 Adana 429,760 Cimsa 423,168 Yibitas-Lafarge 328,479 Bolu 298,272 Bursa 164,981 Bastas 136,748 Nigde 83,155 Iskenderun 73,433 Baticim 62,409 Nuh 54,996 Lafarge Aslan 31,719 Konya 24,289 Anadolu 18,516 Eskisehir 14,145 Afyon 11,775 Ado 7,013 Total 3,526,888
Table 7: Summary Statistics, 1986-2002 Annual Data Series N Mean Std. Dev. Min. Max.
Endogenous variables
Q 17 27.184 4.323 18.935 34.127 P 17 2.511 0.432 1.827 3.082
Exogenous variables
[image:46.595.190.423.494.648.2]Table 8: Four Different System Specifications
Coefficients Model 1 Model 2 Model 3 Model 4 Demand Equation
a0 29.55841a 29.75011a 29.66648a 29.85175a a1 -8.74186a -8.90474a -8.78243a -8.92043a a2 19.50005a 19.71653a 19.49387a 19.65452a
R2
0.8907 0.8911 0.8908 0.8911 ¯
R2
0.8794 0.8798 0.8795 0.8798
DW statistic 1.4752 1.4864 1.4751 1.4824 LM p-value 0.3046 0.3133 0.3067 0.3113 White 0.2545 0.2720 0.2571 0.2722
Supply Equation
b0 -3.33282a -0.64412 -4.26603b -1.11172 b1 0.388307a 0.314716a 0.470086a 0.361802a b2 0.545606a 0.321423a 0.625881a 0.361556b b3 0.455198b 0.212579 0.458549b 0.210154 b4 0.018327a 0.008348 0.02699b 0.013615 λ 0.401183b - -
-λ0 - 0.244125c 0.415295b 0.233402 λ1 - -0.01118c - -0.01087c λ2 - - 0.064412 0.037396
R2
0.9164 0.9587 0.9237 0.9615 ¯
R2
0.8727 0.9305 0.8715 0.9276
DW statistic 2.3184 2.3148 2.4859 2.2033 LM p-value 0.0032 0.1502 0.0013 0.3854 White 0.3856 0.3856 0.3856 0.3856
a: significant at 1% using a Wald test
b: significant at 5% using a Wald test
Table 9: Partial Derivatives
Partial Derivatives Model 1 Model 2 Model 3 Model 4 Demand Equation
∂Qt/∂Pt -8.74186 -8.90474 -8.78243 -8.92043
(<0.0001) (<0.0001) (<0.0001) (<0.0001)
∂Qt/∂T CEt 19.50005 19.71653 19.49387 19.65452
(<0.0001) (<0.0001) (<0.0001) (<0.0001)
Supply Equation
∂Pt/∂P Lt 0.38831 0.31472 0.47009 0.36180
(<0.0001) (<0.0001) (0.0001) (0.0004)
∂Pt/∂P Et 0.54561 0.32142 0.62588 0.35156
(<0.0001) (0.0047) (0.0003) (0.0147)
∂Pt/∂P Ct 0.45520 0.21258 0.45855 0.21015
(0.0220) (0.2226) (0.0273) (0.2446)
∂Pt/∂P Kt 0.01833 0.00835 0.02699 0.01362
(0.0008) (0.2368) (0.0104) (0.1997)
∂Pt/∂Qt 0.04589 0.01612 0.04988 0.01668
(0.0362) (0.7314) (0.0427) (0.6518)
Market Power Measures
Conduct Parameter 0.40118 0.14354 0.43803 0.14878
(0.0403) (0.7315) (0.0472) (0.6521)
Price-Cost Margin 1.24751 0.43819 1.35580 0.45338
(0.0362) (0.7333) (0.0427) (0.6518)
Lerner Index 0.49680 0.17450 0.53992 0.18055
(0.0362) (0.7333) (0.0427) (0.6518)