Gilligan, K.A. and Thomas, Michael S.C. and Farran, E.K. (2019) First
demonstration of effective spatial training for near-transfer to spatial
performance and far-transfer to a range of mathematics skills at 8 years.
Developmental Science , e12909. ISSN 1363-755x.
Downloaded from:
Usage Guidelines:
Please refer to usage guidelines at
or alternatively
Developmental Science. 2019;00:e12909.
|
1 of 18 https://doi.org/10.1111/desc.12909wileyonlinelibrary.com/journal/desc
1
|
INTRODUCTION
1.1
|
Rationale
This paper investigates the impact of spatial training on spatial skills that have been specifically trained (near transfer), non‐trained
spatial skills (intermediate transfer) and mathematics skills (far transfer). That spatial training interventions can improve math‐ ematical ability in children is supported by evidence that spatial ability is malleable, and that there are significant associations be‐ tween mathematics and spatial skills in childhood populations. In a meta‐analysis of 217 studies, Uttal et al. (2013) reported an effect Received: 30 August 2018
|
Revised: 21 August 2019|
Accepted: 23 September 2019DOI: 10.1111/desc.12909
S P E C I A L I S S U E A R T I C L E
First demonstration of effective spatial training for
near transfer to spatial performance and far transfer to a range
of mathematics skills at 8 years
Katie A. Gilligan
1,2|
Michael S. C. Thomas
3|
Emily K. Farran
1,2This is an open access article under the terms of the Creative Commons Attribution License, which permits use, distribution and reproduction in any medium, provided the original work is properly cited.
© 2019 The Authors. Developmental Science published by John Wiley & Sons Ltd 1School of Psychology, University of Surrey,
Guilford, UK
2Department of Psychology and Human Development, UCL Institute of Education, University College London, London, UK
3Department of Psychological
Sciences, Birkbeck, University of London, London, UK
Correspondence
Katie A. Gilligan, School of Psychology, University of Surrey, Guilford GU2 7XH, UK. Email: [email protected]
Funding information
Bloomsbury Colleges Ph.D. Scholarship Programme; Gorilla Award in Behavioural Science; National Centre for Curriculum and Assessment (NCCA)
Abstract
There is evidence that spatial thinking is malleable, and that spatial and mathemati‐ cal skills are associated (Mix et al. [2016] Journal of Experimental Psychology: General, 145, 1206; Mix et al. [2017] Journal of Cognition and Development, 18, 465; Uttal et al. [2013] Psychological Bulletin, 139, 352). However, few studies have investigated transfer of spatial training gains to mathematics outcomes in children, and no known studies have compared different modes of spatial instruction (explicit vs. implicit in‐ struction). Based on a sample of 250 participants, this study compared the effective‐ ness of explicit and implicit spatial instruction in eliciting near transfer (to the specific spatial skills trained), intermediate transfer (to untrained spatial skills) and far transfer (to mathematics domains) at age 8. Spatial scaling and mental rotation skills were chosen as training targets as previous studies have found, and proposed explana‐ tions for, associations between these skills and mathematics in children of this age (Journal of Experimental Psychology: General, 145, 2016 and 1206). In this study, spatial training led to near, intermediate and far transfer of gains. Mental visualization and proportional reasoning were proposed to explain far transfer from mental rotation and spatial scaling skills respectively. For most outcomes, except for geometry, there was no difference in the effectiveness of implicit (practice with feedback) compared to explicit instruction (instructional videos). From a theoretical perspective, the study identified a specific causal effect of spatial skills on mathematics skills in children. Practically, the results also highlight the potential of instructional videos as a method of introducing spatial thinking into the classroom.
K E Y W O R D S
size of almost one half a standard deviation for training stud‐ ies that compared spatial training to control conditions (Hedges
G = 0.47). The effect size increased to 0.61 (Hedges G) when the analysis was limited to studies of children under 13 years, demon‐ strating the particular malleability of spatial thinking in childhood (N = 53 studies). Note that similarly to Cohen's d, Hedges G values of 0.2, 0.5 and 0.8 correspond to small, medium and large effects respectively (Cohen, 1988). There is also convincing evidence that spatial and mathematical thinking are associated longitudinally in childhood. For example, spatial thinking measured using the Test of Spatial Assembly [TOSA]) at 3 years predicts 27% of the vari‐ ation in mathematics problem solving at 5 years (Verdine et al., 2014), and pattern construction skills at 5 years explain approxi‐ mately 9% of the variation in mathematics performance at 7 years (Gilligan, Flouri, & Farran, 2017).
However, the literature does not support a simple linear cou‐ pling between all aspects of spatial and mathematical cognition (Fias & Bonato, 2018). There is evidence that spatial‐mathemati‐ cal relations are specific to certain spatial and mathematics tasks and that these relations may differ across development. Gilligan, Hodgkiss, Thomas, and Farran (2018) measured the relationship between four different spatial sub‐domains and mathematics. They found that spatial scaling (or the ability to transform distance information from one representation to another representation of a different size; Frick & Newcombe, 2012) was the strongest spatial predictor of standardized mathematics performance in 6–10 year olds when compared to perspective taking, disembed‐ ding and mental rotation. Mental rotation had an age‐dependent role for 6–8 year olds only (Gilligan et al., 2018). Similar age‐de‐ pendent findings were reported by Mix et al. (2016, 2017) who found that mental rotation was a significant predictor of math‐ ematics performance at 6 and 9 years but not at 11 years. Frick (2019) also reported that, in comparison to other spatial skills (di‐ agrammatic representation, cross‐sectioning, mental transforma‐ tion and perspective taking), spatial scaling and mental rotation at 6.5 years explained at least 24% of the variation in mathematics performance at 8.5 years. This included both arithmetic items and items assessing numeric‐logical and spatial functions (e.g. number sequences, counting magnitudes, counting cubes, estimating line lengths; Frick, 2019). Taken together, the selection of spatial sub‐ domains for training studies should reflect the facts that (a) not all spatial skills are equally associated with all mathematics outcomes and (b) spatial‐mathematical associations are developmentally sensitive.
Mental rotation and spatial scaling were targeted for training in this study. As outlined, these skills have previously been asso‐ ciated with mathematics achievement in children aged 6–9 years. Furthermore, underlying cognitive mechanisms have been proposed that may explain associations between these spatial skills and math‐ ematics outcomes (e.g. Gilligan et al., 2018; Mix et al., 2016, 2017). These proposed underlying mechanisms influenced not only the selection of training targets, but also the selection of mathematics measures for inclusion in this study. Specifically, mental rotation is
proposed to elicit active processing, including mental visualization and manipulation of objects (Lourenco, Cheung, & Aulet, 2018; Mix et al., 2016). Thus, mental rotation training may have benefits for mathematics tasks requiring the mental manipulation or organiza‐ tion of numbers, for example, complex mathematical word problems or multidigit calculations (Lourenco et al., 2018). Missing term prob‐ lems were included in the task battery of this study as mathematics tasks of this type require mental manipulation of numbers. In con‐ trast, spatial scaling is proposed to elicit intensive quantification skills (proportional reasoning). Thus, spatial scaling training may im‐ prove performance on mathematics tasks that require proportional reasoning, for example, number line estimation and geometry per‐ formance (Newcombe, Levine, & Mix, 2015; Newcombe, Möhring, & Frick, 2018; Rouder & Geary, 2014). For this reason, both number line and Geometry Tasks were included in the task battery of this study.
This study included participants aged approximately 8 years. As outlined above, there is evidence of significant spatial‐mathematics relations at this age. Furthermore, as described in the next section, this age range overlapped with other spatial training studies that investigated transfer of gains to mathematics (Cheng & Mix, 2014; Hawes, Moss, Caswell, & Poliszczuk, 2015). Thus, the inclusion of participants aged 8 years allowed for meaningful comparisons be‐ tween this, and previous studies. Additionally, children of this age were deemed old enough for independent computer‐based training.
1.2
|
Evidence of transfer of spatial training gains to
mathematics
Spatial interventions that integrate spatial thinking into mathemati‐ cal instruction report gains in both spatial (near and intermediate transfer) and mathematical outcomes (far transfer; Hawes, Moss, Caswell, Naqvi, & MacKinnon, 2017; Lowrie, Logan, & Ramful, 2017). However, these studies cannot offer insight into the underly‐ ing causal relationship between spatial and mathematical domains, as it is not possible to disentangle the impact of the spatial, and
Research Highlights
• Both explicit instruction (instructional videos) and implicit instruction (task practice with feedback) elicited gains in spatial performance at 8 years.
• Training spatial skills led to near, intermediate and far transfer of gains, even after controlling for expectation and engagement effects.
• Mental visualization and proportional reasoning were proposed to explain far transfer from mental rotation and spatial scaling skills, to mathematics respectively. • The transfer of spatial training gains from spatial to math‐
mathematical aspects of training respectively. Few studies have investigated transfer of gains from spatial training (with no mathe‐ matical component) to mathematics. Cheng and Mix (2014) reported significant gains in mental rotation (near transfer) and mathematical calculation (far transfer) following 40‐min of mental rotation training in 6–8 year olds, compared to a control group. Gains were specific to missing term arithmetic problems, for example, 4 + __ = 9. In a similar mental rotation training study of 6–8 year olds, Hawes et al. (2015) failed to replicate these findings with respect to far transfer. Improvements in mental rotation (near transfer) and mental trans‐ formation (intermediate transfer) were reported for the training group who completed 15 sessions of computerized mental rotation training, compared to controls. However, no improvements in math‐ ematics skills including non‐verbal arithmetic or missing term arith‐ metic problems were found for either group (Hawes et al., 2015).
These differing results may be explained by several factors. First, Cheng and Mix (2014) delivered training in small groups (3–4 children) supervised by a researcher, while Hawes et al. (2015) ad‐ ministered classroom (group) training without direct supervision. Without the supervision of a researcher, reduced engagement with training may have contributed to the results of the Hawes et al. (2015) study. Second, post‐testing was delivered immediately following training by Cheng and Mix (2014), while Hawes et al. (2015) delivered post‐testing 1 week after training. Thus, caution must be taken in assuming that the gains reported by Cheng and Mix (2014) are durable. Third, the training method differed be‐ tween the two studies. Implicit instruction was used by Hawes et al. (2015). Points were awarded for correct trials, but no in‐ structions were given to explain correct (or incorrect) answers. In contrast, Cheng and Mix (2014) used explicit instruction, by giving participants physical manipulatives (mirroring those included in the onscreen trials) and instructing them to move the shapes to check their answers.
Differences in the training modes used in the above two stud‐ ies reflect a broader distinction between explicit and implicit in‐ struction types. In this study, implicit instruction is defined as instruction in which students are not aware of learning and use their experiences to construct an understanding. In contrast, for explicit instruction, the instructor plays a key role in explaining concepts to students and the student is aware of the skill or knowl‐ edge being taught. While there is mixed evidence regarding the effectiveness of explicit and implicit instruction in learning more generally (Kirschner, Sweller, & Clark, 2006), to our knowledge, no spatial training studies compare the efficacy of implicit and explicit instruction. Most studies of children have demonstrated the ef‐ fectiveness of spatial training using implicit training, for example where participants complete task practice with feedback (Uttal et al., 2013). Instructional videos are one tool that can be used to de‐ liver explicit instruction. There is evidence that viewing an instruc‐ tional video of successful task completion can improve subsequent performance in number line estimation and spatial cross‐section‐ ing in adults (Cohen & Hegarty, 2014; Gallagher‐Mitchell, Simms, & Litchfield, 2018). The success of instructional videos may be
attributable to observational learning (Castro‐Alonso, Ayres, & Paas, 2014; Paas & Sweller, 2012). In particular, for spatial think‐ ing, instructional videos may activate the mirror neuron system as individuals imagine movements (Rizzolatti & Sinigaglia, 2010; Tettamanti et al., 2005). From a practical perspective, instruc‐ tional videos could offer a novel, practical method of introducing spatial thinking into the classroom. To maximize the consistency of explicit instruction in this study, instructional videos were used. However, explicit instruction delivered by an individual, for exam‐ ple, a teacher or other expert, may have differing results and is not explored in this study.
Another factor that is not often considered in training studies, but that is controlled for in the current study, is the role of motivational fac‐ tors. First, expectation (placebo) effects occur when the expectation that training will be effective induces cognitive gains, independently from the training content (Green et al., 2019). The placebo effect is well documented in medical domains with some limited evidence that expectation effects play a role in cognitive psychology studies (Dweck, 2000; Foroughi, Monfort, Paczynski, McKnight, & Greenwood, 2016; Jaeggi, Buschkuehl, Shah, & Jonides, 2014). By controlling for expecta‐ tion effects, the causal inferences made in this cognitive training study are enhanced (Boot, Simons, Stothart, & Stutts, 2013). The degree to which participants engage with training is also proposed to impact training outcomes. For example, differences in participant engagement may explain the contrasting findings reported by Cheng and Mix (2014) and Hawes et al. (2015). In adult studies, those who show higher levels of engagement with cognitive training exhibit larger gains (Jaeggi et al., 2014). By controlling for participant engagement, the rigour of this study is substantially stronger, as it was possible to determine the ex‐ tent to which cognitive training gains are attributable to training, over and above differences in participant engagement.
1.3
|
Current study
This study compared explicit and implicit instruction methods as means of training spatial skills in children aged 8 years and explored transfer of spatial training gains to other spatial and mathematics domains. Explicit instruction was delivered using instructional vid‐ eos which were designed for use in this study. The choice of spatial scaling and mental rotation as spatial training targets was supported by both theoretical and behavioural evidence. The effectiveness of the intervention was assessed in the context of near, intermediate and far transfer of gains. A further original aspect of this study is that motivational factors including engagement with, and expectations of spatial training were controlled for.
2
|
METHODS
2.1
|
Participants
study (3 × 2 × 2 ANOVA). To achieve power of 0.8, with a medium effect size (f = 0.25), power analysis indicated that a minimum of 158 participants were required. As the study design included data collection at two‐time points, it was anticipated that there would be some participant drop‐off between Time 1 and Time 2. Therefore, the sample size was increased to account for possible attrition of the sample. Participants were 250 children from six primary schools across London, UK. All participants were in Year 3 (Mage = 8.09 years,
SD = 0.41 years). The overall proportion of males (48%) and females (52%) was approximately equal. Participant demographics across training groups are shown in Table 1.
2.2
|
Study design
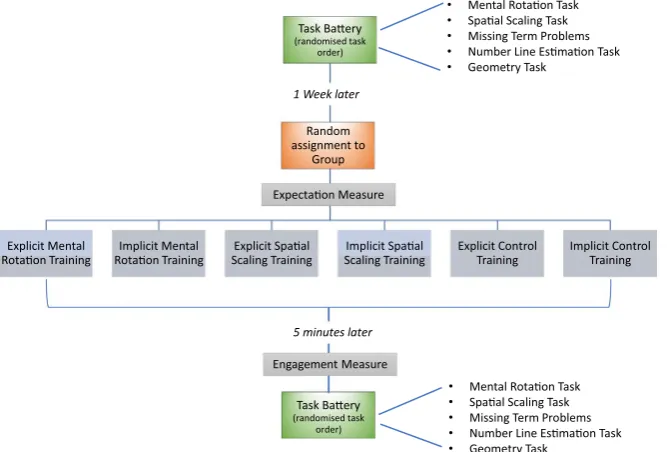
As shown in Figure 1, this study used a randomized, controlled, pre‐post training design. All participants completed an identical bat‐ tery of tasks 1‐week pre‐training ± 1 day (Time 1), and immediately (within 5 min) post‐training (Time 2). All tasks and training proce‐ dures were computer‐based and were delivered using Gorilla soft‐ ware (www.goril la.sc). Participants completed testing in their school IT suites in groups of 6–8 participants supervised by at least one (but typically two) researchers. All task instructions were incorporated into the Gorilla software and were presented to participants using earphones. Participants moved through the task battery at their
own pace. Data collection was completed over a 7‐month period (April–October).
2.3
|
Training procedures
Training groups differed by training mode (explicit vs. implicit) and training type (mental rotation vs. spatial scaling vs. control). For both implicit and explicit instruction, training lasted between 3 and 4 min. For implicit instruction, the length of training was dependent on participants' performance (i.e. the speed taken to complete the items). For some participants in the implicit instruction group, train‐ ing lasted up to 6 min.
This combination of two possible training modes and three possible training types led to six groups. Participants were ran‐ domly assigned to a group immediately preceding training (see Table 1). Allocation was completed using the balanced random‐ ization function on the Gorilla software. The total number of predicted participants was entered into the software before data collection (N = 240). As this study has six training groups, a ratio of 40:40:40:40:40:40 participants in each group was as‐ sumed. Assignment using balanced randomization in Gorilla is like a weighted dice roll. This means that the first participant to complete the study had a 40/240 chance of being assigned to each group. However, if for example participant 1 was assigned
Training type Training mode N Gender (% female) Age (mean ± SD)
Mental rotation Explicit 44 45.5 8.011 ± 0.438 Implicit 42 59.5 8.052 ± 0.306 Spatial scaling Explicit 41 51.2 8.151 ± 0.321 Implicit 43 48.8 8.047 ± 0.474 Control Explicit 41 53.7 7.942 ± 0.446 Implicit 39 51.3 8.344 ± 0.291
TA B L E 1 Demographic information across training groups
F I G U R E 1 Overview of the study design
Task Baery (randomised task
order)
Explicit Mental
Rotaon Training Rotaon Training Implicit Mental Scaling Training Explicit Spaal Scaling Training Implicit Spaal Explicit Control Training Implicit Control Training
(randomised task order) Random assignment to
Group
Task Baery 1 Week later
5 minutes later
• Mental Rotaon Task
• Spaal Scaling Task
• Missing Term Problems
• Number Line Esmaon Task
• Geometry Task
• Mental Rotaon Task
• Spaal Scaling Task
• Missing Term Problems
• Number Line Esmaon Task
• Geometry Task Engagement Measure
[image:5.595.47.381.503.729.2]to explicit mental rotation training, the second participant would have a 39/240 chance of being assigned to explicit mental rota‐ tion training and a 40/240 chance of being assigned to each of the other training groups. This randomization ensures approximately equal numbers of participants in each group. Any differences in group sizes are attributable to (a) data loss following group assign‐ ment; (b) additional participants being included in the study. Any additional participants (beyond the predicted 240) were assigned to groups using unbalanced randomization, that is, the probability that they were assigned to each group was 1/6 and was not depen‐ dent on the assignment of prior participants.
2.3.1
|
Explicit training
Three of the training groups viewed instructional videos that pro‐ vided explicit task instructions. Two groups watched videos with spatial content, while the control group watched a video on word reading. The videos were designed using Vyond (www.vyond.com). All non‐training content was uniform across videos, for example, the characters, storyline and narration. The videos can be accessed using the links provided below. Group 1 viewed the instructional mental rotation video. Participants in this group were given a de‐ scription and viewed eight examples of mental rotation (see Figure 2 for a screenshot). For more details go to https ://youtu.be/18iyR svt‐ GAQ. Group 2 viewed the instructional scaling video, in which a de‐ scription of spatial scaling, and eight examples of spatial scaling were shown (see Figure 3). For more details go to https ://youtu.be/grhxF Eqgz51. For Group 3, the control video was shown. Participants watched eight examples of word‐picture matching, in which the onscreen characters selected the correct picture to match a given word (see Figure 4). Participants allocated to this control group did not view any spatial‐related content. For more details go to https :// youtu.be/qDmgR R2RLyE.
2.3.2
|
Implicit training
The three implicit training groups completed task practice with computer‐based feedback. For each trial, participants were shown an onscreen tick or cross indicating the accuracy of their response.
For incorrect trials, participants were given the opportunity to re‐ peat the trial until they had selected the correct answer (all tasks had two possible response options). Participants were not given any explicit instruction on how to complete the trials. Participants moved to the next trial when the correct response was selected. For implicit training, two groups completed spatial tasks (the same tasks presented at Time 1), while a control group completed a word reading task. The number of trials included in implicit training was determined as the approximate number of trials that could be com‐ pleted in the same length of time as the explicit instruction. This was established through piloting. Group 4 completed implicit mental rotation training and were presented with 30 trials of the Mental Rotation Task with feedback (further details of this task are outlined below). Group 5 completed implicit scaling training comprising of 24 trials of the Spatial Scaling Task (further details of this task can be found below). Feedback was given for each trial. Group 6 completed implicit control training. These participants completed 30 trials of a Word‐Picture Matching Task in which they were asked to match a word to one of two pictures using labelled keys on the keyboard (see Figure 5). This was a reading task requiring minimal spatial skills. Feedback was provided.
F I G U R E 2 Screenshot taken from the instructional video of mental rotation (explicit instruction)
F I G U R E 3 Screenshot taken from the instructional video of spatial scaling (explicit instruction)
2.4
|
Task battery
The task battery included two spatial measures, assessing men‐ tal rotation and spatial scaling respectively. These measures were
included as potential targets of near transfer (spatial tasks trained on) and of intermediate transfer (untrained spatial tasks). Three mathematics measures were included in the task battery as poten‐ tial targets for far transfer (missing term problems, a Number Line Estimation Task and a Geometry Task). The order of task presen‐ tation was randomized across participants at both time points. To assess the role of motivational factors, two participant engagement measures were also administered.
2.4.1
|
Mental Rotation Task
In each trial of the Mental Rotation Task participants were required to identify which of two animal images located above a horizontal line matched the target image below the line. As shown in Figure 6, the images above the line included a mirror image of the target image, and a version of the target image rotated by a fixed degree from the target image. Participants used labelled keys on the computer key‐ board to respond. Trials were separated by a fixation dot displayed for 500 ms. The task stimuli were taken from Neuburger, Jansen, Heil, and Quaiser‐Pohl (2011). Participants completed four practice trials at 0° where feedback was provided. Only participants achiev‐ ing at least 50% in the practice trials continued to the 40 experimen‐ tal trials. No feedback was given for experimental trials at Time 1 or Time 2. The experimental trials included equal numbers of clockwise and anti‐clockwise rotations at 45°, 90° and 135° (eight trials for each degree of rotation), and eight trials at 180° and 0°. The order of trial presentation was randomized for each participant. Percentage accuracy was recorded.
2.4.2
|
Spatial Scaling Task
The Spatial Scaling Task was modified from Möhring, Newcombe, and Frick (2016). In each trial participants were shown two 2D im‐ ages of a circular space (a farmer's field) containing a target (an egg). Participants were asked to identify whether the eggs in the two fields were in the same position or in different positions (see Figure 7). For half of the trials, the targets were presented in the same position in both fields (match trials). For the remaining trials, the position of the F I G U R E 5 Sample trial from control training (implicit
instruction)
F I G U R E 6 Sample stimulus from the Mental Rotation Task (45° anti‐clockwise trial)
target in one field was adjusted by 2 cm (to the left or right) relative to the second field (mismatch trials). Participants responded using labelled keys on the computer keyboard. All trials were separated by a fixation dot displayed for 500 ms. Participants completed six practice trials during which feedback was given and no time limit was imposed. Only participants achieving at least 50% in the practice tri‐ als continued to the experimental trials. The 72 randomly experi‐ mental trials were presented randomly. Each trial was displayed for 5 s. No feedback was given for experimental trials at Time 1 or Time 2. Experimental trials differed by the location of the target on the horizontal axis, and by scaling factor. Six different target positions were included (a modification from the original study where 15 posi‐ tions were used). Scaling factor was manipulated by keeping the size of one space constant while manipulating the size of the second. In this way six scaling factors were included (1, 0.875, 0.75, 0.625, 0.5, 0.375). Performance was measured as percentage accuracy.
2.4.3
|
Missing term problems
The missing term problems included in this study were modified from Hawes et al. (2015). For each item participants were required to complete the missing number(s) in a simple mathematical equa‐ tion (see Figure 8). This task included two practice items where the solutions were shown after participants submitted an answer. Following this, 21 test items were displayed. No solutions were shown for these items. Test items included the original 18 items from Hawes et al. (2015) and three additional, low‐difficulty items that were added to the task after piloting to alleviate floor effects. Items were presented in order of increasing difficulty and a time limit of 25 s was allocated to each test item. Approximately equal numbers of addition versus subtraction items, and single versus multi‐digit numbers were included. The position of the missing box was also balanced across items. Performance accuracy was recorded.
2.4.4
|
Number Line Estimation Task
The Number Line Estimation Task was used to measure numeri‐ cal representations. The method was adapted from Siegler and Opfer (2003). As shown in Figure 9, for each item participants were presented with a target number and were asked to estimate
its location on a 0–100 number line by using the mouse cursor to click the number line at their selected location. For practice items (N = 2) solutions were shown onscreen after participants attempted an answer. No solutions were given for experimental items (N = 30). The target numbers included in the task were taken from Gallagher‐Mitchell, Romero‐Rivas, Rodriguez‐Cuadrado, and Dackermann, (2017). The order of experimental items was rand‐ omized. Performance was measured as percentage absolute error (PAE) and as logarithmic response patterns (R2
LOG; Simms, Clayton, Cragg, Gilmore, & Johnson, 2016). PAE is the numerical distance from a participant's answer to the correct answer, divided by the length of the number line. This measure reflects the accuracy of participants' estimates. For each participant, linear (R2
LIN) and logarithmic (R2
LOG) response patterns were also calculated using curve estimation. Curve estimation is based on the correlation be‐ tween participants' estimates and the target numbers. The prox‐ imity of R2
LIN and R2LOG scores to the value of 1 is an indicator of how well a participant's estimates reflect a linear or logarithmic pattern respectively.
2.4.5
|
Geometry Task
The Geometry Task was designed for this study based on the statu‐ tory geometry learning requirements for Year 2 students in the UK (Department of Education, 2013). The task included two item types, Shape Items and Symmetry Items. For Geometry Shape Items, par‐ ticipants were shown an image of a shape and were asked to select the correct number of sides (or faces) on the shape from four possi‐ ble response options (see Figure 10). Participants completed a single practice item using a 2‐D shape on which they were given feedback. All participants successfully completed this item. Geometry Shape
F I G U R E 8 Sample missing term problem
F I G U R E 9 Sample item from the Number Line Estimation Task
Items differed in the dimensionality of the images shown and in‐ cluded six 2‐D shapes and six 3‐D shapes. Performance was meas‐ ured as accuracy across all items.
For each Geometry Symmetry Item, a target shape was displayed on screen and participants were asked to select which of four possi‐ ble response options was the mirror image of the target shape (see Figure 11). Participants completed a single practice trial in which they received feedback. Ten experimental Symmetry Items were presented in a randomized order. For each item, the distractor images included a match error, a shape error and a symmetry error (see Figure 11). For match errors, the distractor was identical in both shape and position to the target shape (a). For shape errors, the distractor was in the correct position, however the shape was not a mirror of the target image, but another similar shape (b). Finally, for symmetry errors the distractor was the correct shape however the position of the distractor was not an accurate mirror image (c). Performance accuracy was recorded.
2.4.6
|
Expectations of the effectiveness of training
Prior to the delivery of training, all participants were asked a sin‐ gle question, measuring their expectations of the effectiveness of training, ‘We are going to be playing some games. How much do you think the games will help you with your maths?’. The question was
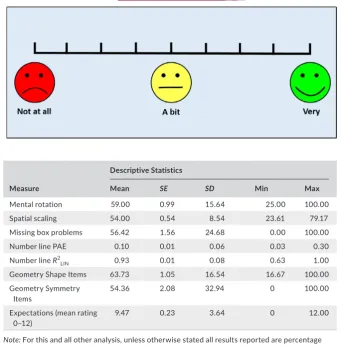
displayed alongside an onscreen scale (see Figure 12). Participants responded by selecting a point on the scale using the mouse cursor. Participant's responses were coded as 1–12 based on the onscreen position selected. A score of 1 was allocated for responses that indi‐ cated low expectations of training while a score of 12 was allocated for responses that indicated high expectations of training.
2.4.7
|
Participant Engagement Questionnaire
A participant engagement questionnaire was delivered to assess par‐ ticipant's enjoyment of and engagement with the training that they
F I G U R E 11 Sample Geometry Symmetry Item showing a match error (a), a shape error (b), a symmetry error (c) and the correct answer (d)
F I G U R E 1 2 Response scale for measuring expectations of the effectiveness of training
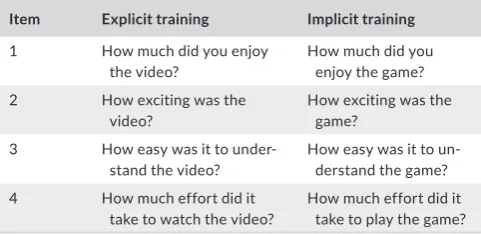
TA B L E 2 Items included in the Participant Engagement Questionnaire
Item Explicit training Implicit training
1 How much did you enjoy the video?
How much did you enjoy the game? 2 How exciting was the
video? How exciting was the game? 3 How easy was it to under‐
stand the video?
How easy was it to un‐ derstand the game? 4 How much effort did it
take to watch the video?
[image:9.595.309.550.615.732.2]had received. The questionnaire was designed for use in this study. As shown in Table 2, the questionnaire included four questions, the phrasing of which varied slightly based on the type of training deliv‐ ered. Each question was presented alongside an onscreen scale (for an example see Figure 13). Participants responded to each question by selecting a point on the scale using the mouse cursor. Participant's responses were coded as 1–12 based on the onscreen position se‐ lected. A score of 1 was allocated for responses that indicated low engagement while a score of 12 was allocated for responses that indicated high engagement. Participants were awarded an overall engagement score, an average of their scores across all four ques‐ tions (where necessary items were reverse coded).
2.5
|
Exclusion criteria
Due to technical errors and school disruptions, data for a single task was lost for nine participants at Time 1 and 15 participants at Time 2. These participants were excluded from training analysis for the task on which they were missing data. Furthermore, par‐ ticipants scoring higher than 95% on a given task at Time 1, were deemed to have reached “ceiling level” performance on the task and were excluded from training analysis for that task only. For missing term problems and Number Line Estimation, responses were open ended. For missing term problems, participants who did
not score higher than 10% at Time 1, were not deemed to under‐ stand the task aims and were excluded (n = 14). For Number Line Estimation participants who didn't attempt at least 75% of items, or participants with a mean PAE score higher than 15% for prac‐ tice items were also excluded (n = 0). Parametric analyses were used as all groups were large enough (N > 30) for the central limit theorem to apply (Field, 2013).
3
|
RESULTS
3.1
|
Performance at Time 1
3.1.1
|
Overall performance at Time 1
No ceiling or floor effects were present for any measures (Table 3). Descriptive information for performance on each of the tasks, across groups is shown in Table 6. For the Geometry Task, the results of a dependent t test indicated a significant difference in performance between Geometry Shape Items (63.73 ± 1.05) and Geometry Symmetry Items (54.36 ± 2.08), t(1, 249) = 4.34,
p < .001, d = 0.295. Furthermore, while a Pearson's correlation indicated a significant association between the different item types, r(248) = .178, p = .005, the correlation was small to medium in size, that is, between .1 and .3 (Field, 2013). Hence, Geometry F I G U R E 1 3 Sample scale from the
Participant Engagement Questionnaire
Measure
Descriptive Statistics
Mean SE SD Min Max
Mental rotation 59.00 0.99 15.64 25.00 100.00 Spatial scaling 54.00 0.54 8.54 23.61 79.17 Missing box problems 56.42 1.56 24.68 0.00 100.00 Number line PAE 0.10 0.01 0.06 0.03 0.30 Number line R2
LIN 0.93 0.01 0.08 0.63 1.00
Geometry Shape Items 63.73 1.05 16.54 16.67 100.00 Geometry Symmetry
Items
54.36 2.08 32.94 0 100.00
Expectations (mean rating 0–12)
9.47 0.23 3.64 0 12.00
Note: For this and all other analysis, unless otherwise stated all results reported are percentage correct scores.
[image:10.595.211.552.43.390.2]Symmetry Items and Geometry Shape Items are considered sepa‐ rately throughout. For Number Line Estimation, 74% of partici‐ pants had estimates that were best described by a linear (compared to a logarithmic) response pattern.
3.1.2
|
Gender differences in task performance at
Time 1
Independent T tests (controlling for multiple comparisons [0.05/8 = 0.006]) were used to explore gender differences in per‐ formance at Time 1. Where homogeneity of variance could not be assumed, the results for unequal variances were reported. As shown in Table 4, males had significantly lower error scores on the Number Line Estimation Task compared to females, t(148) = 3.15, p = .002,
d = 0.401. No other significant gender differences were reported (ps > .05, ds < 0.261). Thus, gender was included as a control vari‐ able when investigating the effects of training on the Number Line Estimation Task only.
3.1.3
|
Differences in task performance across
training groups at Time 1
To confirm that there were no performance differences between groups at Time 1, a two‐way ANOVA was completed for each task. Training mode (2 levels: explicit vs. implicit) and training type (3 lev‐ els: mental rotation vs. spatial scaling vs. reading) were included as between participant variables. Comparing across training types and training modes, no significant differences in performance were re‐ ported for any of the mathematics or spatial tasks (p > .05, 𝜂2
p < 0.010; see Table 6). Similarly, there were no differences in expectations of training across training modes, F(1, 244) = 3.25, p = .072, 𝜂2
p = 0.013, or training types, F(2, 244) = 0.27, p = .763, 𝜂p2 = 0.002.
3.1.4
|
Associations between measures at Time 1
Pearson correlations were completed between measures at Time 1. This allowed for the investigation of whether the observed TA B L E 4 Gender differences in task performance at Time 1
Test measure
Gender Statistics
Male (n = 121) Female (n = 129)
Test statistic (t) Effect size (d)
Mean SD Mean SD
Mental rotation 60.382 16.053 57.761 15.194 0.742 0.094 Spatial scaling 54.764 7.533 53.284 9.359 1.372 0.174 Missing term problems 59.708 24.573 53.341 24.471 2.052 0.261 Number line estimation R2
LIN 0.093 0.051 0.115 0.062 1.435 0.182
Number line estimation PAE 0.938 0.073 0.924 0.084 3.154* 0.401
Geometry Shape Items 62.810 15.592 64.596 17.390 0.853 0.108 Geometry Symmetry Items 53.554 33.834 55.116 32.189 0.374 0.047 Expectations 9.126 3.864 9.791 3.390 1.449 0.184 *p < .05.
TA B L E 5 Bivariate correlations between tasks at Time 1
Spatial tasks Mathematics tasks Expectations
1 2 3 4 5 6 7 8
1. Mental rotation — 0.275*** 0.293*** −0.213*** 0.247*** 0.092 0.227*** 0.057 2. Spatial scaling — 0.345*** −0.304*** 0.333*** 0.160* 0.258*** 0.037 3. Missing box
problems
— −0.492*** 0.531*** 0.303*** 0.421*** −0.021
4. Number line PAE — −0.825*** −0.254*** −0.327*** 0.014 5. Number line R2
LIN — 0.223*** 0.305*** −0.023
6. Geometry Shape Items
— 0.178*** 0.013
7. Geometry
Symmetry Items — −0.032
8. Expectations —
T A B LE 6 Pe rf or m an ce a t T im e 1 an d Ti m e 2 ac ro ss g ro up s Tr ainin g ty pe Mo de M en ta l r ot at io n p er ce nt c or re ct Sp at ia l s ca lin g p er ce nt c or re ct M is si ng t er m p ro bl em s p er ce nt c or re ct Ti m e 1 Ti m e 2 Ti m e 1 Ti m e 2 Ti m e 1 Ti m e 2 Men ta l r ot at io n Ex pl ic it 56 .9 04 ± 1 5. 28 7 65 .2 62 ± 1 7. 91 6 54 .0 40 ± 8 .1 53 55 .2 40 ± 9 .2 70 59 .1 81 ± 2 2. 15 2 66 .7 95 ± 2 2.7 96 Im pl ic it 54 .4 21 ± 1 2. 61 6 64 .6 34 ± 1 7. 55 9 52 .9 66 ± 7 .0 45 51 .4 64 ± 8 .6 30 52 .0 92 ± 2 1. 127 55 .4 11 ± 25 .3 33 Sp at ial s cal ing Ex pl ic it 58 .2 32 ± 1 5. 59 0 64 .1 41 ± 1 8. 44 8 55 .0 15 ± 8 .3 48 59 .5 68 ± 9 .4 24 59 .8 67 ± 1 9.8 54 58 .6 87 ± 2 4. 61 7 Im pl ic it 61 .6 98 ± 1 4. 77 5 61 .5 39 ± 1 7. 60 7 55 .3 86 ± 8 .9 21 59 .0 79 ± 9 .8 02 59 .7 74 ± 1 9. 76 4 55 .8 90 ± 2 3. 02 9 C ont ro l Ex pl ic it 60 .7 03 ± 1 5. 47 4 60 .3 91 ± 1 7. 96 4 54 .2 68 ± 9 .3 09 53 .2 86 ± 8 .8 32 58 .3 77 ± 2 4. 47 3 58 .2 01 ± 2 4. 91 6 Im pl ic it 60 .657 ± 1 6. 74 8 61 .61 9 ± 16 .2 84 51 .8 16 ± 9 .7 02 51 .1 75 ± 9 .3 20 60 .78 4 ± 19 .3 36 57 .8 43 ± 2 2. 55 4 Tr ainin g ty pe Mo de N um be r l in e R 2 LI N N um be r l in e P A E G eo m et ry Sh ap e I te m s a cc ur ac y Ti m e 1 Ti m e 2 Ti m e 1 Ti m e 2 Ti m e 1 Ti m e 2 Men ta l r ot at io n Ex pl ic it 0. 93 9 ± 0.0 80 0. 91 7 ± 0. 10 2 0.0 92 ± 0.0 51 0. 11 1 ± 0.0 69 61 .5 85 ± 1 5. 79 7 62 .6 02 ± 2 0. 927 Im pl ic it 0. 92 5 ± 0.0 80 0. 90 8 ± 0.0 88 0. 10 8 ± 0.0 59 0. 11 6 ± 0.0 66 62 .2 81 ± 1 5. 46 8 71 .2 72 ± 1 8. 24 7 Sp at ial s cal ing Ex pl ic it 0. 91 7 ± 0.0 98 0. 92 3 ± 0.0 82 0. 11 5 ± 0.0 65 0. 10 6 ± 0.0 59 59 .55 3 ± 15 .3 16 64 .4 31 ± 1 5. 59 3 Im pl ic it 0. 94 1 ± 0.0 73 0. 93 6 ± 0.0 64 0. 10 4 ± 0.0 65 0.0 92 ± 0.0 48 67 .9 06 ± 1 3.9 23 73 .2 46 ± 1 7. 23 8 C ont ro l Ex pl ic it 0. 92 3 ± 0.0 75 0. 89 1 ± 0. 12 6 0. 11 2 ± 0.0 62 0. 15 2 ± 0.0 95 61 .8 16 ± 1 5. 94 0 58 .7 61 ± 1 9. 11 3 Im pl ic it 0. 93 7 ± 0. 072 0. 89 6 ± 0. 12 4 0. 10 5 ± 0.0 56 0. 11 9 ± 0.0 65 59 .4 60 ± 1 3. 48 9 61 .7 11 ± 1 4. 361 Tr ainin g ty pe Mo de G eo m et ry S ym m et ry I te m s a cc ur ac y Ti m e 1 Ti m e 2 Men ta l r ot at io n Ex pl ic it 52 .6 83 ± 3 1. 86 1 64 .8 78 ± 2 8. 11 8 Im pl ic it 48 .6 84 ± 2 7. 42 8 62 .8 95 ± 3 0. 395 Sp at ial s cal ing Ex pl ic it 43 .1 56 ± 3 2. 29 2 62 .6 32 ± 3 4. 77 2 Im pl ic it 53 .8 89 ± 3 0. 91 7 63 .8 89 ± 2 9. 49 8 C ont ro l Ex pl ic it 43 .5 14 ± 3 4. 818 54 .3 24 ± 3 5. 16 2 Im pl ic it 63 .3 33 ± 2 8. 98 3 68 .8 89 ± 2 6. 70 2 A bb re vi at io ns : P A E, p er ce nt ag e ab so lu te e rr or , R
2 LIN
associations between spatial and mathematics skills that have been demonstrated in previous studies (e.g. Gilligan et al., 2018; Mix et al., 2016) and form the rationale for the training paradigm used in this study, were present. As shown in Table 5, significant correla‐ tions were reported between all tasks, except for performance on Geometry Shape Items which was not correlated with mental ro‐ tation accuracy, r(248) = 0.09, p = .147. Expectations of the effec‐ tiveness of training were not correlated with performance on any behavioural measures.
3.2
|
Performance at Time 2
Mixed ANOVAs were used to investigate training effects across near, intermediate, and far transfer measures (see Table 6 for a summary of performance scores across Time 1 and Time 2). Time was included as a within participant variable (Time 1 and Time 2). Training mode (explicit vs. implicit) and training type (mental rotation vs. spatial scaling vs. control) were included as between participant variables. Where sphericity could not be assumed, Greenhouse‐Geisser values were reported. It is noteworthy that ANCOVAs with Time 2 scores as the dependent variable and Time 1 scores as a covariate were run in parallel to these analyses. Comparable results were reported for all outcomes. Further de‐ tails, including comparisons between training types at Time 2, can be found in the Supporting Information.
3.2.1
|
Near and intermediate transfer of gains
Mental rotation
A significant main effect of time was reported, with higher per‐ formance at Time 2, F(1, 237) = 21.87, p < .001, 𝜂2
p = 0.084. A sig‐ nificant interaction was found between time and training type, F(2, 237) = 6.88, p < .001, 𝜂2
p = 0.055. As shown in Figure 14, paired sample t tests indicated a significant improvement in performance accuracy following mental rotation training, t(83) = 5.49, p < .001,
d = 0.581 (near transfer) and spatial scaling training, t(79) = 2.30,
p = .024, d = 0.263 (intermediate transfer). No significant improve‐ ment in performance accuracy was reported following control
training, t(78) = 0.21, p = .837, d = 0.019. No other main effects or interactions with time were reported (ps > .05, 𝜂2
ps < 0.005).
Spatial scaling
A significant main effect of training type was found, with higher per‐ formance for spatial scaling training compared to the other training types, F(2, 232) = 8.28, p < .001, 𝜂p2 = 0.067. There was also a sig‐
nificant interaction reported between time and training type, F(2, 232) = 6.25, p = .002, 𝜂2p = 0.051 (see Figure 15). Paired sample t
tests indicated significant performance gains following spatial scal‐ ing training only, t(76) = 3.99, p < .001, d = 0.450 (near transfer). No significant gains were reported following mental rotation training,
t(80) = 0.04, p = .972, d = 0.004, or control training, t(79) = 0.70,
p = .485, d = 0.088. There were no other main effects or significant interactions with time (ps > .05, 𝜂p2s< 0.005).
3.2.2
|
Far transfer of gains
Missing term problems
A significant interaction between time and training type was found, F(2, 209) = 4.58, p = .011, 𝜂2
p = 0.042 (see Figure 16). Paired sample t tests indicated a significant improvement in accuracy following mental rotation training only, t(69) = 2.73, p = .008,
d = 0.241 (far transfer). No significant improvements were re‐ ported following spatial scaling training, t(74) = 1.30, p = .197,
d = 0.117, or control training, t(69) = 0.73, p = .466, d = 0.067. There were no other significant main effects or interactions with time (ps > .05, 𝜂2ps< 0.009).
Number Line Estimation
As a significant gender effect was reported for PAE scores on this task at Time 1, gender was included as a between participant vari‐ able. However, no significant main effect or interactions with gender were reported for this task (ps > .05, 𝜂2ps< 0.014). Hence, gender was
removed, and the analysis was repeated. A significant main effect of time was reported, F(1, 237) = 5.86, p = .016, 𝜂2p = 0.024. There
was also a significant interaction between time and training type.
F I G U R E 14 Mental rotation accuracy at Time 1 and Time 2 for different training types (*p < .05, **p < .01, ***p < .001)
***
0 10 20 30 40 50 60 70 80
Mental Rotaon Spaal Scaling Control
noi
tat
oR
lat
ne
Mt
cer
ro
Ct
ne
cr
eP
(Mean
±S
E)
Training Type
Time 1 Time 2
*
n= 84 n = 80 n =79
***
F I G U R E 1 5 Spatial scaling accuracy at Time 1 and Time 2 for different training types (*p < .05, **p < .01, ***p < .001)
0 10 20 30 40 50 60 70
Mental Rotaon Spaal Scaling Control
Percent Correct Spaal Scaling
(Mean
±S
E)
Training Type
Time 1 Time 2
***
As shown in Figure 17, there was a significant interaction between time and training type for PAE scores, F(2, 237) = 6.05, p = .002,
𝜂p2 = 0.054. Paired sample t tests indicated a significant reduction in
error following spatial scaling training, t(79) = 2.12, p = .037, d = 0.236 (far transfer). No significant difference in error was found following mental rotation training, t(82) = 1.91, p = .060, d = 0.209. However, a significant increase in error was reported following control training,
t(79) = 3.01, p = .003, d = 0.330. No other main effects or significant interactions with time were reported (ps > .05, 𝜂p2s < 0.005). Similar
analysis was completed for R2
LIN performance. The patterns of per‐ formance across time and training type were comparable to PAE scores. Further information is available on request.
Geometry performance
For Geometry Shape Items there were main effects of time, F(1, 219) = 12.93, p < .001, 𝜂p2 = 0.056, training mode, F(1, 219) = 6.39, p = .012, 𝜂p2 = 0.028, and training type, F(2, 219) = 3.25, p = .041,
𝜂p2 = 0.029. There was also a significant interaction between time
and training type for Geometry Shape Items, F(2, 219) = 3.82,
p = .022, 𝜂p2 = 0.034 (see Figure 18). Paired sample t tests, indi‐
cated significant gains in performance accuracy following mental rotation training, t(75) = 2.93, p = .004, d = 0.308 (far transfer),
and spatial scaling training, t(75) = 3.70 p < .001, d = 0.314 (far transfer). There were no significant gains following control train‐ ing, t(72) = 0.21, p = .833, d = 0.024. There was also a significant interaction between time and training mode for Geometry Shape Items, F(1, 219) = 5.95, p = .016, 𝜂2
p = 0.026 (see Figure 19). There was a significant improvement in performance following implicit training, t(104) = 4.41, p < .001, d = 0.351, but not explicit training,
t(116) = 0.85, p = .395, d = 0.069. No significant three‐way interac‐ tion between time, training mode and training type was reported
F(2, 219) = 1.60, p = .204, 𝜂2p = 0.014. For Geometry Symmetry
Items, all groups had improved performance between Time 1 and Time 2, F(1, 213) = 40.30, p < .001, 𝜂2p = 0.159. However, there
were no other main effects or significant interactions with time (ps > .05, 𝜂2ps< 0.013).
3.2.3
|
Motivational factors
Expectations of training
An ANOVA was completed with training mode and training type as between participant variables and expectations of training as the dependent variable. There were no significant differences in self‐reported expectations of training across training modes, F(1, 244) = 3.25, p = .072, 𝜂2
p = 0.013, or training types, F(2, 244) = 0.27,
p = .763, 𝜂2p = 0.002. ANCOVAs were also used to explore whether in‐
dividual participant gains on each outcome measure were predicted F I G U R E 16 Percentage correct on missing term problems at
Time 1 and Time 2 for different training types (*p < .05, **p < .01, ***p < .001)
0 10 20 30 40 50 60 70
Mental Rotaon Spaal Scaling Control
Percent Correct Missing
Term
Problems (Mean
±S
E)
Training Type
Time 1 Time 2
**
n= 70 n = 75 n =70
F I G U R E 17 Percentage absolute error (PAE) on the Number Line Estimation Task at Time 1 and Time 2 for different training types (*p < .05, **p < .01, ***p < .001)
0.00 2.00 4.00 6.00 8.00 10.00 12.00 14.00 16.00
Mental Rotation Spatial Scaling Control
noi
ta
mit
sE
eni
Lr
eb
mu
n
EA
P
(Mean
±S
E)
Training Type
Time 1 Time 2
* **
n = 83 n = 80 n = 80
F I G U R E 1 8 Accuracy on Geometry Shape Items at Time 1 and Time 2 for different training types (*p < .05, **p < .01, ***p < .001)
0 10 20 30 40 50 60 70 80
Mental Rotaon Spaal Scaling Control
s
met
I
ep
ah
S
yrt
e
mo
eG
tc
err
oC
tn
ecr
eP
(Mean
±S
E)
Training Type
Time 1 Time 2
*** **
n= 76 n = 76 n =73
F I G U R E 19 Accuracy on Geometry Shape Items at Time 1 and Time 2 for different training modes (*p < .05, **p < .01, ***p < .001)
0 10 20 30 40 50 60 70 80
Explicit Training Implicit Training
s
met
I
ep
ah
S
yrt
e
mo
eG
rc
err
oC
tn
ecr
eP
(Mean ±
SE)
Training Mode
Time 1 Time 2
***
by expectations of training. A separate ANCOVA was completed for each training type group (mental rotation, spatial scaling and con‐ trol) and each training mode group (explicit and implicit). Time was included as a between participant variable and expectation score was included as a covariate. There were no significant interactions between participant expectations of training and time for any of the training types (ps > .05, 𝜂2ps< 0.033) or any of the training modes
(ps > .05, 𝜂2
ps< 0.012).
Participant engagement with training
An ANOVA was completed with training type and training mode as between participant variables and self‐reported engagement levels as the dependent variable. There was a significant difference in en‐ gagement across training types, F(2, 244) = 3.37, p = .036, 𝜂2
p = 0.027. Bonferroni pairwise comparisons indicated significantly higher en‐ gagement levels following control training compared to spatial scal‐ ing training (p = .034). There was no main effect of training mode on engagement, F(1, 244) = 1.81, p = .180, 𝜂2
p = 0.007. However, there was a significant interaction between training type and training mode on engagement, F(2, 244) = 3.30, p = .039, 𝜂2
p = 0.026. For ex‐ plicit training there were no differences in engagement across train‐ ing types, F(2, 123) = 0.56, p = .573, 𝜂2
p = 0.009. For implicit training there was an effect of training type, F(2, 121) = 5.42, p = .006,
𝜂2
p = 0.082. As highlighted in Figure 20, post‐hoc Bonferroni tests indicated significantly higher engagement following control training compared to spatial scaling training (p = .004).
4
|
DISCUSSION
The results reported support and extend previous correlational find‐ ings on spatial‐mathematical relations and provide insight into the causal relationships between different aspects of spatial and math‐ ematical thinking. It was demonstrated that training mental rotation and, for the first time, training spatial scaling, led to gains in spatial and mathematical thinking at 8 years. These gains were present fol‐ lowing explicit and implicit instruction. Spatial training gains had near, intermediate and far transfer effects. Spatial thinking is therefore one cognitive domain in which transfer of cognitive training gains is
possible. The gains reported reflect the importance of choosing de‐ velopmentally sensitive, theoretically motivated training targets.
Near transfer: Mental rotation and spatial scaling training led to significant gains in mental rotation, and spatial scaling respectively. Findings which are consistent with previous evidence that spatial skills are malleable in children (Uttal et al., 2013). Previous studies typically investigated the malleability of mental rotation or other spatial tasks that elicit mental visualization (Uttal et al., 2013) while this is the first study to highlight the malleability of spatial scaling in children at 8 years.
Intermediate transfer: Significant gains in mental rotation were reported following spatial scaling training providing evidence of in‐ termediate transfer of spatial scaling training to an untrained spatial task. These findings are consistent with those of Uttal et al. (2013) who found that spatial training transferred to other untrained spatial tasks. However, Uttal et al. (2013) reported that intermediate trans‐ fer was not evident in all studies and was more likely to occur where longer training sessions were included. The short training sessions used in this study (3–5 min) may explain why no intermediate trans‐ fer was reported following mental rotation training.
Far transfer: Participants who completed mental rotation training had significant accuracy gains on missing term problems. The findings of far transfer of gains are consistent with the findings of Cheng and Mix (2014) who demonstrated that explicit mental rotation training led to gains in performance accuracy on a similar missing box task. Cheng and Mix (2014), proposed that these findings are due to the fact that children solve arithmetic problems of this type by mentally rotating the terms, thus restructuring the equation in a more proto‐ typical format. For example, 4 + __ = 9, can be mentally rotated to generate the equation __ = 9 − 4. However, this mental manipula‐ tion would require a relatively advanced understanding of calculation rules, that is, a plus becomes a minus when it is moved across the equals sign. Alternatively, children may use spatial visualizations to represent these equations pictorially. This equation could be solved by visualizing 4 blocks in one group and 9 blocks in another, and counting the difference between the groups (Lourenco et al., 2018). It is noteworthy that this study found no significant difference between explicit and implicit instruction on this task in contrast to Hawes et al. (2015) who did not find gains on missing term problems following implicit mental rotation training. This highlights other factors, such as participant engagement during training, as possible explanations for the results reported by Hawes et al. (2015). Another explanation for the differences reported between studies is that in this study and in Cheng and Mix (2014), a part‐whole type mental rotation training was used (participants had to rotate an object and combine it with another object or picture to create a whole) which may have acted as an analog for children when solving missing term problems.
For the Number Line Estimation Task, a significant reduction in error was reported for children who completed spatial scaling train‐ ing. This far transfer of gains from spatial scaling to number line estimation may be explained by the fact that both tasks require pro‐ portional reasoning. If a child was asked to place the number 27 on a number line ranging from 0 to 100, they might reason that 27 is F I G U R E 2 0 Self‐reported levels of engagement following
training, across training modes and training types (*p < .05, **p < .01, ***p < .001)
0 2 4 6 8 10 12
Explicit Implicit
Enagagement Rang from 0-1
2
(Mean
±S
E)
Training Type
Mental Rotaon Spaal Scaling Control
**
close to 25, which is one quarter of 100. By accurately dividing the number line into quarters, a child could place the number 27 with rel‐ atively high accuracy (Newcombe et al., 2015, 2018; Rouder & Geary, 2014). Proportional reasoning is also required when comparing two spaces of different sizes (Newcombe et al., 2018). Alternatively, the Mental Number Line may be responsible for associations between spatial scaling and number line estimation. This concept outlines that numbers are represented spatially in the brain with smaller numbers on the left and larger numbers on the right (Barsalou, 2008; Lakoff & Núñez, 2000). Children may scale between a mental number line and the number line presented in Number Line Estimation Tasks (see Dehaene, 1997; Fischer, 2003). Whilst spatial scaling has been associ‐ ated with number line estimation in a number of studies (e.g. Gilligan et al., 2018; Mix et al., 2016), this is the first to show that spatial scaling training leads to improvements in number line estimation. To note, an unexpected increase in error was reported following control training. This may be attributable to fatigue or boredom with the task at Time 2. Further investigation is needed to understand this effect.
Performance on the Geometry Task differed across item types. Gains on Geometry Symmetry Items were reported across time, but no effects of training mode or training type were found. Thus, effects in the experimental training conditions did not differ from those in the control conditions. This suggests significant practice ef‐ fects for this task. In contrast, there was far transfer of training gains from both mental rotation and spatial scaling, to Geometry Shape Items. From a theoretical perspective, children might use spatial vi‐ sualization (also used in Mental Rotation Tasks) to picture and rotate the shapes presented to count the number of sides (faces) on the shape. Improved spatial scaling skills may have enabled participants to better use proportional reasoning to answer shape items. Instead of counting each individual side (face), participants may have first, segmented the shapes presented (all of which were symmetrical) into halves or thirds, then counted the sides (faces) in a single seg‐ ment, and finally multiplied this to account for all segments.
Explicit versus implicit instruction: For Geometry Shape Items there was a main effect of training mode. Gains were reported fol‐ lowing implicit but not explicit instruction. For this task participants were asked to count the number of sides (faces) on a shape. Errors can easily be made on this task by counting the same side (face) twice or by forgetting where on the shape you started counting. As implicit training required participants to carefully select responses and revise incorrect responses, this may have increased the likeli‐ hood of participants going back over answers on the Geometry Task, which may in turn have increased accuracy.
For all other measures, there were no main or interaction effects reported for training mode (explicit vs. implicit instruction). This sug‐ gests that explicit and implicit spatial instruction are largely similar in eliciting near, intermediate and far transfer of gains. As outlined in the introduction, the efficacy of explicit instruction in this study, maybe be due to the fact that the instructional videos used pro‐ vide a model of successful task performance, allowing children to acquire new task strategies through observational learning. For im‐ plicit instruction, the results of this study suggests that practice with
feedback also leads to performance gains. However, here we pro‐ pose that feedback is a key element of this training type. It may be argued that participants in the control groups in this study completed task practice on account of their completion of the Time 1 task bat‐ tery. However, these participants did not have significant gains on any measures. This suggests that task practice alone is insufficient to elicit gains, and that the feedback provided in implicit instruction is a key component driving the effectiveness of this training. Taken together, the findings that both explicit and implicit instruction elicit similar gains have practical importance in the classroom. The deliv‐ ery of instructional videos in a group context offers an easily imple‐ mentable method of improving spatial thinking that does not require one‐to‐one student interaction or advanced IT facilities (such as a laptop for every student). This mode of instruction offers a feasible, cost‐effective way of spatializing the primary school classroom.
4.1
|
Motivational factors
This study is the first to explore the efficacy of spatial training while controlling for motivational factors. Here we demonstrated that nei‐ ther participant expectations of, nor engagement with, training can ex‐ plain the gains reported following spatial training. First, there were no significant differences in participants' expectations of training across different training modes or training types. The similarities in expecta‐ tions show that differences in expectations of training cannot explain the performance gains reported following training. This increases the reliability of the causal inferences made (Boot et al., 2013). Second, the performance gains reported following training cannot be attributed to engagement with training alone. For explicit training, there were no differences in reported engagement levels between training types. For implicit training, there was significantly higher engagement for participants in the control group compared to those who completed spatial scaling training. Participants who received implicit spatial scal‐ ing instruction completed additional trials of the Spatial Scaling Task that they had previously completed at Time 1. However, for the con‐ trol group the reading task completed was new, that is, not completed at Time 1, and therefore may have been more engaging. Although a significant difference in engagement was found for implicit instruc‐ tion, the direction of the difference shows that the performance gains reported for spatial and mathematics skills persisted despite the fact that control training may have been more engaging. Taken together, as control training did not lead to gains on any of the outcome measures, levels of engagement did not superficially align with training effects.