COMMISSIONS 27 AND 42 OF THE IAU INFORMATION BULLETIN ON VARIABLE STARS
Number 6120
Konkoly Observatory Budapest
10 November 2014
HU ISSN 0374 – 0676
ANOTHER COMPONENT IN THE V523 CASSIOPEIAE
ECLIPSING BINARY SYSTEM
CASTELAZ, M. W.1,2
1Brevard College, One Brevard College Drive, Brevard, NC USA 28712, e-mail: [email protected] 2Pisgah Astronomical Research Institute, One PARI Drive, Rosman, NC 28772
V523 Cassiopeiae is a W UMa type eclipsing binary. Samec et al. (2004) used 160,000 orbits measured over a period of 102 years for a comprehensive period study. Their O–C diagram strongly suggests a sinusoidal term which is indicative of a third star in the binary system. According to Samec et al. (2004), if a third star were present, it would be about 0.41 solar masses with a period of 101 ± 5 years. However, the difference in the O–C curve calculated from linear light elements and from light elements that include the sinusoidal term could not be clearly distinguished in their O–C diagram. Extrapolating the Samec et al. (2004) linear and sinusoidal ephemerides from 2004 to 2013 shows that a departure from their O–C curves will begin in 2013, after 40,000 orbits since 2004, if a third component exists. We set out to observe the V523 Cas light curve through many orbits in 2012 and 2013 and calculated the O–C diagram through 2013. If a third component is present, it should be clear from the new O–C diagram.
V523 Cas is located at α2000 = 0h
40m
06s.
2, δ2000 = +50◦14′16′′.0 and is fairly bright
with V ∼ 10.9 magnitudes and about 1.0 magnitude difference between minimum and maximum. The system was observed using the Pisgah Astronomical Research Institute 0.4-m telescope equipped with an Apogee E42 2048×2048 CCD camera and V RI filters. Exposure times were 40 seconds in each filter. The number of images per filter per night varied from 80 to 120. Observations were made on UT 2012 October 22, 23, 24, 25, November 2, 9, 11, 14, 16, 18, 19, 21, 22, 25, 26, 29, and UT 2013 October 10, 11, 12, 24, November 4, 8, 11, 14, 15. A total of 1,833 images were made in each filter over the two year period.
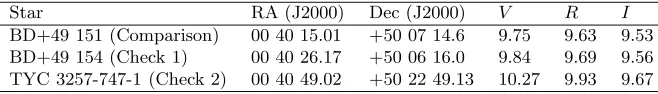
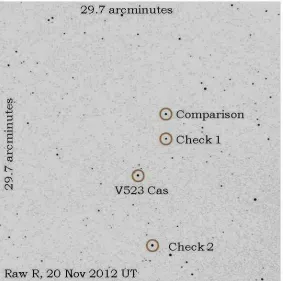
[image:1.595.133.462.719.766.2]The telescope and camera have a 30 arcminute field of view. Three stars in this field of view were selected as the comparison and check stars. Table 1 lists the coordinates and magnitudes of these stars and Figure 1 is the finding chart. The V magnitudes are from the Tycho-2 Catalog (Hog et al. 2000) and the R and I magnitudes are from the USNO B1.0 Catalog (Monet et al. 2003).
Table 1. Comparison and check stars.
Star RA (J2000) Dec (J2000) V R I
Figure 1. Finding chart for V523 Cas.
The images were bias, dark, and flat field corrected. Photometry of V523 Cas and comparison and check stars was done with an aperture radius of 12 arcseconds for star brightness measurement, and a concentric outer annulus from 14 arcseconds to 17 arc-seconds for sky measurements. The magnitude measurement error was 0.010, 0.008, and 0.006 in V, R, and I, respectively. The time of measurement was converted to heliocen-tric Julian date. Phase was calculated from the ephemeris 2446708.786 + 0.d
233691049E (Samec et al. 2004). Figure 2 shows the light curve of V523 Cas from all observations made in 2012 and 2013. The V, R, and I observations are given in Tables 2, 3 and 4 as HJD, orbital phase (based on the ephemeris) and magnitude. (The tables are available through the IBVS website as 6120-t1.txt, 6120-t2.txt, and 6120-t3.txt.)
Over the total of 25 days of observations in two years, 30 primary minima were mea-sured. Two primary minima were observed in one night on 2012 October 23, November 11, 14, 18 and 2013 October 12, 24, and November 14. On all other days, only one primary minimum was observed. The opportunity exists to precisely measure the period of the V523 Cas directly on 7 separate occasions. In order to measure the period and calculate the O–C curve, the time of minimum must be determined. Table 5 lists the dates of observations, times of minima measured with bisector of chords method of Kwee and van Woerden (1956) and the error in determining the primary minima. Also included in Ta-ble 5 are all (48) published primary minima measured between 2004 and the observations presented here. Note that the bisector of chords method was used by Samec et al. (2004) in their period analysis that led to the suggestion of a third component in the system.
The linear light ephemeris used to calculate times of minima without a third component was determined from Samec et al. (2004) and is
HJD min. I = 2446708.7773 + 0.d
IBVS6120 3
Figure 2. V523 CasV RI light curves.
The linear light ephemeris was applied to all recorded times of primary minima given in the Brno Regional Network of Observers O–C Gateway database (Paschke & Brat 2006), plus the current set of observed primary minima. Figure 3 shows the O–C values. The best fit which includes the effect of a third component to the O–C values is given by the ephemeris with a sinusoidal term (Samec et al. 2004):
HJD min. I = 2446708.8030+0.d
233691049E+1.1·10−11E2
+(0.d
041)[ sin(3.90·10−5E
− 1.04]
The sinusoidal fit, as well as a parabolic fit, are shown in Figure 3. Figure 4 is the same O–C diagram, but showing the data only from 2004 through 2013. Figure 4 clearly shows the deviation between the parabolic and sinusoidal models of the O–C diagram. Table 5 lists the current O–C residuals and those measured since 2004 for both the parabolic and sinusoidal models. (Table 5 is available through the IBVS website as 6120-t4.txt.)
The sinusoidal fit of the O–C residuals does not deviate and represents a better model than a parabolic fit, strongly suggesting the presence of a third component. We adopt the sinusoidal ephemeris as best predicting the times of minima of V523 Cas.
Kepler’s third law and using the sinusoidal component with an amplitude of 0.041 days implies the mass of the third component according to this ephemeris is 0.6 solar masses and the orbital period of the larger system is 70 years, assuming all three stars are in the same orbital plane.
Figure 3. V523 Cas O–C diagram from to 2013. The circles represent the O–C values, the dashed line is the ephemeris without a third component and the solid line is the ephemeris that includes a third
component.
Figure 4. V523 Cas O–C diagram from 2004 to 2013. The circles represent the O–C values, the dashed line is the ephemeris without a third component and the solid line is the ephemeris that includes a third
[image:4.595.101.490.462.686.2]IBVS6120 5
[image:5.595.119.476.157.753.2]detect the third component which implies that the third component must be nearly along the line of sight to the eclipsing binary system of V523 Cas. However, a quarter of a period later, or in about 18 years, the third component should be clearly visible with current spatial resolution imaging capabilities.
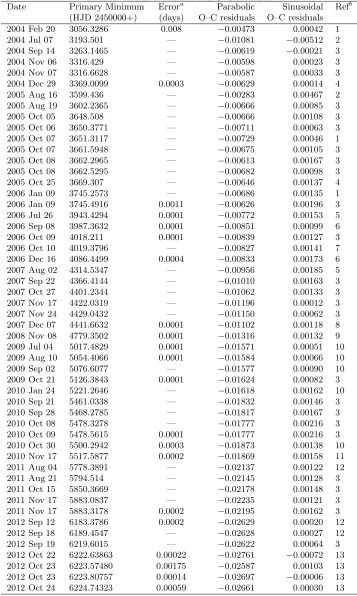
Table 5. Times of Minima and O–C residuals. Date Primary Minimum Errora
Parabolic Sinusoidal Refb
(HJD 2450000+) (days) O–C residuals O–C residuals 2004 Feb 20 3056.3286 0.008 −0.00473 0.00042 1
2004 Jul 07 3193.501 — −0.01081 −0.00512 2
2004 Sep 14 3263.1465 — −0.00619 −0.00021 3
2004 Nov 06 3316.429 — −0.00598 0.00023 3
2004 Nov 07 3316.6628 — −0.00587 0.00033 3
2004 Dec 29 3369.0099 0.0003 −0.00629 0.00014 4
2005 Aug 16 3599.436 — −0.00283 0.00467 2
2005 Aug 19 3602.2365 — −0.00666 0.00085 3
2005 Oct 05 3648.508 — −0.00666 0.00108 3
2005 Oct 06 3650.3771 — −0.00711 0.00063 3
2005 Oct 07 3651.3117 — −0.00729 0.00046 1
2005 Oct 07 3661.5948 — −0.00675 0.00105 3
2005 Oct 08 3662.2965 — −0.00613 0.00167 3
2005 Oct 08 3662.5295 — −0.00682 0.00098 3
2005 Oct 25 3669.307 — −0.00646 0.00137 4
2006 Jan 09 3745.2573 — −0.00686 0.00135 1
2006 Jan 09 3745.4916 0.0011 −0.00626 0.00196 3
2006 Jul 26 3943.4294 0.0001 −0.00772 0.00153 5
2006 Sep 08 3987.3632 0.0001 −0.00851 0.00099 6
2006 Oct 09 4018.211 0.0001 −0.00839 0.00127 3
2006 Oct 10 4019.3796 — −0.00827 0.00141 7
2006 Dec 16 4086.4499 0.0004 −0.00833 0.00173 6
2007 Aug 02 4314.5347 — −0.00956 0.00185 5
2007 Sep 22 4366.4144 — −0.01010 0.00163 3
2007 Oct 27 4401.2344 — −0.01062 0.00133 3
2007 Nov 17 4422.0319 — −0.01196 0.00012 3
2007 Nov 24 4429.0432 — −0.01150 0.00062 3
2007 Dec 07 4441.6632 0.0001 −0.01102 0.00118 8
2008 Nov 08 4779.3502 0.0001 −0.01316 0.00132 9
2009 Jul 04 5017.4829 0.0001 −0.01571 0.00051 10
2009 Aug 10 5054.4066 0.0001 −0.01584 0.00066 10
2009 Sep 02 5076.6077 — −0.01577 0.00090 10
2009 Oct 21 5126.3843 0.0001 −0.01624 0.00082 3
2010 Jan 24 5221.2646 — −0.01618 0.00162 10
2010 Sep 21 5461.0338 — −0.01832 0.00146 3
2010 Sep 28 5468.2785 — −0.01817 0.00167 3
2010 Oct 08 5478.3278 — −0.01777 0.00216 3
2010 Oct 09 5478.5615 0.0001 −0.01777 0.00216 3
2010 Oct 30 5500.2942 0.0003 −0.01873 0.00138 10
2010 Nov 17 5517.5877 0.0002 −0.01869 0.00158 11
2011 Aug 04 5778.3891 — −0.02137 0.00122 12
2011 Aug 21 5794.514 — −0.02145 0.00128 3
2011 Oct 15 5850.3669 — −0.02178 0.00148 3
2011 Nov 17 5883.0837 — −0.02235 0.00121 3
2011 Nov 17 5883.3178 0.0002 −0.02195 0.00162 3
2012 Sep 12 6183.3786 0.0002 −0.02629 0.00020 12
2012 Sep 18 6189.4547 — −0.02628 0.00027 12
2012 Sep 19 6219.6015 — −0.02622 0.00064 3
2012 Oct 22 6222.63863 0.00022 −0.02761 −0.00072 13
2012 Oct 23 6223.57480 0.00175 −0.02587 0.00103 13
2012 Oct 23 6223.80757 0.00014 −0.02697 −0.00006 13
Date Primary Minimum Error Parabolic Sinusoidal Ref (HJD 2450000+) (days) O–C residuals O–C residuals 2012 Nov 02 6233.62264 0.00022 −0.02747 −0.00047 13
2012 Nov 09 6240.63314 0.00011 −0.02718 −0.00010 13
2012 Nov 11 6242.50281 0.00015 −0.02714 −0.00005 13
2012 Nov 11 6242.73649 0.00014 −0.02703 0.00007 13
2012 Nov 14 6245.54068 0.00053 −0.02750 −0.00038 13
2012 Nov 14 6245.77544 0.00043 −0.02671 0.00041 13
2012 Nov 16 6247.64421 0.00014 −0.02755 −0.00040 13
2012 Nov 18 6249.51396 0.00026 −0.02693 0.00023 13
2012 Nov 18 6249.74730 0.00007 −0.02720 −0.00003 13
2012 Nov 19 6250.68245 0.00025 −0.02707 0.00011 13
2012 Nov 21 6252.55234 0.00012 −0.02671 0.00049 13
2012 Nov 22 6253.48601 0.00048 −0.02767 −0.00046 13
2012 Nov 25 6256.52497 0.00029 −0.02702 0.00021 13
2012 Nov 29 6260.49747 0.00021 −0.02720 0.00008 13
2013 Aug 14 6519.4294 — −0.02999 0.00002 3
2013 Oct 10 6575.74935 0.00016 −0.03074 −0.00012 13
2013 Oct 11 6576.68531 0.0004 −0.02956 0.00108 13
2013 Oct 12 6577.61881 0.00021 −0.03083 −0.00018 13
2013 Oct 12 6577.85236 0.00008 −0.03096 −0.00031 13
2013 Oct 24 6589.53704 0.00024 −0.03092 −0.00014 13
2013 Oct 24 6589.77115 0.00025 −0.03047 0.00032 13
2013 Nov 04 6600.75474 0.00015 −0.03058 0.00032 13
2013 Nov 08 6604.72680 0.00015 −0.03127 −0.00032 13
2013 Nov 11 6607.76530 0.00001 −0.03103 −0.00005 13
2013 Nov 14 6610.56932 0.00014 −0.03126 −0.00025 13
2013 Nov 14 6610.80309 0.00021 −0.03147 −0.00045 13
2013 Nov 15 6611.50413 0.00055 −0.03120 −0.00018 13
a
Errors are stated when given in the reference.
b
1) Brat et al. 2007, 2) Locher 2005, 3) Paschke & Brat 2006, 4) Kim et al. 2006, 5) Parimucha et al. 2007, 6) Dogru et al. 2007a, 7) Csizmadia 2006, 8) Dogru et al. 2007b, 9) H¨ubscher et al. 2009, 10) Parimucha et al. 2011, 11) Diethelm 2011, 12) Parimucha et al. 2013, 13) This paper.
References:
Brat, L., Zejda, M., Svoboda, P. 2007,Open European Journal on Variable Stars, No. 74, 1
Csizmadia, Sz. et al. 2006, IBVS, No. 5736 Diethelm, R. 2011,IBVS, No. 5960
Dogru, S.S. et al. 2007a, IBVS, No. 5746
Dogru, S. S., Dogru, D., D¨onmez, A. 2007b, IBVS, No. 5795 Hog, E. et al. 2000, A&A, 355, L27
H¨ubscher, J., Steinbach, H-M., Walter, F. 2009, IBVS, No. 5889 Kim, Chun-Hwey et al. 2006,IBVS, No. 5694
Kwee, K. K. & van Woerden, H., 1956,BAN, 12, 327
Locher, K. 2005, Open European Journal on Variable Stars, No. 3, 1 Monet, D. et al. 2003, AJ, 125, 984
Paschke, A. & Brat, L. 2006,Open European Journal on Variable Stars, No. 23, 13 Parimucha, S. et al. 2007, IBVS, No. 5777
Parimucha, S., Dubovsky, P., Vanko, M., Pribulla, T., Kudzej, I., Barsa, R. 2011,IBVS, No. 5980
Parimucha, S., Dubovsky, P., Vanko, M. 2013, IBVS, No. 6044
Rucinski, S. M., Pribulla, T., & van Kerkwijk, M. H. 2007, AJ, 134, 2353
[image:6.595.122.476.86.408.2]