International Research Journal of Engineering and Technology (IRJET)
e-ISSN: 2395 -0056 p-ISSN: 2395-0072 Volume: 03 Issue: 10 | Oct-2016 www.irjet.netReserve Estimation Using Volumetric Method
Rejas Rasheed
1, Prof. Avinash Kulkarni
21
ME 2
ndyear, Department of Petroleum Engineering, Maharashtra Institute of Technology, Pune, India
2Assistant Professor, Department of Petroleum Engineering, Maharashtra Institute of Technology, Pune, India
---***---Abstract -
Reserves estimation is one of the most essential tasks in the petroleum industry. It is the process by which the economically recoverable hydrocarbons in a field, area, or region are evaluated quantitatively. A major goal in this initiative is preparation of training modules that represent industry’s “recommended practices.” Long before the issue caught the public’s attention, how- ever, reserves estimation was a challenge for the industry. The challenge stems from many factors, tangible and intangible, that enter the estimation process, and judgment is an integral part of the process. Uncertainty, along with risk, is an endemic problem that must be addressed. Consequently, the industry’s record of properly predicting reserves has been mixed. Despite appeals from some quarters, there currently is no standardized reserves-estimation procedure.Key Words: OIIP, GIIP, OWC, GOC, IGCP, IWCP
1.
INTRODUCTION
Reserves are estimated volumes of crude oil, condensate, natural gas, natural gas liquids, and associated substances anticipated to be commercially recoverable from known accumulations from a given date forward, under existing economic conditions, by established operating practices, and under current government regulations. Reserve estimates are based on geologic and/or engineering data available at the time of estimate. Reserves estimation is one of the most essential tasks in the petroleum industry. It is the process by which the economically recoverable hydrocarbons in a field, area, or region are evaluated quantitatively
.
[image:1.596.83.228.610.767.2]1.1 TYPES OF RESERVES
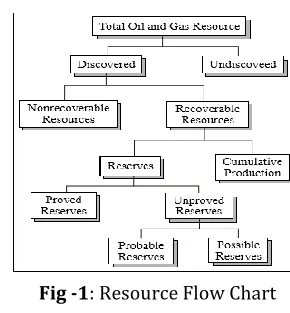
Fig -1: Resource Flow Chart
The relative degree of an estimated uncertainty is reflected by the categorization of reserves as either "proved" or "unproved"
A. Proved Reserves can be estimated with reasonable certainty to be recoverable under current economic conditions. Current economic conditions include prices and costs prevailing at the time of the estimate.
B.
Unproved Reserves are based on geological and/or engineering data similar to those used in the estimates of proved reserves, but when technical, contractual, economic or regulatory uncertainties preclude such reserves being classier as proved. They may be estimated assuming future economic conditions different from those prevailing at the time of the estimate.
Unproved reserves may further be classified as probable and possible.
A. Probable reserves are quantities of recoverable hydrocarbons estimated on the basis of engineering and geological data that are similar to those used for proved reserves but that lack, for various reasons, the certainty required to classify the reserves as proved
B. Possible Reserves Possible reserves are quantities of recoverable hydrocarbons estimated on the basis of engineering and geological data that are less complete and less conclusive than the data used in estimation of probable reserves
2.
RESERVE ESTIMATION
Estimation of the in place oil and gas volumes and its recoverable part (reserves) happens to be a significant phase in the various activities leading to the development of oil and gas fields.
International Research Journal of Engineering and Technology (IRJET)
e-ISSN: 2395 -0056 p-ISSN: 2395-0072 Volume: 03 Issue: 10 | Oct-2016 www.irjet.net2.1 Types of Reservoir Estimation
Reserves-estimation methods are broadly classified as analogy, volumetric, and performance types. Volumetric and performance methods are the more elaborate techniques, and the main difference between the two is the type of data used relating to pre- and post- production phases.
Volumetric Method: As the name suggests, this method requires the volume of the reservoir to be calculated through maps and petro-physical data of the drilled wells. This method is carried out in the early phases of exploration to find the amount of Oil and Gas in place and the likely corresponding reserves.
Material Balance Method: This method is carried out in the intermediary stages of the exploration and thus the production of Oil and Gas is estimated
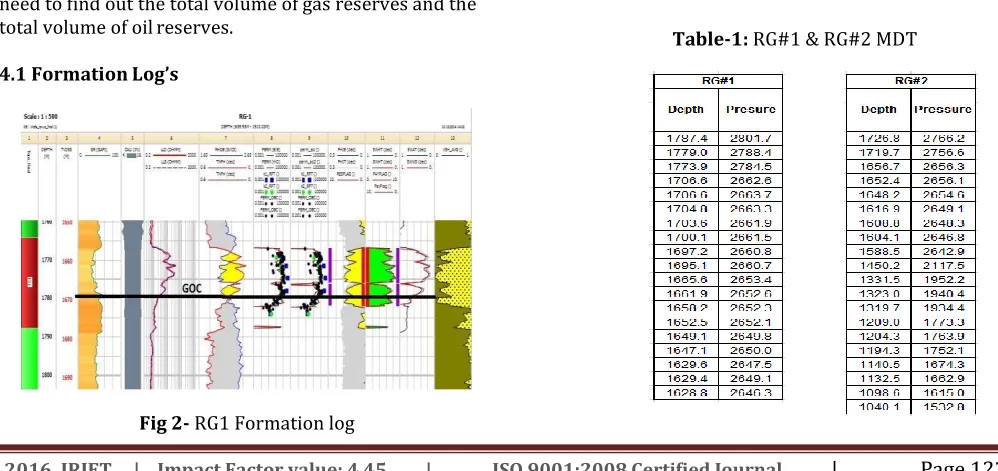
Shown above is a section of formation log of a well named RG#1, indicating GOC. At 1669 m depth, can be observed cross-over of RHOB, NPH curves indicating a change in formation fluid. Since after 1669 m depth, the width of RHOB, NPH curves is less to some extent along with little higher resistivity than normal dry formation, oil presence can be assumed, thereby confirming it to be GOC.
Decline Curve Analysis: This method is carried out in the late life of the field when most of the Oil and Gas has already been produced and the field production rate is on the Decline. The future production forecast gives the reserves.
3.
BASIC TERMINOLOGY
OOIP: Oil Initial in Place GIIP: Gas Initial in Place OWC: Oil Water Contact GOC: Gas Oil Contact
IGCP: Initial Gas Cap Volume IWCP: Initial Water Cap Volume
4.
RESERVE ESTIMATION USING VOLUMETRIC
METHOD
Here we consider a well named RG1 and R-6a from the field. In order to estimate the reserves using volumetric method we need to know the petro physical data of both the well including their log formation graphs. Here we need to find out the total volume of gas reserves and the total volume of oil reserves.
4.1 Formation Log’s
[image:2.596.331.560.214.367.2]Fig 2- RG1 Formation log
Fig 3- R-6a well Formation Log
Shown above is a section of formation log of a well named R- 6a, indicating OWC. At a depth of 1690 m, we can be observed deviation of RHOB, NPH curves indicating a change in formation fluid. Since after 1690 m depth, some raise in density is observed which can be assumed as water, thereby confirming it to be OWC. Also from the RFT data of RG#2 well, formation fluid was observed to be gas up to 1661 m depth, after which no information about formation fluid is furnished up to 1719 m depth. This data also supports the argument of GOC and OWC, convincingly.
[image:2.596.37.536.547.783.2]4.2 Well Data
International Research Journal of Engineering and Technology (IRJET)
e-ISSN: 2395 -0056 p-ISSN: 2395-0072 Volume: 03 Issue: 10 | Oct-2016 www.irjet.net [image:3.596.37.279.110.232.2]Chart-1: Pressure gradient curves of RG#2, RG#1 wells
[image:3.596.338.528.133.330.2]Fig 5- Isopach map indicating OWC & GOC
Table 2 -Section-wise Areal calculations of drawncontours
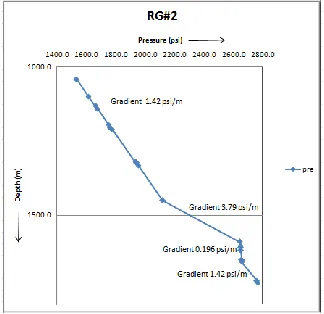
Chart-2: Pressure gradient curve of RG#2 well
By the pressure- gradient curves of RG#1 and RG#2 wells, the region with gradient 0.196 psi/m indicates gas, and that with 1.42 psi/m indicates liquid.
4.3 Methodology
OWC and GOC plotted on the Structure contour map as shown below.
[image:3.596.81.243.266.423.2]International Research Journal of Engineering and Technology (IRJET)
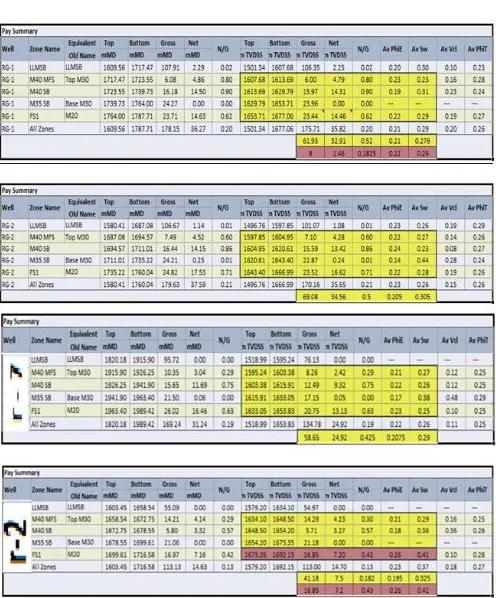
e-ISSN: 2395 -0056 p-ISSN: 2395-0072 Volume: 03 Issue: 10 | Oct-2016 www.irjet.netTable 3- Petrophysical parameters
5.
CALCULATIONS
Initially we have to take the sum of dAgas from table no 2
which is indicated in the yellow colour.
∑dAgas = (17.5 + 6.9 + 28.3 + 23.6) cm2 = 76.3 cm2
Then we have to take the sum of dAoil from table no 2, which
is indicated in the brown colour.
∑dAoil = 16.7 cm2
(From contours, cumulative dAoil in the other sections is 153.12 cm2)
Therefore, ∑dAoil = 16.7 + 153.12 = 169.82 cm2
Avg. (N/G)gasRG#1 = (0.8 + 0.9 + 0.62)/3 = 0.77
Avg. (N/G)gasRG#2= (0.6 + 0.86 + 0.71)/3 = 0.72
Avg. (N/G)gas= (0.77 + 0.72)/2 = 0.745
Avg. (Sw)gas = (0.276 + 0.305)/2 = 0.2905
NOTE: Since more gas is observed to be accumulated only in the fault blocks containing the wells RG#1 and RG#2, Sw values of those two wells is only considered here for calculations purpose, this is done because, when the Sw values of the wells in other blocks is considered that is
diminishing the Sw values of RG#1 and RG#2 by a significant amount, similar reason for (N/G) as well.
Therefore, (1 – Sw)gas = 0.7095
Avg. (φ)gas = (0.21 + 0.205 + 0.2075 + 0.195)/4 = 0.20437
As given scale of contour map is 1:20000, it implies that
1 cm on map is equal to 200 m in field.
Therefore, 76.3 cm2 area = 76.3 × 200 × 200 = 3052000 m2
NOTE: In the petro physical data given, for RG#1 well, the section from depth 1629 m to 1653 m and for RG#2 well, the section from depth 1620 m to 1643 m (can be seen in the highlighted region) are shale’s, and hence their parameters are not considered for calculations purpose.
5.1 Calculation of Gas Reserves
Volume of gas = {Area × h × (N/G) × (1 – Sw) × φ}/FVF
Given, FVF for gas is 0.00723
Since the formation is not uniform laterally the thickness “h”, here is assumed average of the net gas pay thickness, i.e. (1669-1590)/2 = 39.5
i.e. {3052000 × 39.5 × 0.745 × 0.7095 × 0.204375}/0.00723
= 1801273957.706 m3
Therefore, Gas Reserves is 1801273957.706 m3,
i.e. 63.61 bcf
5.2 Calculation of Oil reserves
∑dAoil = 16.7 + 153.12 = 169.82 cm2
(N/G)oil = (0.1825 + 0.43) / 2 = 0.30625
(Sw)oil = (0.29 + 0.41) / 2 = 0.35
(1 – Sw)oil = 0.65
(Φ)oil = (0.22 + 0.26) / 2 = 0.24
Volume of Oil = {Area × h × (N/G) × (1 – Sw) × φ} / FVF
FVF for Oil is given as 1.3
As given scale of contour map is 1:20000, it implies that
International Research Journal of Engineering and Technology (IRJET)
e-ISSN: 2395 -0056 p-ISSN: 2395-0072 Volume: 03 Issue: 10 | Oct-2016 www.irjet.netTherefore, 169.82 cm2 area = 169.82 × 200 × 200 = 6792800m2
Therefore, Volume of Oil will be,
{6792800 × 21 × 0.30625 × 0.65 × 0.24} / 1.3 =
5242343.7 m3 = 32.97 Mmbbl
6.
CONCLUSION
Using volumetric method for finding the Gas and Oil in place has limitations on the basis of data’s available from the field.
Volumetric method needs petro-physical data as well as well logs data.
Sketching of Isopach map indicating oil-water contact and gas-oil contact was a challenge with the help contour map.
The initial gas in place of the block was found as 63.61 bcf.
The initial oil in place of the block was found as 32.97 Mmbbl
Same values can be find out with the help of other methods known as (a) Material Balance Method & (b) Simulation Method using software.
ACKNOWLEDGEMENT
I am very thankful to Cairn India –Ravva on-shore/off-shore Terminal, Andhra Pradesh for allowing me to carry out this case study. I am also thankful to MIT-Pune for the unconditional support.
REFERENCES
[1] L.P. Dake, Text Book on “Fundamentals of Reservoir Engineering” October 1977
[2] J.M. Hefner, “A Comparison of Probabilistic and Deterministic Reserve Estimates” SPE-266388, May 1996
[3] C.Y. Yoo and S.A. Holditch, “Reservoir Permeability Estimation from Time-Lapse Log Data” SPE-25513, June 1996
[4] Dean Rietz & Adnan Usmani “Case Study Illustrating the Use of Reservoir Simulation Results in the Reservoir Estimation Process” SPE-110066, February 2009
[5] Ali Azad & Rick J. Chalaturnyk, “Application of Analytical Proxy Models in Reservoir /estimation for SAGD Process:” SPE-165576, May 2013
[6] Cairn India Data Base Andhra Pradesh.