Dissection of experimental asthma with DNA
microarray analysis identifies arginase in
asthma pathogenesis
Nives Zimmermann, … , Qutayba Hamid, Marc E.
Rothenberg
J Clin Invest.
2003;
111(12)
:1863-1874.
https://doi.org/10.1172/JCI17912
.
Asthma is on the rise despite intense, ongoing research underscoring the need for new
scientific inquiry. In an effort to provide unbiased insight into disease pathogenesis, we took
an approach involving expression profiling of lung tissue from mice with experimental
asthma. Employing asthma models induced by different allergens and protocols, we
identified 6.5% of the tested genome whose expression was altered in an asthmatic lung.
Notably, two phenotypically similar models of experimental asthma were shown to have
distinct transcript profiles. Genes related to metabolism of basic amino acids, specifically the
cationic amino acid transporter 2, arginase I, and arginase II, were particularly prominent
among the asthma signature genes. In situ hybridization demonstrated marked staining of
arginase I, predominantly in submucosal inflammatory lesions. Arginase activity was
increased in allergen-challenged lungs, as demonstrated by increased enzyme activity, and
increased levels of putrescine, a downstream product. Lung arginase activity and mRNA
expression were strongly induced by IL-4 and IL-13, and were differentially dependent on
signal transducer and activator of transcription 6. Analysis of patients with asthma supported
the importance of this pathway in human disease. Based on the ability of arginase to
regulate generation of NO, polyamines, and collagen, these results provide a basis for
pharmacologically targeting arginine metabolism in allergic disorders.
Article
Aging
Find the latest version:
Introduction
Despite intense ongoing asthma research, there is cur-rently an epidemic of this disease in the western world and the incidence is on the rise (1, 2). Experimentation in the asthma field has largely focused on analysis of the cellular and molecular events induced by allergen expo-sure in sensitized animals (primarily mice) and humans. These studies have identified elevated production of
IgE, mucus hypersecretion, airway obstruction, inflam-mation, and enhanced bronchial reactivity to spasmo-gens in the asthmatic response (3–5). Clinical and exper-imental investigations have demonstrated a strong correlation between the presence of CD4+Th2 cells and
disease severity, suggesting an integral role for these cells in the pathophysiology of asthma (6). Th2 cells are thought to induce asthma through the secretion of an array of cytokines (IL-4, -5, -6, -9 -10, -13, and -25) that activate inflammatory and residential effector pathways both directly and indirectly (7, 8). In particular, IL-4 and IL-13 are produced at elevated levels in the asthmatic lung and are thought to be central regulators of many of the hallmark features of disease (9, 10). Although these studies have provided the rationale for the devel-opment of multiple therapeutic agents that interfere with specific inflammatory pathways (11), the develop-ment of the asthma phenotype is likely to be related to the complex interplay of a large number of additional genes and their polymorphic variants. Accordingly, we aimed to identify new genes involved in the pathogene-sis of experimental asthma with the use of an empirical
Dissection of experimental asthma
with DNA microarray analysis
identifies arginase in asthma pathogenesis
Nives Zimmermann,
1Nina E. King,
1Johanne Laporte,
2Ming Yang,
3Anil Mishra,
1Sam M. Pope,
1Emily E. Muntel,
1David P. Witte,
4Anthony A. Pegg,
5Paul S. Foster,
3Qutayba Hamid,
2and Marc E. Rothenberg
11Division of Allergy and Immunology, Department of Pediatrics, Cincinnati Children’s Hospital Medical Center,
Cincinnati, Ohio, USA
2Meakins-Christie Laboratories and Montreal Chest Institute, McGill University, Montreal, Canada
3Division of Molecular Biosciences, John Curtin School of Medical Research, Australian National University,
Canberra, Australia
4Division of Pathology, Department of Pediatrics, Cincinnati Children’s Hospital Medical Center, Cincinnati, Ohio, USA 5Department of Cellular and Molecular Physiology, Pennsylvania State University College of Medicine, Hershey,
Pennsylvania, USA
Asthma is on the rise despite intense, ongoing research underscoring the need for new scientific inquiry. In an effort to provide unbiased insight into disease pathogenesis, we took an approach involv-ing expression profilinvolv-ing of lung tissue from mice with experimental asthma. Employinvolv-ing asthma mod-els induced by different allergens and protocols, we identified 6.5% of the tested genome whose expres-sion was altered in an asthmatic lung. Notably, two phenotypically similar models of experimental asthma were shown to have distinct transcript profiles. Genes related to metabolism of basic amino acids, specifically the cationic amino acid transporter 2, arginase I, and arginase II, were particularly prominent among the asthma signature genes. In situ hybridization demonstrated marked staining of arginase I, predominantly in submucosal inflammatory lesions. Arginase activity was increased in allergen-challenged lungs, as demonstrated by increased enzyme activity, and increased levels of putrescine, a downstream product. Lung arginase activity and mRNA expression were strongly induced by IL-4 and IL-13, and were differentially dependent on signal transducer and activator of transcrip-tion 6. Analysis of patients with asthma supported the importance of this pathway in human disease. Based on the ability of arginase to regulate generation of NO, polyamines, and collagen, these results provide a basis for pharmacologically targeting arginine metabolism in allergic disorders.
J. Clin. Invest.111:1863–1874 (2003). doi:10.1172/JCI200317912.
Received for publication January 20, 2003, and accepted in revised form April 1, 2003.
Address correspondence to:Marc Rothenberg, Division of Allergy and Immunology, Cincinnati Children’s Hospital Medical Center, 3333 Burnet Avenue, Cincinnati, Ohio 45229, USA. Phone: (513) 636-7210; Fax: (513) 636-3310;
E-mail: [email protected].
Nives Zimmermann and Nina E. King contributed equally to this work.
Conflict of interest:The authors have declared that no conflict of interest exists.
Nonstandard abbreviations used:cationic amino acid transporter (CAT); signal transducer and activator of transcription (STAT); argininosuccinate lyase (AL); argininosuccinate synthetase (AS); ornithine decarboxylase (ODC); ornithine aminotransferase (OAT).
approach that uses DNA microarray analysis of whole lung RNA. By using two phenotypically similar models of experimental asthma induced by independent regimes, we report distinct transcript profiles associat-ed with each model. Among the asthma signature genes, we found concerted overexpression of the genes encod-ing for molecules involved in uptake and metabolism of basic amino acids (e.g., arginine), specifically, arginine metabolism by arginase. We chose to focus on these genes because intracellular arginine is a regulator of diverse pathways, including production of NO, polyamines, and proline; these molecules regulate crit-ical processes associated with asthma, including airway tone, cell hyperplasia, and collagen deposition, respec-tively (12, 13). Our results demonstrate specific regula-tion of arginase by diverse allergens, IL-4, and IL-13. In addition, we demonstrate overproduction of an arginase downstream product in the asthmatic lung. Finally, we provide evidence that this pathway is opera-tional in human asthma.
Methods
Experimental asthma induction. Balb/c mice were obtained from the National Cancer Institute (Freder-ick, Maryland, USA) and signal transducer and activa-tor of transcription 6–deficient (STAT6-deficient) mice (Balb/c) were obtained from Jackson Laboratory (Bar Harbor, Maine, USA); all mice were housed under spe-cific pathogen-free conditions. Asthma models were induced by intraperitoneal injection with 100 µg OVA (grade V, Sigma-Aldrich, St. Louis, Missouri, USA) and 1 mg aluminum hydroxide (alum) as adjuvant twice, followed by two 50 µg OVA or saline intranasal chal-lenges 3 days apart, starting a least 10 days after the second sensitization, as previously described (14). The level of LPS in OVA was less than 2 pg/ml as detected by the Limulus assay. Mice were killed 3 or 18 hours after the first or second challenge. Aspergillus fumigatus antigen-associated asthma was induced by challenging mice intranasally three times a week for 3 weeks, as described (14–16). In brief, mice were lightly anes-thetized with isofluorane inhalation and 100 µg (50
µl) of A. fumigatus extract (Bayer Pharmaceuticals, Spokane, Washington, USA) or 50 µl of normal saline solution alone was applied to the nasal cavity by using a micropipette with the mouse held in the supine posi-tion. After instillation, mice were held upright until alert. Mice were killed 18 hours after the last challenge. This protocol induces a similar phenotype to the OVA model (characterized by eosinophilia, Th2 responses, eotaxin-1 and eotaxin-2 induction, and airway hyper-reactivity) (refs. 14–17, and data not shown).
Preparation of RNA and microarray hybridization.RNA was extracted by using the Trizol reagent as per the man-ufacturer’s instructions. After Trizol purification, RNA was repurified with phenol-chloroform extraction and ethanol precipitation. Microarray hybridization was per-formed by the Affymetrix Gene Chip Core facility at Cincinnati Children’s Hospital Medical Center. Briefly,
RNA quality was first assessed by using the Agilent bio-analyzer (Agilent Technologies, Palo Alto, California, USA) and only those samples with 28S/18S ratios between 1.3 and 2 were subsequently used. RNA was converted to cDNA with Superscript choice for cDNA synthesis (Invitrogen, Carlsbad, California, USA) and subsequently converted to biotinylated cRNA with Enzo High Yield RNA Transcript labeling kit (Enzo Diagnos-tics, Farmingdale, New York, USA). After hybridization to the murine U74Av2 GeneChip (Affymetrix, Santa Clara, California, USA), the gene chips were automati-cally washed and stained with streptavidin-phycoery-thrin by using a fluidics system. The chips were scanned with a Hewlett-Packard GeneArray Scanner (Hewlett-Packard, Palo Alto, California, USA). This analysis was performed with one mouse per chip (n= 3 or more for each allergen challenge condition and n= 2 or more for each saline challenge condition). A further description of the methodology, according to MIAME (Minimum Information About a Microarray Experiment) guidelines (www.mged.org/Workgroups/MIAME/miame.html) is provided in supplementary information (http://www.jci. org/cgi/content/full/111/12/1863/DC1).
Microarray data analysis. From data image files, gene transcript levels were determined with the use of algo-rithms in the Microarray Analysis Suite software (Affymetrix). Global scaling was performed to compare genes from chip to chip; thus, each chip was normal-ized to an arbitrary value (1500). Each gene is typically represented by a probe set of 16 to 20 probe pairs. Each probe pair consists of a perfect match oligonucleotide and a mismatch oligonucleotide that contains a one-base mismatch at a central position. Two measures of gene expression were used, absolute call and average difference. Absolute call is a qualitative measure in which each gene is assigned a call of present, marginal, or absent, based on the hybridization of the RNA to the probe set. Average difference is a quantitative measure of the level of gene expression, calculated by taking the difference between mismatch and perfect match of every probe pair and averaging the differences over the entire probe set. Differences between saline- and aller-gen-treated mice were also determined with the use of the GeneSpring software (Silicon Genetics, Redwood City, California, USA). Data were normalized to the average of the saline-treated mice. Gene lists were cre-ated that contained genes with P< 0.05 and greater than twofold change by log transformation of average difference values (by using genes that received a pres-ent call, which was based on the hybridization signal). Excel files (Microsoft, Redmond, Washington, USA) that include average differences and absolute call val-ues for all 12,422 genes in the 11 analyzed DNA chips are presented in supplementary Table 1 (http://www.jci. org/cgi/content/full/111/12/1863/DC1).
background) (19), and from the lungs of mice treated with intranasal or intratracheal saline or recombinant murine IL-13 (obtained from Debra Donaldson, Wyeth Research, Madison, New Jersey, USA), as previously reported (17, 20, 21). The cDNA probes, generated by PCR or from commercially available vectors (Image Consortium obtained from American Tissue Culture Collection, Rockville, Maryland, USA, or Incyte Genomics, Palo Alto, California, USA), were sequence confirmed, radiolabeled with 32P, and hybridized by
using standard conditions. RT-PCR, which used stan-dard procedures with gene specific primers, was per-formed by using lung cDNA as a template.
In situ hybridization of mouse lung.In situ hybridization was performed as described (22). In brief, murine arginase I cDNA in plasmid pCMV-SPORT6 (Incyte Genomics, St. Louis, Missouri, USA) was linearized by EcoRI or Not I digestion, and antisense and sense RNA probes, respectively, were generated by T7 and SP6 RNA polymerase (Riboprobe Gemini Core System II transcription kit; Promega, Madison, Wisconsin, USA). The radiolabeled (αS35-UTP) probes were hybridized
and washed under high-stringency conditions. Immunohistochemistry. Slides from saline- and OVA-chal-lenged lung tissue were stained with the anti–arginase-I antibody (affinity-purified RG-1, kindly provided by Sid-ney Morris, University of Pittsburgh School of Medicine) (23) at 3.5 µg/ml. After staining with a biotinylated anti-chicken secondary antibody at 15 µg/ml (Vector Labora-tories Inc., Burlingame, California, USA) and strepta-vidin-Vectastain Elite ABC-peroxidase reagents (Vector Laboratories Inc.), slides were subsequently developed with diaminobenzidine (DAB) (Vector Laboratories Inc.). Anti-Mac-3 staining (10 µg/ml; BD Pharmingen, San Diego, California, USA) was performed with the Vectas-tain Elite ABC-Peroxidase Rat IgG kit for detection, according to the manufacturer’s instructions. As negative controls, tissues were stained without primary antibody. Arginase activity. Arginase activity was measured by using the blood urea nitrogen reagent (Sigma-Aldrich, St. Louis, Missouri, USA) according to established tech-niques (23–25). In some experiments, arginase activity was measured in the J774A.1 macrophage cell line (ATCC), plated at 0.25 ×10⁶/ml and stimulated with
0.5–50 ng/ml IL-13 for 18 hours. Arginase activity was measured in cell lysates, as described above.
Putrescine levels. After acid extraction, putrescine con-tent was determined by ion-pair reverse-phase HPLC, by using methods previously described (26).
Analysis of human lung samples. Fiberoptic bron-choscopy and endobronchial biopsy of the subseg-mental bronchus of allergic asthmatics and healthy controls after their informed consent was conducted, by using methods previously reported (27, 28). Asth-matic patients (age range 27–44 years, 75% male) were all atopic individuals requiring intermittent β2-agonist therapy (forced expiratory volume in 1 s [FEV1] values of 78%–90% normal), not requiring inhaled glucocorti-coids for at least 4 weeks, free of respiratory infections
for at least 8 weeks, and not on immunotherapy for at least the last 4 years. Healthy, gender-matched controls (age range 29–44) were nonatopic and had FEV1 values greater than 95% normal. Bronchoalveolar lavage cells after cytocentrifugation (after methanol/acetone fixa-tion) were immunohistochemically stained with mon-oclonal mouse IgG1 antihuman arginase I (BD Bio-sciences, Lexington, Kentucky, USA) by using 1/100 dilution. The slides were developed in Fast Red (Sigma-Aldrich) in the presence of levamisole, as described pre-viously (29). For negative control preparations, the pri-mary antibody was replaced by saline solution or nonimmune mouse IgG1. A minimum of 1000 cells on blindly coded cytospin slides were scored for the num-ber of positive cells, expressed as a percentage of total cells. In situ hybridization of lung samples from asth-matic and control individuals was performed with radiolabeled [αS35-UTP] sense and antisense probes
hybridized and washed under high-stringency condi-tions, as previously described (28).
Statistical analysis. The significance of differences between the means of experimental groups was ana-lyzed with Student unpaired ttest. Values were report-ed as the mean ± SD. Differences in mean values were considered significant if P< 0.05.
Results
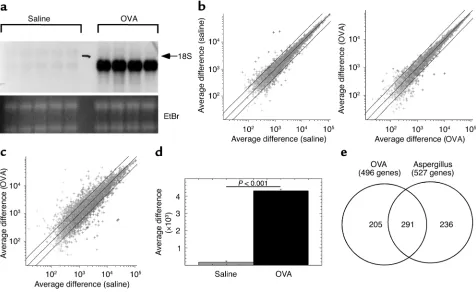
the twofold boundaries (Figure 1b). In contrast, pair-wise comparison of allergen-challenged mice to saline-challenged mice revealed a greater than twofold change in 6.5% ± 0.8% of the genes (Figure 1c). A full list of the OVA-induced genes is presented in supplementary Table 2 (http://www.jci.org/cgi/content/full/111/12/ 1863/DC1). Importantly, eotaxin-1 was reproducibly identified in the allergen-induced genes (Figure 1d). Quantitative analysis of the average difference signal for eotaxin-1 between allergen and saline revealed a 25-fold induction (P= 0.001). Collectively, these data illustrat-ed the potential value of the scientific approach; thus, providing the impetus for the next set of experiments. We aimed to determine the degree of overlap between allergen-induced global transcript profiles in two inde-pendent models of asthma. We analyzed experimental asthma induced by A. fumigatus antigen because this model involves a unique mucosal sensitization route (intranasal) compared with the OVA model (31) and because A. fumigatusis a ubiquitous and common aeroal-lergen. Importantly, both asthma models have similar phenotypes, including Th2-associated eosinophilic
[image:5.576.62.538.56.348.2]inflammation, mucus production, and airway hyperre-sponsiveness (AHR) (14–16). Lung RNA was obtained 18 hours after nine doses of intranasal A. fumigatus allergen or saline challenges (delivered over the course of 3 weeks). We compared allergen-challenged mice (OVA or Aspergillus) with their respective saline control mice, and genes were identified that statistically increased (P< 0.05) at least twofold after allergen chal-lenge. Compared with mice challenged with saline, OVA-challenged mice had 496 genes induced and A. fumigatus–challenged mice had 527 genes induced (Fig-ure 1e). A full list of A. fumigatus antigen-induced genes and the overlap with the OVA-induced genes are pre-sented in supplementary Tables 3 and 4, respectively (http://www.jci.org/cgi/content/full/111/12/1863/ DC1). Notably, the majority (59% of OVA and 55% of Aspergillus) of the induced transcripts overlapped between the two experimental asthma models (Figure 1e); however, there was a large subset of the identified genome specific to each model, indicating that although experimental asthma models have similar apparent phenotypes, there is large genetic diversity, as
Figure 1
assessed by transcript profiles. This has important implications in understanding the diverse spectrum of genes potentially involved in human asthma.
Experimental asthma is associated with induction of genes involved in L-arginine metabolism. Our results identified
a set of 291 genes that were commonly involved in dis-ease pathogenesis rather than unique to a particular allergen or mode of disease induction (Figure 1e). These “asthma signature” genes provide a valuable opportunity to define new pathways involved in the pathogenesis of allergic airway inflammation. In this regard, we were struck by the high level of transcripts for genes involved in metabolism of L-arginine.
Arginase I, arginase II, and the L-arginine transporter,
cationic amino acid transporter (CAT)2, were strong-ly induced (Figure 2, a–c). We were particularstrong-ly sur-prised to find induction of genes previously thought to be primarily involved in metabolic pathways in the liver. Other enzymes involved in L-arginine
metabo-lism, such as argininosuccinate synthetase (AS),
L-ornithine decarboxylase (L-ODC), and L-ornithine
aminotransferase (L-OAT) were not significantly
dif-ferent between saline- and allergen-challenged mice (Figure 2d and data not shown). Interestingly, microarray analysis revealed very specific dysregula-tion of arginase compared with NOS. For example, the hybridization signals for eNOS and neuronal NOS were below background in the saline- and
allergen-challenged lung (data not shown). Although the iNOS mRNA was detectable under most conditions, it did not change significantly between saline and allergen challenge (Figure 2e and data not shown).
The enzyme arginase is a urea cycle enzyme that exists in two isoforms (60% amino acid homology), designat-ed type I and type II, which are encoddesignat-ed by different genes on distinct chromosomes (12). Arginase I is a cytoplasmic protein that is primarily expressed in the liver; whereas arginase II is a mitochondrial protein expressed in a variety of tissues, especially the kidney and prostate (32). The exact function of arginase in extrahepatic tissue is not well understood. However, the product of arginase, L-ornithine, is a precursor in
[image:6.576.64.535.395.649.2]the production of polyamines (e.g., putrescine, spermi-dine, and spermine) and proline, which control cell proliferation and collagen production, respectively (Figure 2d) (12, 32). In fact, increased expression of arginase I alone is sufficient to increase the prolifera-tion rates of vascular smooth muscle (24) and endothe-lial cells (25). Thus, arginase activity is potentially crit-ically linked to cell growth and connective tissue production. Notably, both of these processes are key parameters in the pathogenesis of asthma (33). We sub-sequently determined by Northern blot analysis that there was a time- and dose-dependent induction of arginase I during the progression of OVA-induced experimental asthma; arginase I was induced 18 hours
Figure 2
Expression of L-arginine metabolizing enzymes. Expression of arginase I (a), arginase II (b), CAT2 (c), and iNOS (e) in ovalbumin (OVA) and
A. fumigatus(Asp)-challenged mice as measured by gene chip analysis is shown. The average difference for the hybridization signal after saline (gray bar) and allergen (black bar) challenge is depicted (n= 2 for Aspergilluscontrol group and n= 3 for OVA control group and OVA and
Aspergillusexperimental groups). Error bars represent the SD. A schematic representation of the L-arginine metabolism pathway is shown in
after the first allergen challenge and even higher after two allergen challenges (Figure 3a). In addition, although arginase II mRNA induction was weaker than arginase I, it was induced earlier in the evolution of experimental asthma (Figure 3a). For example, arginase II was readily detectable 3 hours after the first allergen challenge (Figure 3a). The iNOS mRNA was weakly detectable and was not significantly induced by OVA challenge (data not shown). In addition, compared with mice challenged with nine doses of intranasal saline, A. fumigatus–challenged mice had marked expression of arginase I and arginase II (Figure 3b). Consistent with the results in the OVA model, there were only low levels of induction of iNOS mRNA (data not shown). Thus, the induction of arginase and CAT2 by allergen challenge was not specific to the antigen used but appeared to be part of the genetic program of experimental asthma. We hypothesized that the large
[image:7.576.62.520.51.396.2]increase in arginase mRNA would be translated into enhanced arginase activity in the lung because the activity of arginase is primarily regulated by a tran-scriptional mechanism (12). Indeed, after induction of OVA-induced experimental asthma, there was a marked increase in lung arginase activity (Figure 3c). Similar results were obtained when asthma was induced with A. fumigatus antigen; arginase activity was 10.8 ± 10.8 and 357 ± 156 nmol/min/mg protein (n= 3–4 mice; P= 0.02) for saline- and A. fumigatus–chal-lenged mice, respectively. Consistent with the absence of arginase mRNA in the lung of control mice, the level of arginase activity in the saline-challenged lung was close to background. As a control, arginase activity in the liver was 1522 ± 183 and 1390 ± 78 nmol/min/mg protein for saline- and OVA-challenged mice, respec-tively. Finally, in the absence of OVA/alum sensitiza-tion, two doses of intranasal OVA did not induce
Figure 3
Northern blot and arginase activity analysis. In a, Northern blot analysis of arginase I and arginase II expression after OVA challenge is shown. Time points are as follows: 3H = 1 challenge, 3 hours; 18H = 1 challenge, 18 hours; 2C = 2 challenges, 18 hours. The EtBr–stained gel is also shown. The autoradiograph exposure times were 18 hours and 2 days for arginase I and arginase II, respectively. In b, the expression of arginase I and arginase II after intranasal challenges with A. fumigatusor saline is shown. Sal, saline; Asp, aspergillus. The autoradiograph exposure times were 18 hours and 6 days for arginase I and arginase II, respectively. In aand b, each lane represents a separate mouse. In c, arginase activity in the lungs of saline- and OVA-challenged mice (n= 4 mice and n= 3 mice, respectively) is shown. Arginase activity was measured in lung lysates with the use of the blood urea nitrogen reagent. As a control, arginase activity in the liver was 1522 ± 183 and 1390 ± 78 nmol/min/mg protein for saline- and OVA-challenged mice, respectively. In d, putrescine levels in the whole lungs of saline- and OVA-challenged mice (n= 4 mice and n
arginase activity (21.4 ± 3.4 and 26.2 ± 4.4 nmol/ min/mg protein [n= 4 mice; P> 0.1] after saline and OVA, respectively), consistent with the requirement of an adaptive immune response for arginase induction rather than a primary innate induction mechanism (34). Although co-delivery of OVA with different doses of LPS can have profound effects on OVA-induced experimental asthma (34), our OVA preparation had undetectable levels of LPS.
Our results led us to the view that allergic responses are associated with marked induction of arginine metabolism via arginase. We were interested in prov-ing that products downstream from arginase were actually overproduced in the allergic lung. Recent studies have shown that arginase is the rate-limiting enzyme for biosynthesis of putrescine, and that arginase expression can inhibit cellular apoptosis (35). We therefore examined putrescine levels in the lungs of asthmatic and control mice. Examining the whole lung, we determined that OVA-challenged mice had significantly increased levels of putrescine (14.7 ± 5.6 vs. 32 ± 13 nmol/g tissue [P< 0.05] in saline and OVA, respectively, Figure 3d). The twofold increase in putrescine is remarkable because we are examining whole lung levels of a mediator with distinct subcellu-lar localization in the lung (36).
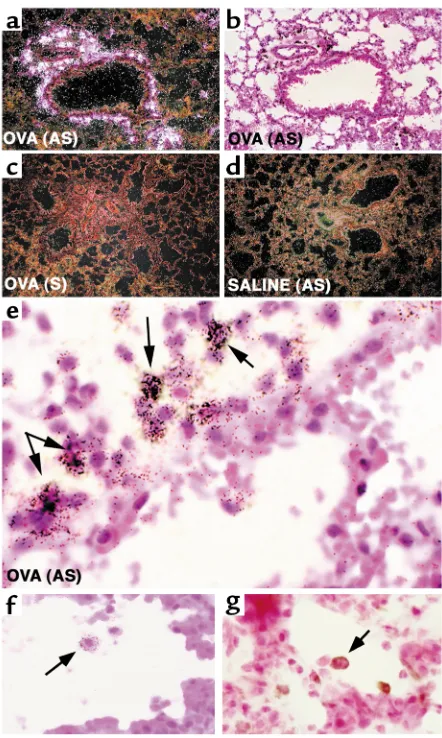
To begin to address the cellular sources of these molecules, we performed in situ hybridization for arginase I mRNA. Antisense staining of asthmatic lung (Figure 4, a and b, and data not shown) revealed high levels of arginase I in the perivascular and peri-bronchial pockets of inflammation. No specific stain-ing with the sense probe in OVA-challenged mice was seen (Figure 4c). Hybridization of the antisense and sense probes in the saline-challenged lung was com-parable with background (Figure 4d and data not shown). There was a specific staining of the antisense probe to a subpopulation of large mononuclear cells with abundant cytoplasm (within the inflammatory infiltrates), most consistent with macrophages (Fig-ure 4, e and f, and data not shown). In addition to analyzing the cellular distribution of arginase I mRNA+cells in the asthmatic lung, we were also
inter-ested in examining arginase expression by immuno-histochemistry. Anti–arginase I immunohistochem-istry revealed a very similar pattern of staining compared with the in situ hybridization studies. Specifically, the majority of staining was present in peribronchial and perivascular pockets of inflamma-tion. Cells with the typical morphology of alveolar macrophages stained positive for arginase I protein (Figure 4g). Notably, saline control animals had unde-tectable arginase protein expression (data not shown). Finally, staining of allergen-challenged lungs with the macrophage marker Mac-3 revealed a similar pattern to arginase I expression (data not shown).
Collectively, these results challenge current para-digms about arginine metabolism in asthmatic responses that have previously focused on production
of NO (37). We propose that arginine is metabolized by arginase, at least in part, in the asthmatic mouse lung. Furthermore, the variable levels of NO seen in asthma may be an indirect manifestation of arginase activity, an enzyme that functionally inhibits NOS by substrate depletion (12, 13). This model is consistent with the caution that has been advised with analysis of expired NO measurements in asthmatics (38).
[image:8.576.311.532.189.558.2]Lung arginase is regulated by Th2 cytokines. Because asth-ma is a Th2-associated process and because IL-4 has
Figure 4
been shown to induce arginase in several cell lines in vitro (e.g., macrophages, smooth muscle cells) (23, 39), we were interested in testing the hypothesis that over-expression of IL-4, particularly in the lungs, was suffi-cient for induction of arginase. Mice that overexpress the IL-4 transgene in pulmonary epithelium (under the control of the Clara cell 10 promoter) have several fea-tures of asthma, including eosinophil-rich inflamma-tory cell infiltrates, mucus production, changes in base-line airway tone (18), and possibly AHR (data not
shown). We hypothesized that arginase mRNA would be induced by the IL-4 transgene. Indeed, IL-4 lung transgenic mice had a marked increase in the level of both arginase isoforms (Figure 5a).
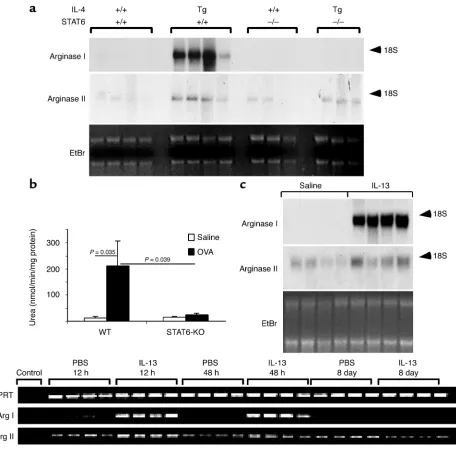
[image:9.576.69.525.47.496.2]IL-4 and IL-13 share similar signaling requirements such as utilization of the IL-4Rαchain and the induc-tion of janus kinase 1 and STAT6. A subset of their responses has been shown to be STAT6 dependent (19, 40). To test the role of STAT6 in the induction of arginase I in vivo, we examined IL-4 lung transgenic
Figure 5
mice that contained wild-type or gene-targeted STAT6. As shown in Figure 5a, whereas IL-4 lung transgenic mice contained abundant arginase I mRNA, in the absence of STAT6, there was a complete loss of the IL-4–induced arginase I mRNA. Interestingly, the IL-4 transgene-induced arginase II mRNA signal was only partially attenuated (if at all) in STAT6-deficient mice (Figure 5a), indicating that arginase II, in contrast to arginase I, was largely STAT6 independent. These find-ings support in vitro studies that have demonstrated shared and distinct signaling requirements for these two isoenzymes (12). We were next interested in deter-mining whether allergen-induced arginase was depend-ent on STAT6. This would determine whether allergen-induced arginase was predominantly downstream from IL-4 and IL-13 signaling. Notably, mice deficient in STAT6 had a 90% reduction in OVA-induced lung arginase activity (Figure 5b), suggesting that arginase I was the predominant inducible isoform in the asth-matic lung. Northern blot analysis indicated that both OVA- and Aspergillus-induced arginase I mRNA were STAT6 dependent (data not shown). Taken together, these findings indicate that induction of arginase dur-ing allergic lung inflammation is largely downstream from IL-4, IL-13, and STAT6. These results are consis-tent with the recent finding that IL-4 and IL-13 inhib-it NO production in macrophages by a STAT6-depend-ent pathway (41). ConsistSTAT6-depend-ent with these findings, the murine arginase I promoter contains a single STAT6 site that is required for response to IL-4 (12).
We were next interested in determining whether lung arginase was also induced by IL-13, a cytokine that has been shown to be critically involved in the development of several features of asthma (10, 42), and to induce arginase in cell lines in vitro (23, 41). To test this hypothesis, we administered IL-13 by repeated intranasal application to anesthetized mice. This protocol induces several features of experimen-tal asthma, including eosinophilic inflammation, chemokine induction, mucus production, and AHR (21, 42). IL-13 administration induced marked levels of arginase I compared with saline-treated control mice (Figure 5c). Consistent with the finding that IL-4 transgenic mice had elevated levels of arginase II mRNA, IL-13 also increased arginase II mRNA levels (Figure 5c). To further analyze the ability of IL-13 to induce arginase, we treated a murine macrophage cell line (J774A.1) with IL-13 in vitro. Indeed, IL-13 induced arginase activity in a dose-dependent (0.5–50 ng/mL) manner (data not shown).
We have previously reported that one dose of intra-tracheal IL-13 induces marked AHR within 12 hours. We were therefore interested in performing a kinetic analysis of IL-13 induction of arginase. Notably, after only one dose of IL-13, the mRNA for the type I iso-form was found to be induced already by 12 hours (Figure 5d); the type II isoform was constitutively pres-ent and induced to a lesser extpres-ent. Induction of arginase was detectable when early AHR developed
(21). The early induction of arginase and AHR precedes leukocyte recruitment (21 and data not shown). On the basis of these results, we speculate that the induction of AHR by IL-13 may be related to the ability of arginase to functionally inhibit production of the bronchodilator NO by substrate depletion (12, 13).
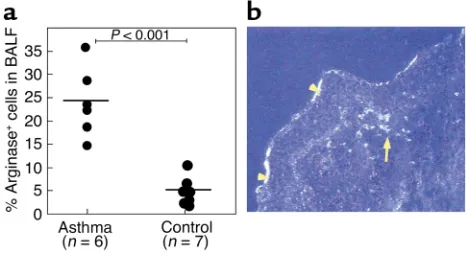
Arginase is induced in human asthma. We were interested in determining whether our findings in experimental asthma in mice were applicable to human asthma. To begin to translate our results into humans, we analyzed arginase I protein expression in bronchoalveolar lavage fluid cells from individuals with asthma and control patients. With the use of immunocytochemistry, there were a significantly higher number of cells expressing arginase I in the asthmatic group (Figure 6a). In both groups, the immunopositive cells were predominantly mononuclear cells with macrophage morphology. A small population of immunopositive granulocytes was present in the asthmatic group (data not shown).
Finally, we performed in situ hybridization on bronchial biopsy specimens from patients with asthma. Arginase I mRNA+cells were strongly detected in the
asthmatic lung but were almost completely unde-tectable in control individuals (n= 4 asthmatic and 4 control individuals). No signal was seen with the con-trol sense probe (data not shown). Similar to the results with the mouse models, staining was observed in sub-mucosal inflammatory cell infiltrates (Figure 6b). Interestingly, we also observed staining for arginase I mRNA in epithelial cells (Figure 6b).
Discussion
[image:10.576.304.537.477.606.2]We have carried out DNA microarray profile analysis of mice undergoing experimental asthma. By using two established models of experimental asthma, we
Figure 6
Arginase I protein expression in human asthma. Fiberoptic bron-choscopy of allergic asthmatics and healthy controls was conducted, and BALF was analyzed for arginase I by immunohistochemistry (a). The number of immunopositive cells, expressed as a percentage of total cells, is shown. In b, a representative dark field illumination (blue filter, 200× original magnification) of arginase I mRNA in situ hybridization of cryostat section from an asthmatic biopsy specimen by using a S35-labeled RNA probe is shown. Signal was detected
identified genes that were significantly dysregulated in the allergic response. Our data show that 6.5% of the tested genome was dysregulated during induction of experimental asthma. We demonstrate that the major-ity of induced genes were similar between the two aller-gen-challenged models, implicating common path-ways and allowing us to define a set of asthma signature genes. At the same time, we report that a large subset of the identified genome is specific to each experimental model, indicating significant genetic diversity despite similar apparent asthma phenotypes. These data have significant medical implications because they suggest that clinically similar patients may have large differences in molecular pathogenesis of their individual disease. As such, DNA transcript profiling may eventually provide greater predictive value than present phenotypic markers (e.g., degree of eosinophilia, AHR, or histopathology).
We were struck by the finding that the gene for arginase I was reproducibly present among the aller-gen-induced genes. In addition, the genes for arginase II and the L-arginine transporter, CAT2, were increased,
providing further evidence for an important role for arginine metabolism in allergic airway responses. On the basis of the potential importance of L-arginine
metabolism via arginase in the pathogenesis of asthma, and the association of arginase with in vitro Th2 responses, we focused our attention on the regulation and role of arginase in experimental asthma. In situ mRNA hybridization analysis of the lung from asth-matic mice revealed marked induction of arginase I mRNA in the peribronchial and perivascular inflam-matory sites with staining in multiple cell types, espe-cially macrophages. In addition, arginase expression in the lung was induced by IL-4 and IL-13 in a STAT6-dependent manner. Although numerous factors may influence gene expression (e.g., technical procedures, adjuvants, and routes of antigen administration), our data indicate that the arginase pathway is not depend-ent on these factors because arginase is induced by both asthma models and by Th2 cytokine overexpres-sion (by pharmacologic and transgenic delivery). These findings are supported by the recent observation that NOS and arginase are differentially regulated during Th1- and Th2-associated granulomatous responses in mice, respectively (43). Finally, we demonstrate that arginase is induced in human asthma supporting the importance of this pathway in human disease. Inter-estingly, in situ hybridization in the human asthmatic lung revealed expression in submucosal inflammatory cells and also airway epithelium, further extending our findings from the mouse. Notably, airway epithelium is a major location of arginine and polyamines in the asthmatic lung (36, 44).
We propose that arginase induction by IL-4/IL-13 signaling is not just a marker of allergic airway responses, but that arginase is involved in the patho-genesis of multiple aspects of asthma. Previous stud-ies have demonstrated the involvement of arginine
metabolism pathways in asthma, but these studies have primarily focused on metabolism by NOS. Our study is the first to demonstrate the involvement of arginase and the arginine transporter, CAT2. Our demonstration that CAT2 is overexpressed is consis-tent with reports of the elevated levels of arginine and nitrotyrosine in airway epithelial cells of asthmatic subjects (44, 45). Previous studies have shown that pharmacologic inhibition of NOS enhances agonist-induced airway constriction in vitro (46, 47) and in vivo (46, 48, 49). In addition, in a guinea pig model of asthma, a specific deficiency of bronchodilating cNOS-derived NO has been shown to contribute to AHR (47, 48, 50). It has been suggested that the NO deficiency associated with experimental asthma is attributable, at least in part, to the ability of eosinophil cationic proteins to inhibit L-arginine uptake by
macrophages (51). Our current findings suggest that the NO deficiency associated with asthma may be largely mediated by arginase induction. By regulating the availability of L-arginine for NOS (12), arginase
induction may have an important impact on the induction of AHR. It is interesting to note that IL-13–induced AHR occurs in a time frame that paral-lels arginase induction, suggesting that the ability of IL-13 to promote AHR may be directly dependent on arginase induction. This may be particularly impor-tant because IL-13 has been recently shown to be a major effector cytokine in asthma pathogenesis (10, 42). Notably, the mechanism by which IL-13 induces AHR has been unclear; our results draw attention to the ability of IL-13 to regulate arginase as a possible mechanism of AHR. In addition to affecting AHR, we propose that arginase downstream products (proline and polyamines) are also involved in asthma patho-genesis. Indeed, we have found elevated levels of putrescine in the asthmatic murine lung, and elevated levels of polyamines have been reported in the serum of patients with asthma (52), corroborating the pro-duction of biologically active mediators downstream from arginase. Interestingly, polyamines have con-tractile activity on smooth muscle (53, 54), possibly implicating them in asthma-associated AHR. Poly-amines are present in multiple cell types in the lung (including airway epithelium, smooth muscle cells, and macrophages) (36). The ability of polyamines to affect multiple processes, including cell survival, cell proliferation, and mucus production (55, 56), indi-cates that they may have numerous functions in sever-al cell types present in the asthmatic lung.
limiting substrate for collagen synthesis (57, 58). Under these conditions, it is believed that extracellu-lar L-ornithine and proline, secreted from arginase
expressing cells (e.g., macrophages) are transported into fibroblasts, where they subsequently become incorporated into collagen (57, 58).
In summary, we have described a pathway (involving arginine metabolism by arginase) not previously exam-ined in the context of allergic airway inflammation. Our results challenge the conventional view that argi-nine is primarily metabolized by NOS in asthmatic responses; rather, we propose that significant metabo-lism occurs by arginase, and that this process has important ramifications on the manifestations of dis-ease. As such, this new pathway may represent an important therapeutic intervention strategy for the treatment of allergic lung disease.
Acknowledgments
We thank Andrea Lippelman for editorial assistance and Fred Finkelman for helpful discussions and critical review of this manuscript. We are grateful to Sidney Mor-ris for the RG-1 antibody, ChMor-ristopher Karp for per-forming the LPS measurements, and to Debra Donald-son for IL-13. This work was supported in part by the American Heart Association Scientist Development (N. Zimmermann) and Post-doctorate fellowship (N. King) grants; NIH grants R01 AI42242-05, AI45898-04, and AI53479-01 (all to M.E. Rothenberg); the Human Fron-tier Science Program (M.E. Rothenberg, P.S. Foster); International Life Sciences Institute (M.E. Rothenberg); and Burroughs Wellcome Fund (M.E. Rothenberg).
1. Holgate, S.T. 1999. The epidemic of allergy and asthma. Nature. 402:B2–B4.
2. Umetsu, D.T., McIntire, J.J., Akbari, O., Macaubas, C., and DeKruyff, R.H. 2002. Asthma: an epidemic of dysregulated immunity. Nat. Immunol.3:715–720.
3. Broide, D.H. 2001. Molecular and cellular mechanisms of allergic dis-ease. J. Allergy Clin. Immunol.108:S65–S71.
4. Busse, W.W., and Lemanske, R.F., Jr. 2001. Asthma. N. Engl. J. Med. 344:350–362.
5. Lee, N.A., Gelfand, E.W., and Lee, J.J. 2001. Pulmonary T cells and eosinophils: coconspirators or independent triggers of allergic respi-ratory pathology? J. Allergy Clin. Immunol.107:945–957.
6. Robinson, D.S., et al. 1992. Predominant TH2-like bronchoalveolar T-lymphocyte population in atopic asthma. N. Engl. J. Med. 326:298–304.
7. Drazen, J.M., Arm, J.P., and Austen, K.F. 1996. Sorting out the cytokines of asthma. J. Exp. Med.183:1–5.
8. Ray, A., and Cohn, L. 1999. Th2 cells and GATA-3 in asthma: new insights into the regulation of airway inflammation. J. Clin. Invest. 104:985–993.
9. Bochner, B.S., Undem, B.J., and Lichtenstein, L.M. 1994. Immunolog-ical aspects of allergic asthma. Annu. Rev. Immunol.12:295–335. 10. Wills-Karp, M. 2001. IL-12/IL-13 axis in allergic asthma. J. Allergy Clin.
Immunol.107:9–18.
11. Barnes, P.J. 2000. New directions in allergic diseases: mechanism-based anti-inflammatory therapies. J. Allergy Clin. Immunol.106:5–16. 12. Morris, S.M., Jr. 2002. Regulation of enzymes of the urea cycle and
arginine metabolism. Annu. Rev. Nutr.22:87–105.
13. Mills, C.D. 2001. Macrophage arginine metabolism to ornithine/urea or nitric oxide/citrulline: a life or death issue. Crit. Rev. Immunol. 21:399–425.
14. Mishra, A., Weaver, T.E., Beck, D.C., and Rothenberg, M.E. 2001. Inter-leukin-5–mediated allergic airway inflammation inhibits the human surfactant protein C promoter in transgenic mice. J. Biol. Chem. 276:8453–8459.
15. Mehlhop, P.D., et al. 1997. Allergen-induced bronchial hyperreactivity
and eosinophilic inflammation occur in the absence of IgE in a mouse model of asthma. Proc. Natl. Acad. Sci. U. S. A.94:1344–1349. 16. Kurup, V.P., Seymour, B.W., Choi, H., and Coffman, R.L. 1994.
Partic-ulate Aspergillus fumigatusantigens elicit a TH2 response in BALB/c mice. J. Allergy Clin. Immunol.93:1013–1020.
17. Zimmermann, N., et al. 2000. Murine eotaxin-2: a constitutive eosinophil chemokine induced by allergen challenge and IL-4 overex-pression. J. Immunol.165:5839–5846.
18. Rankin, J.A., et al. 1996. Phenotypic and physiologic characterization of transgenic mice expressing interleukin 4 in the lung: lymphocytic and eosinophilic inflammation without airway hyperreactivity. Proc. Natl. Acad. Sci. U. S. A.93:7821–7825.
19. Shimoda, K., et al. 1996. Lack of IL-4–induced Th2 response and IgE class switching in mice with disrupted Stat6 gene. Nature.380:630–633. 20. Pope, S.M., et al. 2001. IL-13 induces eosinophil recruitment into the lung by an IL-5- and eotaxin-dependent mechanism. J. Allergy Clin. Immunol.108:594–601.
21. Yang, M., et al. 2001. Interleukin-13 mediates airways hyperreactivity through the IL-4 receptor-alpha chain and STAT-6 independently of IL-5 and eotaxin. Am. J. Respir. Cell Mol. Biol.25:522–530.
22. Matthews, A.N., et al. 1998. Eotaxin is required for the baseline level of tissue eosinophils. Proc. Natl. Acad. Sci. U. S. A.95:6273–6278. 23. Wei, L.H., Jacobs, A.T., Morris, S.M., Jr., and Ignarro, L.J. 2000. IL-4 and
IL-13 upregulate arginase I expression by cAMP and JAK/STAT6 path-ways in vascular smooth muscle cells. Am. J. Physiol. Cell Physiol. 279:C248–C256.
24. Wei, L.H., Wu, G., Morris, S.M., Jr., and Ignarro, L.J. 2001. Elevated arginase I expression in rat aortic smooth muscle cells increases cell proliferation. Proc. Natl. Acad. Sci. U. S. A.98:9260–9264.
25. Li, H., et al. 2002. Activities of arginase I and II are limiting for endothelial cell proliferation. Am. J. Physiol. Regul. Integr. Comp. Physiol. 282:R64–R69.
26. Lopatin, A.N., Shantz, L.M., Mackintosh, C.A., Nichols, C.G., and Pegg, A.E. 2000. Modulation of potassium channels in the hearts of trans-genic and mutant mice with altered polyamine biosynthesis. J. Mol. Cell Cardiol.32:2007–2024.
27. American Thoracic Society. 1987. Standards for the diagnosis and care of patients with chronic obstructive pulmonary disease (COPD) and asthma. Am. Rev. Respir. Dis.136:225–244.
28. Olivenstein, R., Taha, R., Minshall, E.M., and Hamid, Q.A. 1999. IL-4 and IL-5 mRNA expression in induced sputum of asthmatic subjects: comparison with bronchial wash. J. Allergy Clin. Immunol.103:238–245. 29. Hamid, Q. 1997. Immunohistochemistry. In Allergy and allergic disease. A.B. Kay, editor. Blackwell Science Ltd. London, United Kingdom. 775–778.
30. Rothenberg, M.E., MacLean, J.A., Pearlman, E., Luster, A.D., and Leder, P. 1997. Targeted disruption of the chemokine eotaxin partial-ly reduces antigen-induced tissue eosinophilia. J. Exp. Med. 185:785–790.
31. Kurup, V.P., Mauze, S., Choi, H., Seymour, B.W., and Coffman, R.L. 1992. A murine model of allergic bronchopulmonary aspergillosis with elevated eosinophils and IgE. J. Immunol.148:3783–3788.
32. Iyer, R., et al. 1998. The human arginases and arginase deficiency.
J. Inherit. Metab. Dis.21:86–100.
33. Elias, J.A., Zhu, Z., Chupp, G., and Homer, R.J. 1999. Airway remodel-ing in asthma. J. Clin. Invest.104:1001–1006.
34. Eisenbarth, S.C., et al. 2002. Lipopolysaccharide-enhanced, toll-like receptor 4-dependent T helper cell type 2 responses to inhaled antigen.
J. Exp. Med.196:1645–1651.
35. Esch, F., et al. 1998. Purification of a multipotent antideath activity from bovine liver and its identification as arginase: nitric oxide-inde-pendent inhibition of neuronal apoptosis. J. Neurosci.18:4083–4095. 36. Hoet, P.H., and Nemery, B. 2000. Polyamines in the lung: polyamine uptake and polyamine-linked pathological or toxicological conditions.
Am. J. Physiol. Lung Cell Mol. Physiol.278:L417–L433.
37. Kharitonov, S.A., and Barnes, P.J. 2000. Clinical aspects of exhaled nitric oxide. Eur. Respir. J.16:781–792.
38. Hunt, J., and Gaston, B. 2000. Airway nitrogen oxide measurements in asthma and other pediatric respiratory diseases. J. Pediatr.137:14–20. 39. Munder, M., et al. 1999. Th1/Th2-regulated expression of arginase iso-forms in murine macrophages and dendritic cells. J. Immunol. 163:3771–3777.
40. Ihle, J.N. 2001. The Stat family in cytokine signaling. Curr. Opin. Cell Biol.13:211–217.
41. Rutschman, R., et al. 2001. Cutting edge: Stat6-dependent substrate depletion regulates nitric oxide production. J. Immunol.166:2173–2177. 42. Grunig, G., et al. 1998. Requirement for IL-13 independently of IL-4 in
experimental asthma. Science.282:2261–2263.
43. Hesse, M., et al. 2001. Differential regulation of nitric oxide synthase-2 and arginase-1 by type 1/type 2 cytokines in vivo: granulomatous pathology is shaped by the pattern of L-arginine metabolism.
44. Guo, F.H., et al. 2000. Molecular mechanisms of increased nitric oxide (NO) in asthma: evidence for transcriptional and post-translational regulation of NO synthesis. J. Immunol.164:5970–5980.
45. MacPherson, J.C., et al. 2001. Eosinophils are a major source of nitric oxide-derived oxidants in severe asthma: characterization of pathways available to eosinophils for generating reactive nitrogen species.
J. Immunol.166:5763–5772.
46. Nijkamp, F.P., van der Linde, H.J., and Folkerts, G. 1993. Nitric oxide synthesis inhibitors induce airway hyperresponsiveness in the guinea pig in vivo and in vitro. Role of the epithelium. Am. Rev. Respir. Dis. 148:727–734.
47. De Boer, J., et al. 1996. Deficiency of nitric oxide in allergen-induced airway hyperreactivity to contractile agonists after the early asthmatic reaction: an ex vivo study. Br. J. Pharmacol.119:1109–1116. 48. Schuiling, M., et al. 1998. Role of nitric oxide in the development and
partial reversal of allergen-induced airway hyperreactivity in conscious, unrestrained guinea-pigs. Br. J. Pharmacol.123:1450–1456. 49. Taylor, D.A., McGrath, J.L., Orr, L.M., Barnes, P.J., and O’Connor, B.J.
1998. Effect of endogenous nitric oxide inhibition on airway respon-siveness to histamine and adenosine-5′-monophosphate in asthma.
Thorax.53:483–489.
50. Schuiling, M., Meurs, H., Zuidhof, A.B., Venema, N., and Zaagsma, J. 1998. Dual action of iNOS-derived nitric oxide in allergen-induced air-way hyperreactivity in conscious, unrestrained guinea pigs. Am. J. Respir. Crit. Care Med.158:1442–1449.
51. Hammermann, R., et al. 1999. Cationic proteins inhibit L-arginine
uptake in rat alveolar macrophages and tracheal epithelial cells. Impli-cations for nitric oxide synthesis. Am. J. Respir. Cell Mol. Biol. 21:155–162.
52. Kurosawa, M., Shimizu, Y., Tsukagoshi, H., and Ueki, M. 1992. Elevat-ed levels of peripheral-blood, naturally occurring aliphatic polyamines in bronchial asthmatic patients with active symptoms. Allergy. 47:638–643.
53. Nilsson, B.O., and Hellstrand, P. 1993. Effects of polyamines on intra-cellular calcium and mechanical activity in smooth muscle of guinea-pig taenia coli. Acta. Physiol. Scand.148:37–43.
54. Sward, K., Pato, M.D., Nilsson, B.O., Nordstrom, I., and Hellstrand, P. 1995. Polyamines inhibit myosin phosphatase and increase LC20 phosphorylation and force in smooth muscle. Am. J. Physiol. 269:C563–C571.
55. Thomas, T., and Thomas, T.J. 2001. Polyamines in cell growth and cell death: molecular mechanisms and therapeutic applications. Cell Mol. Life Sci.58:244–258.
56. Ma, L., Wang, W.P., Chow, J.Y., Lam, S.K., and Cho, C.H. 2000. The role of polyamines in gastric mucus synthesis inhibited by cigarette smoke or its extract. Gut.47:170–177.
57. Albina, J.E., Abate, J.A., and Mastrofrancesco, B. 1993. Role of ornithine as a proline precursor in healing wounds. J. Surg. Res. 55:97–102.