Munich Personal RePEc Archive
Interdependence in Multinational
Production Networks
Chen, Maggie
George Washington University
2009
Online at
https://mpra.ub.uni-muenchen.de/28485/
Interdependence in Multinational Production Networks
Maggie Xiaoyang Cheny
Department of Economics and Elliott School of International A¤airs George Washington University
January 2011
Abstract
Most multinational …rms today operate multilateral production networks. Most existing empirical analyses, however, have focused on …rms’ choice between producing at home and investing overseas. This paper uses detailed French multinational subsidiary data to examine the e¤ect of existing production net-works on multinationals’ entry decisions. The paper …nds strong horizontal and vertical interdependence across multinationals’ foreign production locations, but little interdependence between home and foreign production when third-country e¤ects are taken into account. This result constitutes a sharp contrast to the conventional emphasis, and highlights the importance of investigating foreign direct investment in the context of multinational production networks.
Key words: multinational …rm, production network, interdependence, entry decision, trade cost, input-output linkage
JEL codes: F23, D21
I am very grateful to the editor, Werner Antweiler, and two anonymous referees for valuable comments and suggestions. I also thank Ron Davies, Jonathan Eaton, Peter Egger, Jim Markusen, Keith Maskus, Mike Moore, Andreas Waldkirch, Stephen Yeaple, Tony Yezer, and participants in the 2008 Empirical Investigation of International Trade (EIIT) Conference, 2009 Midwest International Trade Group Meeting, and 2009 Econometric Society Summer Meeting for helpful feedback and discussions. Research support from the George Washington University Center for International Business Education and Research (CIBER) is acknowledged. An earlier version of this paper appeared as a GW Institute for International Economic Policy working paper.
1
Introduction
Most multinational corporations (MNCs) today operate multilateral production networks. French multinationals, for example, invested in, on average, 3.8 foreign countries in 2007, an increase of 0.9 country per …rm compared to 2005. Yet the vast empirical literature of multinational …rms has largely ignored the multilateral nature of MNC production, focus-ing instead on the relationship between home-country production and foreign investment. Most studies in the literature assume that multinational …rms’ decisions to invest in for-eign countries are independent of their existing production networks in third countries, an assumption increasingly at odds as multinationals expand production around the world.
This paper examines the e¤ect of third-country production networks on multinationals’ entry decisions using a rich dataset that provides detailed location, ownership, and pro-duction information for French manufacturing …rms’ foreign subsidiaries in 2005 and 2007. These data are used to identify the structure of individual …rms’ production networks around the world and the change of the networks over time. They are also used to establish intra-…rm linkages, in particular, the input-output relationships of subsidiaries’ production activities, thereby making it possible to distinguish the nature of interdependence among multinationals’ foreign subsidiaries.
Figure 1, for example, plots the geographic distribution of Renault’s global production network in 2007. Two observations emerge in this …gure. First, Renault owns subsidiaries in more than 10 countries outside of France. Second, Renault segments production across for-eign production locations, producing components in countries like Argentina, South Korea, and Spain (represented by the darker area) and performing end processes in countries like Russia and Colombia (represented by the lighter area). These observations are not exclusive to Renault. French multinationals had abroad in 2007, on average, 0.72 intermediate pro-duction subsidiaries (producing intermediate inputs required for …nal-good propro-duction) and 2.49 …nal-good production subsidiaries (producing …nal products). It is clear that multi-nationals’ investment decisions can no longer be viewed as a choice between producing at home and investing abroad, but involve, instead, networks of vertically linked subsidiaries.
[Figure 1 about here]
to large markets. This …nding, labeled as the market potential e¤ect, captures the impor-tance of host-country market potential. Finally, the paper …nds signi…cant interdependence between intermediate and …nal-good production subsidiaries. Speci…cally, multinationals tend to locate …nal-good production so as to minimize the cost of importing intermedi-ate inputs from existing intermediintermedi-ate production subsidiaries. Similarly, MNCs are more likely to select countries with better access to existing …nal-good production subsidiaries as intermediate production locations. This type of interaction, referred to in the paper as ver-tical interdependence, is shown to increase in the extent of input-output linkages between subsidiaries.
The strong interdependence between MNCs’ foreign production locations contrasts sharply with the little evidence of interdependence between multinationals’ production at home and new investments abroad. The estimated relationship between foreign investment and home-country production becomes insigni…cant in the paper when third-country net-work factors are taken into account. This result is robust to the various speci…cations used to address omitted variable bias and potential endogeneity of network factors. In a departure from the existing literature, the result suggests that assuming away the interdependence of foreign production locations is likely to yield biased estimates for the relationship be-tween home-economy performance and FDI activities, and calls for reconsideration of the conventional speci…cation to take into account the e¤ect of third-country networks.
Findings in this study also convey important messages to host-country policy makers. First, given the vertical interdependence between intermediate and …nal-good production, trade policies like lower import tari¤s on intermediate inputs can a¤ect countries’ attractive-ness as …nal-good production locations. Second, FDI ‡ows to third countries can mediate a host country’s ability to attract multinationals. This cross-country spillover can be either positive or negative depending on the linkages of FDI ‡ows.
This paper is closely related to a growing theoretical literature led by Yeaple (2003a), Ekholm, Forslid and Markusen (2007), and Bergstrand and Egger (2008) that applies FDI modeling to a three-country framework. The existing literature on FDI, including the sem-inal work of Markusen (1984) and Helpman (1984), and in‡uential empirical contributions by Brainard (1997), Carr, Markusen and Maskus (2001), Yeaple (2003b), Helpman, Melitz and Yeaple (2004), and Hanson, Mataloni and Slaughter (2005), stresses the importance of market access and comparative advantage in multinationals’ incentives to invest abroad.1 Yeaple (2003a), Ekholm, Forslid and Markusen (2007), and Bergstrand and Egger (2008) show that the combination of market-access and comparative-advantage motives can lead to export-platform FDI whereby multinational …rms adopt a host country as a platform from which to serve third nations. This prediction suggests that multinationals’ investment decisions cannot be viewed as a binary choice between exporting from home and investing
abroad, but rather engages other, third nations.
Most of the empirical literature has not taken into account the third-country e¤ect, much less the interdependence between multinationals’ foreign production locations. The following few studies took the step of examining the determinants of export-platform FDI. Head and Mayer (2004) show that third-country market demand plays a signi…cant role in countries’ ability to attract multinational …rms. They …nd that Japanese multinationals are more likely to locate in regions proximate to large markets. Baltagi, Egger and Pfaf-fermayr (2007) consider a broader set of third-country characteristics and …nd most of the characteristics exert a signi…cant e¤ect on the level of U.S. outbound FDI. Chen (2009) examines how a host country’s preferential trade agreements with third nations can a¤ect its receipt of FDI, and …nds that countries integrated with large markets tend to experience an increase in total and export-platform investment.
Blonigen et al. (2007, 2008) were among the …rst to investigate cross-country interde-pendence in FDI. Using sectoral FDI data, Blonigenet al. (2007) examine how investments in third countries a¤ect a country’s receipt of U.S. FDI. They …nd the results to be sensitive to the sample of host countries: the third-country e¤ect can be either insigni…cant or of re-verse signs. Evidence of negative interdependence across proximate host countries, a result consistent with export-platform FDI theory, is found mainly among European OECD mem-bers. Further, taking into account third-country FDI does not alter the estimated e¤ects of traditional FDI determinants. The importance of third-country e¤ects in inbound FDI is shown in Blonigen et al. (2008). The authors …nd a strong parent market proximity e¤ect whereby parent markets’ proximity to large third nations increases the volume of FDI. The e¤ect of third-country FDI in host countries is negative when the sample is restricted to European countries.
in previous studies. Speci…cally, the estimated interdependence between FDI and home-country production disappears when third-home-country network variables are included.
The rest of the paper is organized as follows. Section 2 examines attributes of French MNC production networks. A simple, three-country theoretical framework to motivate the empirical analysis is presented in Section 3, and the econometric methodology and data sources are described in Sections 4 and 5, respectively. The main econometric results are presented in Section 6, the sensitivity analyses in Section 7. Section 8 concludes.
2
Attributes of French MNC Production Networks
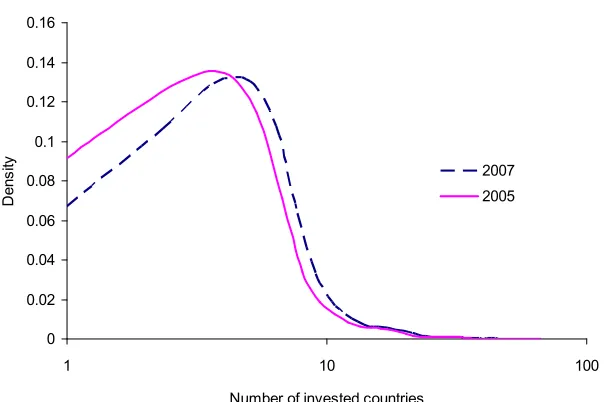
French multinational …rms’ production networks exhibit a number of notable attributes. First, consider the distribution of French multinationals by the number of countries in which investment occurs (Figure 2). In 2007, most French MNCs concentrated foreign pro-duction in three or more countries, with some spreading to as many as 63. Comparing 2007 with 2005, the average size of production networks increased by 0.93. Second, …nal-good production subsidiaries accounted for a large fraction of French MNCs’ foreign production locations.2 The average number of countries in which …rms perform …nal-good production,
2.49, is signi…cantly greater than the average number of countries in which …rms engage in intermediate production (0.72).
[Figure 2 about here]
Now consider the geographic density of French MNCs’ production networks. Based on the distance data obtained for each pair of subsidiaries (owned by the same French MNCs), the closest two are 66 kilometers apart (located in Austria and Slovakia), the most distant pair 19,845 kilometers apart (located in Estonia and New Zealand). Most subsidiaries are within 6,126 kilometers of one another, the mean distance being around 6,000 kilometers. At the …rm level, while a signi…cant percentage of French MNCs operate relatively dispersed networks with subsidiaries located distant from one another, many MNCs concentrate their subsidiaries geographically, clustered in neighboring countries such as EU members.
Comparing the distance of …nal-good production locations with that of vertically linked subsidiaries suggests that the geographic density of production networks varies signi…cantly with the input-output linkages between subsidiaries. Subsidiaries with input-output pro-duction relationships tend to be located closer to each other than subsidiaries that perform duplicate …nal-good production. The average distance between vertically linked subsidiaries is around 5,159 kilometers, signi…cantly less than the average distance between …nal-good production subsidiaries.
2Section 4 describes how …nal-good and intermediate production subsidiaries are identi…ed for purposes
The above observations apply as well to tari¤s, which are obtained for each pair of subsidiary countries. For more than 30 percent of French MNC subsidiary pairs, the tari¤ rates between their subsidiary countries are zero. For more than 50 percent, the tari¤ rates are 7 percent or lower. At the …rm level, more than 15 percent of French MNCs do not need to pay tari¤s when exporting from one subsidiary country to another, and 50 percent face an average of 6 percent or lower tari¤s. This suggests that French MNCs’ choices of foreign production locations are not always driven by the tari¤-jumping motive; a large percentage of French MNCs can trade freely within their production networks.
Tari¤ rates, like distance, tend to be lower between vertically linked subsidiaries than between …nal-good production locations. The average tari¤ rates for French MNCs to import intermediate inputs to …nal-good production subsidiaries are 1.5 percentage points lower than the 4.5-percent average tari¤ rates between …nal-good production subsidiaries.
3
Theoretical Motivation
As a prelude to the econometric analysis, a stylized theoretical framework is adopted in this section to motivate the empirical hypotheses.
3.1 General setup
Suppose the world consists of N countries N =f1;2; :::; Ng. In each country, a certain amount of the representative consumer’s expenditure, denoted as Ej (j 2 N), is allocated
to the industry of di¤erentiated products, within which the consumer has a utility function with constant elasticity of substitution (CES). Maximizing the CES utility function subject to the consumer’s expenditure level yields the demand function for each representative variety: qij =Yjpij ;whereqij denotes the quantity of the di¤erentiated product produced
by …rms in country i and sold to destination country j, Yj Ej=Prp1rj denotes the
demand level in country j with r representing the set of varieties, pij denotes the product
price, and 1=(1 ) > 1 the demand elasticity. Note that pij = ij pi, where pi is
country i’s product market price and ij > 1 is the iceberg trade cost of exporting from
countryito countryj (with ii= 1).
Each …rm produces a di¤erent brand of the di¤erentiated product. Given the interest of the present study, it is assumed that country 1’s …rms can produce …nal goods in any country and …rms in the other countries produce only at home and serve foreign markets via exports. Firms must pay a plant-level …xed cost F for each …nal-good production location and produce one unit of intermediate input for each unit of …nal good.3 Country
3Given this paper’s focus on intra-…rm linkages, the option of purchasing intermediate inputs from
1’s …rms can produce the intermediate input, as they can the …nal product, in any country. For simplicity, the plant-level …xed cost for intermediate-input production, denoted by G, is assumed to be su¢ciently large that …rms choose to perform intermediate production in only one location.4 Intermediate production subsidiaries are assumed to sell inputs to …nal-good production subsidiaries at mk ki, where mk is the marginal cost of producing
intermediate inputs and ki is the cost of exporting intermediate inputs from country kto
countryi.
The goal of this model is to examine …rms’ decisions to invest in …nal-good and interme-diate production given an existing production network. LetF ini be an indicator variable
that equals 1 if a …rm has …nal-good production in country iand similarly Inti be an
in-dicator variable that identi…es the existence of intermediate production in countryi. Each …rm’s production network can then be characterized as g fF ini; Intig where i2 N. A
…rm is de…ned as a national …rm if it has no subsidiary abroad, and a multinational if it has at least one foreign subsidiary. The set of countries in which a …rm performs …nal-good production is denoted by NF in(g) = fi 2 N : F ini = 1g and the set of countries with
intermediate production is represented by NInt(g) = fi 2 N : Inti = 1g. The numbers
of countries in which …rms perform …nal-good and intermediate production are denoted, respectively, bynF in(g) and nInt(g).
Maximizing pro…ts yields:
pi =
ci+mk ki
; (1)
whereci is the marginal cost of producing the …nal good in countryi. Given equation (1),
the operating pro…t a …rm will earn by producing the intermediate input in countryk and …nal good in country iand selling to destination countryj is
ij(g) = [(ci+mk ki) ij]1 Yj (2)
where (1 ) 1.
It is clear that ij is an increasing function of countryj’s demand (Yj) and a decreasing
function of the …nal good marginal cost (ci) and the trade cost to ship the …nal good from
country i to country j ( ij). Moreover, ij decreases in the marginal cost of producing
the intermediate input (mk) and the trade cost of shipping the input to the …nal-good
production location ( ki).
Suppose the …rm has chosen NF in(g) as the set of locations in which to produce the
Venables (1996), Venables (1996), and Puga and Venables (1997). The empirical analysis undertaken in this paper attempts to control for these factors using …rm …xed e¤ect, as …rm-level data that identify intermediate-input suppliers are largely missing.
4Although roughly in alignment with the observation that French multinationals have, on average, fewer
…nal good and country k as the location in which to produce the intermediate input, that is,NInt(g) =fkg. The total pro…t function will then be given by:
(g) = X i2NF in(g)
(ci+mk ki)1 Yi (3)
+ X
j2N nNF in(g)
max
i2NF in(g) [(ci+mk ki) ij]
1 Y
j nF in(g)F G:
In this equation, the …rst term represents the operating pro…t from domestic sales (in countries with …nal-good production), the second term represents the operating pro…t from export sales (in countries without …nal-good production), and the last two the …xed costs of …nal-good and intermediate production (which increase as …rms increase the number of pro-duction locations). Note that export pro…t depends on the choice of export-platform coun-tries, that is, the …nal-good production locations in NF in(g) from which the …rm chooses
to export to each market. Firms will strictly prefer location con…guration g to g if and only if
(g )> (g): (4)
3.2 Final-good production location decision
Given the goal of examining …rms’ investment decisions in a given production network, suppose the current production network consists of a …nal-good production subsidiary in countryei and an intermediate production subsidiary in country ek, that is, g0 = fF inei = 1; Intek= 1g.
First, consider the decision to establish a new …nal-good production subsidiary in coun-try i, denoted by F ini. If F ini = 1, the production network will change from g0 to
g1 =fF ini=F inei = 1; Intek= 1g. Firms will establish a …nal-good production subsidiary
iniif and only if
(g1)> (g0): (5)
Given equation (3), the above condition implies5
(ci+mek eki)1 Mi>(cei+mek ekei)1 ( eii1 Yi+M e
ei) + F; (6)
whereMi Yi+Mie Yi+Pj2N nNF in(g1)( ij
1 Y
j)represents countryi’s market potential,
which includes countryi’s domestic market sizeYi and the (trade-cost weighted) aggregate
size of third-country export markets, denoted by Mie, in which the …rm does not have
5To simplify the theoretical analysis, …rms are assumed to adopt the new …nal-good production subsidiary
…nal-good production. Letting eki mek=ci denote the extent of vertical linkage between
intermediate input and …nal good, the above expression can be re-written as:
c1i (1 + eki eki)1 Mi>(cei+mke ekei)1 ( eii1 Yi+Meie) + F: (7)
As monotonic transformations and terms such as cei, mek, ekei, Mee
i and F do not a¤ect
the ordering of host countriesi, condition (7) can be simpli…ed (and taken natural logs) to obtain the following empirical speci…cation:
Pr [ F ini = 1jg0] = [ 1lnci+ 2lnYi+ vln(1 + eki eki)
| {z }
vertical
+ mlnMi
| {z }
market potential
+| {z }hln eii
horizontal
+"]: (8)
In this speci…cation,Pr [ F ini= 1jg0]represents the probability of a …rm establishing a new …nal-good production location in countryigiven the …rm’s existing production network
g0 and [:] is the cumulative probability function. The terms ln(1 + eki eki) and ln eii
represent, respectively, the trade costs to import from the …rm’s existing intermediate and …nal-good production locations, and capture the vertical and horizontal interdependence in the network. The variablelnMi represents countryi’s market potential given the …rm’s
…nal-good production network. The residual"captures all the remaining factors such ascei,
mek, ekei, andMe
ei, attributes of existing production locations that are invariant with country
i’s attributes.
The e¤ect of existing production networks is expected to vary with the nature of sub-sidiaries. The e¤ect of vertically linked subsidiaries is expected to satisfy v < 0, that is,
…rms have a greater incentive to establish …nal-good production subsidiaries in countries with lower costs of importing intermediate inputs, especially when there is a strong verti-cal linkage between intermediate inputs and …nal goods (i.e., a large eki). The expected e¤ect of existing …nal-good production networks is h > 0, that is, …rms are more likely
to expand horizontally in countries with higher costs of importing …nal goods. Finally, the host-country market potential is predicted to have a positive e¤ect, that is, m >0.
3.3 Intermediate production location decision
Now consider the intermediate production location decision. Given network g0 (where
F inei = 1; Intek = 1), …rms will establish an intermediate production subsidiary in country
iand move to network g2 =fF inei= 1; Inti = 1g if and only if
Given equation (3), this is equivalent to
mek ekei > mi iei: (10)
Taking natural logs of the above condition yields the following empirical speci…cation:
Pr [ Inti= 1jg0] = [ 1lnmi+| {z }vln iei
vertical
+ hln ekei
| {z }
horizontal
+"]: (11)
In this expression, Pr [ Inti = 1jg0] denotes the probability of a …rm establishing an in-termediate production location in countryigiven its existing production network g0. The model predicts v <0 (incentives to produce intermediate inputs are greater in countries
with lower costs of exporting to …rms’ existing …nal-good production locations, i.e., a lower
iei), and h >0 (…rms are more likely to invest in intermediate production when existing
intermediate production subsidiaries have relatively high costs of exporting to …nal-good production locations).6 The residual" captures remaining factors such asmek.
4
Econometric Framework and Methodology
Based on the theoretical section, an econometric framework that examines …rms’ invest-ment decisions as a function of existing production networks is employed for the empirical analysis.
4.1 Econometric framework
4.1.1 Final-good production location decision
The decision of individual …rms to invest in …nal-good production is examined using a speci…cation built on equation (8):
Pr [ F ini = 1] = [ XF in;i+ (12)
HorizontalF in;i+V erticalF in;i+M arketP otentialF in;i+"F in;i
where
HorizontalF in = ( h0+ h1WDistF in+ h2WT arif fF in)IF in
V erticalF in = ( v0+ v1WDistInt+ v2WT arif fInt)IInt (13)
M arketP otentialF in = m1lnMDist+ m2lnMT arif f:
6Note that since ln
e
kei is an attribute of …rms’ existing production networks that does not vary with
In the above equation, F ini represents a …rm’s decision to establish a new
…nal-good production subsidiary in country iin 2007, andXF in;irepresents a vector of country
i’s characteristics in 2005 including, for example, domestic market size Yi and marginal
production costsci.
In addition to host-country characteristics, the right-hand side of equation (12) includes three terms that capture the structure of …rms’ existing production networks in 2005. The …rst term,HorizontalF in, measures horizontal interdependence between …nal-good
produc-tion locaproduc-tions. In this term,F in fF in1; :::; F inei; :::; F inNg0 is a vector that identi…es the
existence of …nal-good production in each country in 2005 and IF in is a dummy variable
that equals 1 if F in 6= 0 and 0 otherwise. Two types of trade costs, including transport costs (proxied by distance) and tari¤s, are taken into consideration in constructing the net-work term. Speci…cally,WDistis a weighting matrix composed of the distance between each
pair of countries, i.e., flnDist1i, :::, lnDisteii,:::,lnDistN ig for each country i; WT arif f is
a weighting matrix consisting of the tari¤ rates of importing …nal goods, i.e., flnT arif f1i,
:::,lnT arif feii, :::, lnT arif fN ig for each i. To measure the average trade costs between
…nal-good production locations, the vector F in is scaled by each …rm’s total number of …nal-good production locations, that is, nF in. Section 3.2 predicts that h0 < 0, h1 > 0 and h2 >0, that is, the probability of …rms investing in …nal-good production in a given country increases in that country’s costs of importing …nal goods from …rms’ existing …nal-good production locations.
The second network term in equation (12), i.e., V erticalF in, captures vertical
interde-pendence between intermediate and …nal-good production. In this term, Int fInt1, :::,
Intek; :::,IntNg0 is a vector that identi…es the existence of intermediate production in each
country in 2005 and IInt is a dummy variable that equals 1 if Int 6= 0 and 0 otherwise.
As in the …rst network term, WDist is a distance weighting matrix and WT arif f is a tari¤
weighting matrix composed of, in this case, the tari¤ rates of importing intermediate in-puts. Following equation (8), WDist (and similarly WT arif f) can be alternatively de…ned
as, for each countryi,fln(1 + 1iDist1i),:::,ln(1 + ekiDisteki),:::,ln(1 + N iDistN i)gto take
into account the extent of vertical production linkages between intermediate and …nal-good production. Again, the vector Int is scaled by each …rm’s total number of intermediate production locations, that is, nInt, to obtain average trade costs. Section 3.2 predicts that
v0 > 0, v1 < 0 and v2 < 0, that is, the probability of …rms investing in …nal-good production in a given country decreases in that country’s costs of importing intermediate inputs from those …rms’ existing intermediate production locations.
Finally, equation (12) takes into account each host country’s market potential. Specif-ically, MDist = WY =Dist(1 F in) and MT arif f = WY =T arif f(1 F in), where 1 F in
f1 F in1; :::,1 F inei; :::,1 F inNg0 is a vector that identi…es all the countries in which
formed by countries’ market size weighted by, respectively, the distance and the tari¤s of importing …nal goods from a given country i, i.e., fY1=Disti1; :::,Yj=Distiei; :::,YN=DistiNg
and fY1=T arif fi1, :::,Yj=T arif fiei, :::,YN=T arif fiNg. The e¤ect of market potential is
expected to be positive, that is, m1>0and m2 >0.
4.1.2 Intermediate production location decision
Now consider the decision of each …rm to invest in intermediate production. The following speci…cation is adopted based on equation (11):
Pr [ Inti= 1] = [ XInt;i+V erticalInt;i+HorizontalInt;i+"Int;i] (14)
where
V erticalInt = ( v0+ v1WDistF in+ v2WT arif fF in)IF in (15)
HorizontalInt = h0+ h1(WDistF in)0Int+ h2(WT arif fF in)0Int IInt
In the above equation, Intirepresents each …rm’s decision to establish an intermediate
production subsidiary in country i in 2007, and XInt;i represents a vector of country i’s
characteristics in 2005.
In addition to host-country characteristics, the right-hand side of equation (14) in-cludes two network terms measured in 2005. The …rst network term in equation (14), i.e.,
V erticalInt, captures vertical interdependence between intermediate and …nal-good
pro-duction locations. As in Section 4.1.1, WDist is a distance weighting matrix and WT arif f
is a tari¤ weighting matrix consisting of, in this case, the tari¤s of exporting intermediate inputs from each countryi. WDistF inandWT arif fF inare vectors that represent,
respec-tively, the distance and the tari¤s of exporting intermediate inputs from each host country to …rms’ existing …nal-good production locations. Section 3 predicts that v0 >0, v1<0 and v2 <0, that is, the probability of …rms investing in intermediate production in a given country decreases in that country’s costs of exporting intermediate inputs to those …rms’ existing …nal-good production subsidiaries.
The second network term in equation (14), i.e.,HorizontalInt, captures the substituting
relationship between existing and potential intermediate production locations. (WDistF in)0Int
and(WT arif fF in)0Intrepresent, respectively, the distance and the tari¤s of exporting
4.2 Econometric methodology
Given the binary nature of the dependent variables, a probit model is used as a baseline speci…cation for estimating equations (12) and (13). Three econometric issues can arise in the empirical analysis including (i) omitted variables, (ii) prevalence of zeros in the values of dependent variables, and (iii) endogeneity of network variables. To address these issues, a number of alternative estimating strategies are employed, as discussed below.
Omitted variables First, it is possible that, in addition to …rm network variables, other …rm-level characteristics, such as productivity and business connections, also a¤ect …rms’ entry decisions. A …rm-level …xed e¤ect can be included in the baseline speci…cation for equations (12) and (13) to control for the e¤ect of …rm attributes.7 To avoid the potential incidental parameter problem associated with …xed-e¤ect probit models, alternative esti-mators like …xed-e¤ect linear probability and conditional logit models were also considered as a robustness check.
Prevalence of zeros A second issue concerns the prevalence of zeros in the values of dependent variables. This is determined by the nature of location entry data. Because, over a given period of time, a multinational …rm may make no new entry, choosing instead to operate with existing production networks, the dependent variables can consist of a large fraction of zeros relative to the number of observations.
To address this issue, a Heckman selection procedure is considered. In this procedure, multinationals’ decision of whether to enter any new host country given their existing pro-duction networks is …rst examined. A number of instrumental variables are used in this step including the number of existing …nal-good and intermediate production locations and …rm productivity growth. The choice of these instrumental variables, in particular, productivity growth, is motivated by an emerging literature, led by Helpman et al. (2004) and Yeaple (2009), that links …rm productivity to the decision to invest abroad. This literature shows that …rms with greater productivity are more likely to overcome the …xed cost of FDI in each host country and invest in larger numbers of countries. In a dynamic setting, …rms that experienced productivity growth should be more likely to expand foreign production networks and enter new host countries. Controlling for the potential self-selection bias, …rms’ decisions regarding where to invest in …nal-good and intermediate production are then examined, following equations (12) and (14).
Endogeneity of network variables Another issue that can arise in the analysis is the potential endogeneity of network variables. Even though a time lag is included between
7Note that the adoption of …rm …xed e¤ects in probit models means that all multinationals that did not
…rms’ entry decisions and network characteristics, the network variables can still be en-dogenous when, for example, …rms are su¢ciently forward looking.
An instrumental variable (IV) approach is employed to address this issue. Consider …rst the …nal-good production location decision. In the …rst stage, each weighted network vari-able in equation (12), including WDistF in, WT arif fF in, WDistInt, WT arif fInt, lnMDist,
andlnMT arif f, is estimated using countryi’s characteristicsXi and a vector of
instrumen-tal variables formed by corresponding weighting matrices and the matrix of host-country characteristicsX. For example, the variableWDistF in is estimated usingXi and a vector
of instrumental variables WDistX. The …tted values of WDistF in obtained from this stage
are then taken into account in equation (12).
Similarly, for the intermediate production location decision, each weighted network variable in equation (14) is estimated in the …rst stage usingXi and vectors of instrumental
variables, i.e., WDistF in and WT arif fF in. The …tted values of the network variables are
then taken into account in equation (14) to estimate the e¤ects of existing production networks.
5
Data
The dataset employed in this paper, obtained from BvDEP AMADEUS, contains compre-hensive …nancial and subsidiary information for public and private French …rms. AMADEUS combines data from specialist regional information providers around the world, with a par-ticularly good coverage for countries like France.
The dataset reports French multinationals’ subsidiary activities in 99 host countries in 2005 and 2007.8 It is compiled using two editions of AMADEUS published in 2006 and
2008, respectively.9 For each multinational …rm, the dataset reports not only subsidiary locations but also, for each location, the primary product, sales, asset, and employment information.10 There are in total 1,698 French multinational …rms in the dataset. These
…rms invested in, on average, 2.88 host countries in 2005 and 3.81 countries in 2007.11 Subsidiaries engaged in …nal-good and intermediate production are distinguished in the analysis using the methodology introduced by Alfaro and Charlton (2009). Final-good pro-duction subsidiaries are identi…ed by comparing each subsidiary’s primary product with the parent …rm’s primary and secondary products, all reported at the NACE 4-digit level.12
If its primary product is listed as one of the parent …rm’s …nal products, the subsidiary
8The …nal sample is smaller in some speci…cations because of the missing values of explanatory variables.
9AMADEUS does not directly report time series information for subsidiary data. To obtain that
infor-mation, it is necessary to acquire di¤erent editions of AMADEUS published in di¤erent years.
1 0The coverage of sales, assets, and employment data is not as complete as the location information.
1 1It is worth noting that there are very few exits (i.e., subsidiary shut-downs) in the data. Nearly all
subsidiaries that existed in 2005 were active in 2007.
is considered a …nal-good production location. Subsidiaries that engage in intermediate production are determined by examining the input-output relationship between the sub-sidiary’s primary product and parent …rm’s …nal products. A subsidiary is considered an intermediate production location if the direct requirement for the subsidiary’s primary product in the parent …rm’s …nal-product production exceeds a threshold value.13 This
identi…cation of …nal-good and intermediate production subsidiaries has been generally ab-sent in the literature, with the exception of Alfaro and Charlton (2009), mainly because of lack of information on subsidiary-level activities.
In 2007, according to the above de…nitions, French multinationals owned, on aver-age, …nal-good production subsidiaries in 2.49 countries and intermediate production sub-sidiaries in 0.72.14 More than 75 percent of subsidiaries newly established between 2005
and 2007 were …nal-good production locations, suggesting a greater tendency for MNCs to expand horizontally than vertically.
As explained in Section 4.1, the two measures of trade costs used to construct the network variables are (i) the distance between each pair of host countries (as a proxy for transport costs), and (ii) the tari¤ rates on parent …rms’ …nal products and intermediate inputs produced overseas between each pair of host countries. The input-output coe¢cient between the primary products of the parent …rm and each subsidiary is also included. Distance data are taken from the CEPII distance database. Tari¤ data, consisting of applied tari¤ rates at the NACE 4-digit industry level, are obtained from TRAINS. The input-output coe¢cients are computed based on the 2002 U.S. Bureau of Economic Analysis (BEA) benchmark input-output accounts, a source with more disaggregated information than most alternative national input-output tables.
In addition to …rm network characteristics, FDI determinants traditionally emphasized in the literature are also taken into account. First, several variables are used to capture the trade costs between home and host countries. For the …nal-good production, multi-nationals’ incentives to invest in a foreign country are expected to increase in the trade costs of exporting …nal goods from home. This is the conventional market access motive of horizontal FDI shown in Markusen (1984) and following empirical studies by Carr et al. (2001), Brainard (1997), and Yeaple (2003b), and predicts a positive parameter for transport costs, proxied by distance, between home and host countries and host-country tari¤s on the home country in the …nal-good industry. Multinationals’ incentives to invest in …nal-good production in a given country are also expected to decrease in the trade costs of exporting …nal goods back home. This follows directly the theory of vertical FDI
es-1 3Using di¤erent threshold values yielded similar results. The results presented in the following sections
are obtained based on the threshold value 0.1. The analysis also considered weighting each intermediate production subsidiary with its input-output coe¢cient to the …nal product, as explained in Section 6.
1 4Fewer than 20 percent of subsidiaries belong to neither category, and engage in activities such as
tablished by Helpman (1984) and predicts a negative parameter for the distance between home and host countries and home-country tari¤s on …rms’ …nal goods produced overseas. A dummy variable that distinguishes EU members from the rest of the world is included to capture additional trade cost di¤erences between EU and non-EU host countries. Like distance, the e¤ect of the EU dummy hinges on the type of FDI undertaken by French MNCs. Finally, multinationals’ incentives to invest intermediate production in a foreign country are expected to decrease in the trade costs of exporting intermediate inputs to …nal-good production locations, which are controlled for by the network variables.15
Host-country domestic market size, measured by real GDP, is included as well. Previous empirical studies, such as Carr et al. (2001), Brainard (1997), and Yeaple (2003b), show that multinationals tend to invest in countries with a larger domestic market size. Host countries’ marginal costs of production, measured in the analysis using real unit labor costs computed with labor cost and output data from the World Bank Trade and Production Database, are expected to exert a negative e¤ect on multinationals’ investment incentives. Finally, as in Yeaple (2003b), various measures of investment costs are taken into account. First, host countries’ tax policy is controlled for using maximum corporate tax rates available from the U.S. O¢ce of Tax Policy Research.16 Second, the costs of starting a business, taken from the
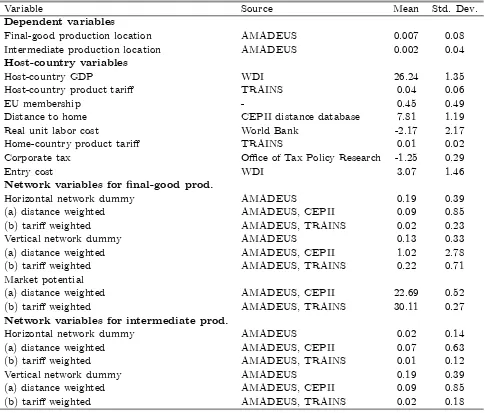
World Development Indicators, are included as a proxy for entry costs. Third, the distance between France and each host country serves as a proxy for …xed costs of investment, the expectation being that the …xed cost of investment (for example, monitoring cost) will be greater for subsidiaries located in remote countries. Table A.1 provides sources and summary statistics for the variables.
6
Empirical Evidence
In this section, the econometric framework outlined in Section 4 is evaluated to establish the e¤ects of MNC production networks. Multinationals’ entry decisions are estimated by …rst assuming away the interdependence in production networks. The results are then compared to the estimates that take into account production network e¤ects. This com-parison helps to assess the role of existing production networks in MNCs’ entry decisions and, further, how accounting for third-country production networks a¤ects the estimated e¤ects of conventional host-country characteristics.
1 5Di¤erent from the case of …nal-good production, the market access motive, captured by the trade costs
of exporting intermediate inputs from home to host countries, is not expected to play a signi…cant role in the decision to invest in intermediate production.
1 6Ideally, applied corporate tax rates should be included instead of the maximum, but the former data
6.1 Excluding network e¤ects
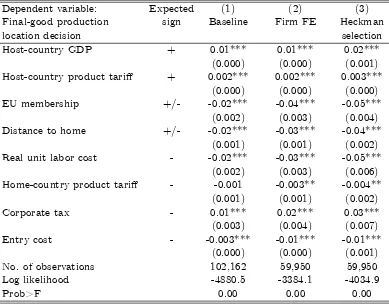
Table 1 reports estimates of equation (12) excluding the network variables. The estimated e¤ects of host-country characteristics are largely consistent with the existing literature for all empirical speci…cations. Consider …rst the baseline results reported in column (1). French MNCs exhibit a signi…cant market-access motive that is in alignment with previous …ndings. Firms are more likely to establish …nal-good production in countries with higher GDP. They also have greater incentives to enter countries that set higher tari¤s on …nal-product exports from France. The parameter of EU membership is negative, suggesting that …rms are more likely to choose FDI instead of exports in countries outside the EU. All of these results suggest a horizontal interdependence between MNCs’ home and foreign production: MNCs are motivated to replace …nal-good exports from home with FDI when foreign markets are large and trade costs high. As found in previous studies, the e¤ect of distance is negative, consistent with the role of distance in raising …xed costs of investment.
[Table 1 about here]
Table 1 also implies a signi…cant comparative advantage motive for French MNCs. Multi-nationals looking to establish …nal-good production subsidiaries are attracted to countries with a lower unit labor cost. Investment costs also exert a signi…cant e¤ect on the entry decision. A higher cost of starting a business is associated with a lower probability of at-tracting multinational …rms. The sign of the corporate tax parameter is inconsistent with the expectation. This can be a result of the tax data used here, which report each host country’s maximum corporate tax rate and do not necessarily capture the rates applied to multinational …rms. Because the latter information is not systematically available, to include it would reduce the sample size substantially.17
The estimated e¤ects of host-country characteristics remain similar when …rm dummies are included in column (2) to control for potential omitted variables. The parameter of home-country tari¤s also becomes signi…cant, suggesting a negative relationship between French …nal-good tari¤s and multinationals’ incentives to produce the …nal good abroad. This result lends further support to the comparative advantage motive hypothesis: some French multinationals serve their home country from foreign production locations and are adversely a¤ected by home-country tari¤s. The Heckman selection procedure adopted to address the prevalence of zeros in the dependent variables yields similar results.
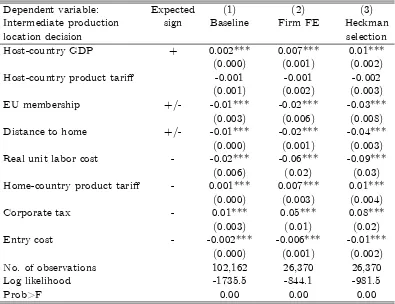
Table 2 reports estimates of equation (14), excluding the network variables, for MNCs’ intermediate production location decisions. As shown in the table, the estimated e¤ects
1 7The e¤ect of host-country tax rates on multinationals’ location decisions is also dependent on type of
of host-country characteristics are largely similar to those reported in Table 1. Countries with a higher GDP have a greater probability of attracting multinationals. Countries relatively proximate to France are also more likely to become intermediate production locations. A higher real unit labor cost or higher entry cost lowers multinationals’ incentives to establish intermediate production subsidiaries in a given country. As expected, host-country tari¤s do not play a signi…cant role in intermediate production location decisions. A result not expected analytically is the positive e¤ect of French tari¤s. Home-country tari¤s are found to be positively associated with the probability of French …rms investing in intermediate production overseas. Again, controlling for unobserved …rm attributes and prevalence of zeros in the dependent variable does not change the estimated e¤ects of host-country characteristics.
[Table 2 about here]
6.2 Accounting for network e¤ects
6.2.1 Final-good production location decision
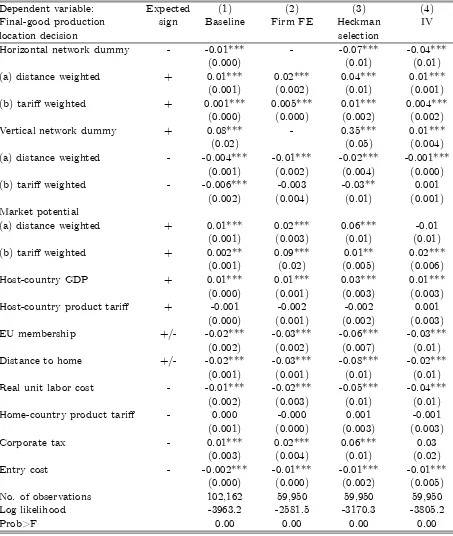
The e¤ects of existing production networks are considered next. Table 3 reports estimates of equation (12), for the …nal-good production location decisions, taking into account potential network e¤ects. The results provide strong evidence of horizontal and vertical interdepen-dence in multinationals’ production networks. First, multinationals are signi…cantly more likely to invest in countries relatively distant from existing …nal-good production locations. According to column (1), a one-standard-deviation increase in third-country distance in-creases the probability of entry by 0.1 standard deviation.18 This result applies as well to tari¤s. The incentive to enter a host country increases in the level of tari¤s on …nal-good imports from existing production locations. Market potential also plays a signi…cant role. Multinationals have a greater probability of producing …nal goods in countries with greater market potential. This points to the signi…cance of export-platform FDI, whereby multinationals use host countries as the platform from which to supply third countries, in particular, third countries in which the MNCs do not already have …nal-good production activities.
[Table 3 about here]
The e¤ect of trade costs is reversed when there is a vertical production linkage be-tween foreign production locations. Table 3 considers the average trade costs of importing intermediate inputs from existing intermediate production locations, unweighted by input-output coe¢cients. The results suggest that French multinationals are motivated to cluster
1 8To get a sense of the economic signi…cance of the estimated network e¤ects, standardized coe¢cients
vertically linked subsidiaries in proximate countries. For example, according to column (1), the probability of being selected as a …nal-good production location is 0.14 standard deviation higher for countries one-standard-deviation closer to multinationals’ existing in-termediate production locations. This result suggests that FDI activities in neighboring countries and vertically linked intermediate industries can trigger an increase in the ‡ow of FDI to a host country in the …nal good industry.
These …ndings remain robust to the adoption of …rm dummies and the Heckman proce-dure in columns (2) and (3), respectively.19 Addressing the endogeneity of network variables
also does not change the results qualitatively. As shown in column (4), most network vari-ables continue to exert a signi…cant e¤ect on French MNCs’ entry decisions.
The e¤ect of the conventional market access variables is a¤ected, however, by the con-sideration of production networks. As seen in Table 3, the parameters of both host-country tari¤s on France and French tari¤s on host countries become statistically insigni…cant when the network variables are taken into account. This constitutes a sharp contrast with Table 1, in which the evidence suggests signi…cant interdependence and, in particular, a substi-tuting relationship between foreign and home-country …nal-good production. This change in the results suggests that it is not adequate to focus exclusively on the interdependence between home and host countries. Interdependence across foreign production locations in-creases as multinationals’ production networks expand over time. The FDI decision is no longer a binary choice between investing in a foreign country and exporting from home; it has become signi…cantly more complex, involving third nations. Ignoring third-country network e¤ects is likely to give rise to biased estimates for the relationship between home-country production and FDI activities and, more generally, the true causes and e¤ects of FDI.
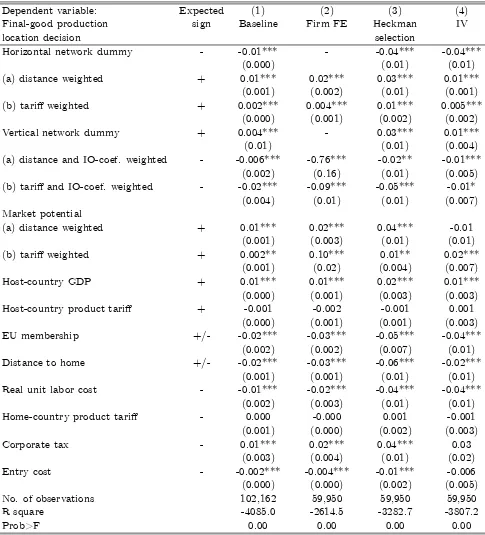
In Table 4, the extent of vertical production linkages is taken into account in construct-ing the intermediate production network variables, followconstruct-ing the description in Section 4.1.1. The results are largely similar to those reported in Table 3. The incentive to cluster vertically linked subsidiaries in countries with lower trade costs increases in the extent of vertical linkages. Intermediate production locations with a stronger input-output linkage to …rms’ …nal-good production play a more important role in the choice of …nal-good pro-duction locations. Again, these results are not sensitive to the various estimation strategies employed in the analysis.
[Table 4 about here]
1 9Note that when the …rm …xed e¤ect is included, the …rm-speci…c network dummy variables drop out of
6.2.2 Intermediate production location decision
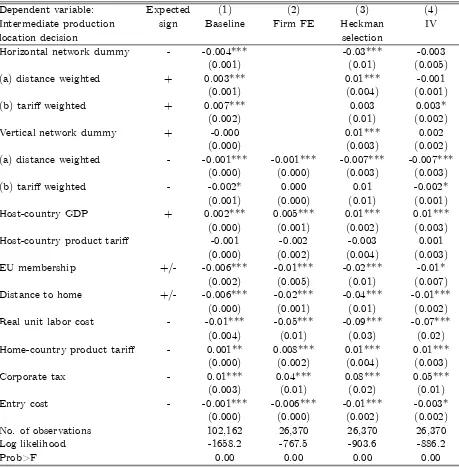
The e¤ects of production networks on MNCs’ intermediate production location decisions are examined in this sub-section. Table 5 reports estimates of equation (14), taking into account production network e¤ects. The results indicate signi…cant vertical interdepen-dence between …nal-good and intermediate production locations. French multinationals tend to establish intermediate production locations in countries relatively proximate to ex-isting …nal-good production locations. According to columns (3) and (4), a one-standard-deviation decrease in distance to MNCs’ …nal production subsidiaries increases the proba-bility of MNCs investing in intermediate production by 0.15 standard deviation. The e¤ect of intermediate-input tari¤s is weaker and signi…cant only in columns (1) and (4).
There is also a substituting e¤ect between existing and potential intermediate produc-tion locaproduc-tions. The probability of investing in new intermediate producproduc-tion subsidiaries increases in the trade costs for existing subsidiaries to reach …nal-good production loca-tions. For example, a one-standard-deviation increase in the distance between MNCs’ existing intermediate and …nal production subsidiaries increases the probability of MNCs establishing new intermediate production locations by 0.16 standard deviation according to column (3).20 This result is not robust, however, to the adoption of the IV approach.
[Table 5 about here]
7
Conclusion
This study is one of the …rst attempts to estimate interdependence in multinationals’ global production networks. Using a detailed French multinational subsidiary dataset, the paper …nds, for the …rst time, strong evidence of horizontal and vertical interactions between MNCs’ foreign production locations. These results complement existing contributions in which evidence of interdependence, obtained using aggregate FDI data, has been mixed. Here, third-country subsidiaries are shown to exert a signi…cant e¤ect on French multina-tionals’ entry decisions with respect to both …nal-good and intermediate production. But the e¤ect varies systematically with the nature of production linkages between subsidiaries. Multinationals are more likely to expand horizontally when the trade cost of importing …nal goods from existing …nal-good production subsidiaries is relatively high, but tend to locate vertically linked subsidiaries in countries with low intra-…rm trade costs, especially when there is a strong input-output relationship. These results are robust to the control of omitted variables, prevalence of zeros in the values of dependent variables, and potential endogeneity of network variables.
Strikingly, there is little evidence of interdependence between multinationals’ produc-tion at home and new investment abroad when third-country network e¤ects are taken into account. The estimated e¤ects of conventional market access variables measuring the trade costs between home and host countries become insigni…cant after the consideration of production networks. This sharp contrast with the existing literature can be explained by the assumption made in most previous studies that …rms’ decisions to invest in foreign countries are independent of their locations in third nations, even though the majority of multinationals today operate multilateral production networks.
This paper conveys important policy implications for both FDI home and host countries. It is crucial to analyze the causes and e¤ects of FDI in the context of global production networks. As shown in the paper, assuming away the interdependence of foreign production locations is likely to over-estimate the relationship between home-country production and foreign investments and, further, fail to account for spillovers among FDI ‡ows including, for example, the e¤ect of FDI in‡ows to third countries on a host country’s ability to attract multinational …rms.
References
Alfaro, Laura, and Andrew Charlton (2009) ‘Intra-industry foreign direct investment.’
American Economic Review99(5), 2096–2119
Baltagi, Badi, Peter Egger, and Michael Pfa¤ermayr (2007) ‘Estimating models of complex FDI: Are there third-country e¤ects?’ Journal of Econometrics140(1), 260–281
Bergstrand, Je¤rey, and Peter Egger (2008) ‘Finding vertical multinational enterprises.’ mimeo
Blonigen, Bruce (2005) ‘A review of the empirical literature on FDI determinants.’Atlantic Economic Journal33(4), 383–403
Blonigen, Bruce, Ronald Davies Glen Waddell, and Helen Naughton (2007) ‘FDI in space: Spatial autoregressive lags in foreign direct investment.’ European Economic Review
51(5), 1303–1325
Blonigen, Bruce, Ronald Davies Helen Naughton, and Glen Waddell (2008) ‘Spacey parents: Spatial autoregressive patterns in inbound FDI.’ pp. 173–198
Brainard, S. Lael (1997) ‘An empirical assessment of proximity-concentration trade-o¤ be-tween multinational sales and trade.’American Economic Review87(4), 520–544
Carr, David, James Markusen, and Keith Maskus (2001) ‘Estimating the knowledge-capital model of the multinational enterprise.’American Economic Review91(3), 691–708
Chen, Maggie X. (2009) ‘Regional economic integration and geographic concentration of multinational …rms.’European Economic Review53(3), 355–375
Ekholm, Karolina, Rikard Forslid, and James Markusen (2007) ‘Export-platform foreign direct investment.’Journal of European Economic Association5(4), 776–795
Hanson, Gordon, Raymond Mataloni, and Matthew Slaughter (2007) ‘Vertical production networks in multinational …rms.’Review of Economics and Statistics 87(4), 664–678
Head, Keith, and Thierry Mayer (2004) ‘Market potential and the location of japanese investment in the european union.’Review of Economics and Statistics86(4), 957–972
Helpman, Elhanan (1984) ‘A simple theory of trade with multinational corporations.’ Jour-nal of Political Economy92(3), 451–471
Krugman, Paul, and Anthony Venables (1996) ‘Integration, specialization, and adjustment.’
European Economic Review40(3), 959–967
Markusen, James (1984) ‘Multinationals, multi-plant economies, and the gains from trade.’
Journal of International Economics16(3-4), 205–226
Markusen, James, and Anthony Venables (2000) ‘The theory of endowment, intra-industry and multi-national trade.’Journal of International Economics 52(2), 209–234
Motta, Massimo, and George Norman (1996) ‘Does economic integration cause foreign direct investment?’ International Economic Review 37(4), 757–783
Puga, Diego, and Anthony Venables (1997) ‘Preferential trading agreements and industrial location.’Journal of International Economics 43(3-4), 347–368
Venables, Anthony (1996) ‘Equilibrium locations of vertically linked industries.’ Interna-tional Economic Review 37(2), 341–359
Yeaple, Stephen (2003a) ‘The complex integration strategies of multinational …rms and cross-country dependencies in the structure of foreign direct investment.’ Journal of International Economics60(2), 293–314
Table 1: Estimating …nal-good production location decisions without network factors
Dependent variable: Expected (1) (2) (3)
Final-good production sign Baseline Firm FE Heckman
location decision selection
Host-country GDP + 0.01*** 0.01*** 0.02***
(0.000) (0.000) (0.001)
Host-country product tari¤ + 0.002*** 0.002*** 0.003***
(0.000) (0.000) (0.000)
EU membership +/- -0.02*** -0.04*** -0.05***
(0.002) (0.003) (0.004)
Distance to home +/- -0.02*** -0.03*** -0.04***
(0.001) (0.001) (0.002)
Real unit labor cost - -0.02*** -0.03*** -0.05***
(0.002) (0.003) (0.006)
Home-country product tari¤ - -0.001 -0.003** -0.004**
(0.001) (0.001) (0.002)
Corporate tax - 0.01*** 0.02*** 0.03***
(0.003) (0.004) (0.007)
Entry cost - -0.003*** -0.01*** -0.01***
(0.000) (0.000) (0.001)
No. of observations 102,162 59,950 59,950
Log likelihood -4880.5 -3384.1 -4034.9
Prob>F 0.00 0.00 0.00
Table 2: Estimating intermediate production location decisions without network fac-tors
Dependent variable: Expected (1) (2) (3)
Intermediate production sign Baseline Firm FE Heckman
location decision selection
Host-country GDP + 0.002*** 0.007*** 0.01***
(0.000) (0.001) (0.002)
Host-country product tari¤ -0.001 -0.001 -0.002
(0.001) (0.002) (0.003)
EU membership +/- -0.01*** -0.02*** -0.03***
(0.003) (0.006) (0.008)
Distance to home +/- -0.01*** -0.02*** -0.04***
(0.000) (0.001) (0.003)
Real unit labor cost - -0.02*** -0.06*** -0.09***
(0.006) (0.02) (0.03)
Home-country product tari¤ - 0.001*** 0.007*** 0.01***
(0.000) (0.003) (0.004)
Corporate tax - 0.01*** 0.05*** 0.08***
(0.003) (0.01) (0.02)
Entry cost - -0.002*** -0.006*** -0.01***
(0.000) (0.001) (0.002)
No. of observations 102,162 26,370 26,370
Log likelihood -1735.5 -844.1 -981.5
Prob>F 0.00 0.00 0.00
Table 3: Estimating …nal-good production location decisions with network factors
Dependent variable: Expected (1) (2) (3) (4)
Final-good production sign Baseline Firm FE Heckman IV
location decision selection
Horizontal network dummy - -0.01*** - -0.07*** -0.04***
(0.000) (0.01) (0.01)
(a) distance weighted + 0.01*** 0.02*** 0.04*** 0.01***
(0.001) (0.002) (0.01) (0.001)
(b) tari¤ weighted + 0.001*** 0.005*** 0.01*** 0.004***
(0.000) (0.000) (0.002) (0.002)
Vertical network dummy + 0.08*** - 0.35*** 0.01***
(0.02) (0.05) (0.004)
(a) distance weighted - -0.004*** -0.01*** -0.02*** -0.001***
(0.001) (0.002) (0.004) (0.000)
(b) tari¤ weighted - -0.006*** -0.003 -0.03** 0.001
(0.002) (0.004) (0.01) (0.001)
Market potential
(a) distance weighted + 0.01*** 0.02*** 0.06*** -0.01
(0.001) (0.003) (0.01) (0.01)
(b) tari¤ weighted + 0.002** 0.09*** 0.01** 0.02***
(0.001) (0.02) (0.005) (0.006)
Host-country GDP + 0.01*** 0.01*** 0.03*** 0.01***
(0.000) (0.001) (0.003) (0.003)
Host-country product tari¤ + -0.001 -0.002 -0.002 0.001
(0.000) (0.001) (0.002) (0.003)
EU membership +/- -0.02*** -0.03*** -0.06*** -0.03***
(0.002) (0.002) (0.007) (0.01)
Distance to home +/- -0.02*** -0.03*** -0.08*** -0.02***
(0.001) (0.001) (0.01) (0.01)
Real unit labor cost - -0.01*** -0.02*** -0.05*** -0.04***
(0.002) (0.003) (0.01) (0.01)
Home-country product tari¤ - 0.000 -0.000 0.001 -0.001
(0.001) (0.000) (0.003) (0.003)
Corporate tax - 0.01*** 0.02*** 0.06*** 0.03
(0.003) (0.004) (0.01) (0.02)
Entry cost - -0.002*** -0.01*** -0.01*** -0.01***
(0.000) (0.000) (0.002) (0.005)
No. of observations 102,162 59,950 59,950 59,950
Log likelihood -3963.2 -2581.5 -3170.3 -3805.2
Prob>F 0.00 0.00 0.00 0.00
Table 4: Estimating …nalgood production location decisions with network factors -IO weighted
Dependent variable: Expected (1) (2) (3) (4)
Final-good production sign Baseline Firm FE Heckman IV
location decision selection
Horizontal network dummy - -0.01*** - -0.04*** -0.04***
(0.000) (0.01) (0.01)
(a) distance weighted + 0.01*** 0.02*** 0.03*** 0.01***
(0.001) (0.002) (0.01) (0.001)
(b) tari¤ weighted + 0.002*** 0.004*** 0.01*** 0.005***
(0.000) (0.001) (0.002) (0.002)
Vertical network dummy + 0.004*** - 0.03*** 0.01***
(0.01) (0.01) (0.004)
(a) distance and IO-coef. weighted - -0.006*** -0.76*** -0.02** -0.01***
(0.002) (0.16) (0.01) (0.005)
(b) tari¤ and IO-coef. weighted - -0.02*** -0.09*** -0.05*** -0.01*
(0.004) (0.01) (0.01) (0.007)
Market potential
(a) distance weighted + 0.01*** 0.02*** 0.04*** -0.01
(0.001) (0.003) (0.01) (0.01)
(b) tari¤ weighted + 0.002** 0.10*** 0.01** 0.02***
(0.001) (0.02) (0.004) (0.007)
Host-country GDP + 0.01*** 0.01*** 0.02*** 0.01***
(0.000) (0.001) (0.003) (0.003)
Host-country product tari¤ + -0.001 -0.002 -0.001 0.001
(0.000) (0.001) (0.001) (0.003)
EU membership +/- -0.02*** -0.03*** -0.05*** -0.04***
(0.002) (0.002) (0.007) (0.01)
Distance to home +/- -0.02*** -0.03*** -0.06*** -0.02***
(0.001) (0.001) (0.01) (0.01)
Real unit labor cost - -0.01*** -0.02*** -0.04*** -0.04***
(0.002) (0.003) (0.01) (0.01)
Home-country product tari¤ - 0.000 -0.000 0.001 -0.001
(0.001) (0.000) (0.002) (0.003)
Corporate tax - 0.01*** 0.02*** 0.04*** 0.03
(0.003) (0.004) (0.01) (0.02)
Entry cost - -0.002*** -0.004*** -0.01*** -0.006
(0.000) (0.000) (0.002) (0.005)
No. of observations 102,162 59,950 59,950 59,950
R square -4085.0 -2614.5 -3282.7 -3807.2
Prob>F 0.00 0.00 0.00 0.00
Table 5: Estimating intermediate production location decisions with network factors
Dependent variable: Expected (1) (2) (3) (4)
Intermediate production sign Baseline Firm FE Heckman IV
location decision selection
Horizontal network dummy - -0.004*** -0.03*** -0.003
(0.001) (0.01) (0.005)
(a) distance weighted + 0.003*** 0.01*** -0.001
(0.001) (0.004) (0.001)
(b) tari¤ weighted + 0.007*** 0.003 0.003*
(0.002) (0.01) (0.002)
Vertical network dummy + -0.000 0.01*** 0.002
(0.000) (0.003) (0.002)
(a) distance weighted - -0.001*** -0.001*** -0.007*** -0.007***
(0.000) (0.000) (0.003) (0.003)
(b) tari¤ weighted - -0.002* 0.000 0.01 -0.002*
(0.001) (0.000) (0.01) (0.001)
Host-country GDP + 0.002*** 0.005*** 0.01*** 0.01***
(0.000) (0.001) (0.002) (0.003)
Host-country product tari¤ -0.001 -0.002 -0.003 0.001
(0.000) (0.002) (0.004) (0.003)
EU membership +/- -0.006*** -0.01*** -0.02*** -0.01*
(0.002) (0.005) (0.01) (0.007)
Distance to home +/- -0.006*** -0.02*** -0.04*** -0.01***
(0.000) (0.001) (0.01) (0.002)
Real unit labor cost - -0.01*** -0.05*** -0.09*** -0.07***
(0.004) (0.01) (0.03) (0.02)
Home-country product tari¤ - 0.001** 0.008*** 0.01*** 0.01***
(0.000) (0.002) (0.004) (0.003)
Corporate tax - 0.01*** 0.04*** 0.08*** 0.05***
(0.003) (0.01) (0.02) (0.01)
Entry cost - -0.001*** -0.006*** -0.01*** -0.003*
(0.000) (0.000) (0.002) (0.002)
No. of observations 102,162 26,370 26,370 26,370
Log likelihood -1658.2 -767.5 -903.6 -886.2
Prob>F 0.00 0.00 0.00 0.00
Table A.1: Summary Statistics
Variable Source Mean Std. Dev.
Dependent variables
Final-good production location AMADEUS 0.007 0.08
Intermediate production location AMADEUS 0.002 0.04
Host-country variables
Host-country GDP WDI 26.24 1.35
Host-country product tari¤ TRAINS 0.04 0.06
EU membership - 0.45 0.49
Distance to home CEPII distance database 7.81 1.19
Real unit labor cost World Bank -2.17 2.17
Home-country product tari¤ TRAINS 0.01 0.02
Corporate tax O¢ce of Tax Policy Research -1.25 0.29
Entry cost WDI 3.07 1.46
Network variables for …nal-good prod.
Horizontal network dummy AMADEUS 0.19 0.39
(a) distance weighted AMADEUS, CEPII 0.09 0.85
(b) tari¤ weighted AMADEUS, TRAINS 0.02 0.23
Vertical network dummy AMADEUS 0.13 0.33
(a) distance weighted AMADEUS, CEPII 1.02 2.78
(b) tari¤ weighted AMADEUS, TRAINS 0.22 0.71
Market potential
(a) distance weighted AMADEUS, CEPII 22.69 0.52
(b) tari¤ weighted AMADEUS, TRAINS 30.11 0.27
Network variables for intermediate prod.
Horizontal network dummy AMADEUS 0.02 0.14
(a) distance weighted AMADEUS, CEPII 0.07 0.63
(b) tari¤ weighted AMADEUS, TRAINS 0.01 0.12
Vertical network dummy AMADEUS 0.19 0.39
(a) distance weighted AMADEUS, CEPII 0.09 0.85
(b) tari¤ weighted AMADEUS, TRAINS 0.02 0.18
Figure 1: Renault’s global production network (the darker and lighter areas represent intermediate and …nal-good production locations, respectively)
0 0.02 0.04 0.06 0.08 0.1 0.12 0.14 0.16
1 10 100
Number of invested countries
D
ens
ity 2007
2005
[image:31.612.156.458.429.630.2]