Munich Personal RePEc Archive
Trade in services: The elasticity
approach for the case of Turkey
Ketenci, Natalya and Uz, Idil
Yeditepe University
2010
Online at
https://mpra.ub.uni-muenchen.de/86596/
TRADE IN SERVICES:
The elasticity approach for the case of Turkey
Natalya Ketenci1
(Yeditepe University, Istanbul)
and
Idil Uz2
(Yeditepe University, Istanbul)
Abstract
This study includes the analysis of global trade in the services and service sector in
Turkey, and estimates the elasticity of trade in services to real exchange rates and income.
There is an increasing role of the service sector in the Turkish economy; however, a
decreasing trend of trade in services is taking place. The commitments of the GATS were
found to be ineffective, at least in the case of Turkey. The empirical findings suggest that the
real exchange rate is not a significant determinant for the trade in services. We found an
inelastic real exchange rate and income elasticities in trade demand functions. However, the
value of income elasticity significantly exceeds the value of real exchange rate elasticity.
JEL Classification Codes: C32, C52, F14,F41
Keywords: trade in service, trade elasticity, cointegration, vector error correction.
1
Natalya Ketenci, Department of Economics, Yeditepe University, Kayisdagi, 34755, Istanbul, Turkey. Tel: 0090 2165780581. Fax: 0090 2165780797. E-mail: [email protected]
2
1. Introduction
Services play a facilitating role in all aspects of economic activity. In general, the
service sector is expanding faster (with attendant job creation) than other sectors such as
agriculture or manufacturing. Services, particularly the financing and transportation of goods,
have played an important role in world trade for centuries. The parameters for modern service
sectors and the services trade were influenced early by the types of political relationships that
evolved. In the past 40 years, the focus of services trade has shifted away from facilitating the
trade in goods. Especially, international organisations promote trade in services with the
General Agreements on Trade in Services (GATS), aiming to establish a system of
international trade rules for the service sector. More recently, the integration of
telecommunications and computer technologies has made virtually all services tradable across
borders. However, members failed in the initial commitments for the liberalisation of services
trade for the reason that ‘GATS was a new instrument... and governments wished to proceed
with caution’ (Jara et al., 2006, 114).
The service sector has been important for Turkey since the 1980s liberalisation, both
in terms of its role in total production and its share in total trade. Our study shows that the
potential of the trade in services in Turkey deserves more attention, where the high risk of
current account deficit has made the economy more fragile and susceptible to foreign shocks
especially since 2003. Our analysis is composed of two aspects including, first, outlining
major developments and the rules for global trade in services and recent trends in the Turkish
service trade. This might help to answer the question of whether these international rules have
become effective for the Turkish economy. Secondly, the empirical analysis is based on the
export and import demand functions for trade in services, called trade elasticities in the
service sector. The analysis includes the behaviours of the major service sectors such as
transportation, tourism, construction, financial services, public services and other services
along side the behaviour of total services. The empirical part of the analysis might help to
measure the relative price and income elasticities in the trade in services.
Thus, our analysis starts with the international trade in services that provides the
general outlines for international rules for trade in services, mainly focusing on the GATS and
its final decisions. Then, in section 3 we will study the service sector and the trade in services
in Turkey. Section 4 includes the econometric analysis of trade in services in Turkey by using
elasticity approach and finally, section 5 gives some concluding remarks about the trade in
2. International Trade in Services
Services make up a major portion of world economies, including developing countries,
ranging from 39%of gross domestic production (GDP) in a country like Nigeria, to 89%in
economies such as Hong Kong (China). In 2001, the share of services in the EU was around
70%. Service industries are already increasing in importance in most developing countries
and particularly in least developed countries (LDCs), and usually contribute to at least 45% of
the GDP3. In general, the service sector is expanding faster (with attendant job creation) than
other sectors such as agriculture or manufacturing. The service sector covers a heterogeneous
range of intangible products and activities that are difficult to encapsulate within a simple
definition.
The creation of the General Agreement on Trade in Services (GATS) was one of the
landmark achievements of the Uruguay Round of trade negotiations, from 1986 to 1993, the
results of which were signed in Marrakech on 15 April 1994 and entered into force in January
1995. This was almost half a century after the entry into force of the General Agreement on
Tariffs and Trade (GATT) of 1947, the GATS’ counterpart in merchandise trade. The
definition of services trade under the GATS depends on the territorial presence of the supplier
and the consumer at the time of the transaction. It clearly defines four modes of supply in
GATS (article 1), following Bhagwati (1984) and Sampson and Snape (1985) as follows:
• Mode 1: Cross-border trade, where the trade takes place from one country into
another. Only the service itself crosses the border (e.g., banking or architectural
services transmitted via telecommunications or mail);
• Mode 2: Consumption abroad, where the customer travels to the country in which the
service is supplied (e.g., tourists or patients);
• Mode 3: Commercial presence, where the supplier establishes a commercial presence
abroad (e.g., domestic subsidiaries of foreign insurance companies or hotel chains);
and
• Mode 4: Movement of natural persons, where the provider of the service crosses the
border (e.g., accountants, doctors or teachers).
Any of the four modes above constitute "trade" as long as a local firm is being paid by a
foreign firm ("non-resident"), no matter where the service is actually provided. In 2005,
modes 1 and 2 constituted 30% of total trade in services, mode 3 constituted around 66% and
3
mode 4 only 4% of total trade (Hufbauer and Stephenson, 2007, based on Table 1 on p. 607)4.
Furthermore, the GATS was inspired by the same objectives as GATT. These objectives are
as follows:
Ø Creating a credible and reliable system of international trade rules;
Ø Ensuring fair and equitable treatment of all participants (the principle of non-discrimination);
Ø Stimulating economic activity through guaranteed policy bindings; and
Ø Promoting trade and development through progressive liberalisation5.
All members of the WTO are signatories of the GATS and are required to assume the
resulting obligations. Even though services account for over 60% of global production and
employment, according to WTO statistics, they represent no more than 20% of total trade
(BOP basis). However, this modest share should not be underestimated as many services that
have long been considered genuine domestic activities increasingly have become
internationally mobile. The trend is likely to continue and most of the battle will be at service
trade talks. Nevertheless, the dynamics that are important in increasing the “tradability” of
services are:
Ø The introduction of new transmission technologies (e.g., electronic banking, tele-health or tele-education service);
Ø The breaking up in many countries of long-entrenched monopolies (e.g., voice telephony and postal services);
Ø Regulatory reforms in hitherto tightly regulated sectors such as transport;
Ø Changing consumer preferences, such as technical and regulatory innovations.
The GATS applies in principle to all service sectors, which in particular includes 150
types of services in 12 different service sectors. However, there are two exemptions. Firstly,
Article I(3) of the GATS excludes “services supplied in the exercise of governmental
authority”. These are services that are supplied neither on a commercial basis nor in
competition with other suppliers. Cases in point are social security schemes and any other
public service, such as health and education, which are provided in non-market conditions.
The latter is the Annex on Air Transport Services, which exempts from coverage measures
affecting air traffic rights and services directly related to the exercise of such rights. The
differences between the GATS and GATT are as follows:
4
See Hufbauer and Stephenson (2007) for further criticism about the definitions of these modes of services.
5
• The agreement includes not only services, but also service suppliers;
• The focus of liberalisation depends not on the abolition or reduction of custom duties,
but on focusing on domestic arrangements preventing trade flow;
• Proposals of liberalisation are not about the service in general, but about four
categories of service supplier;
• While quota-free entry (market access) and national treatment are generally applicable
obligations under GATT, they apply under the GATS on a sector-by-sector basis and
only to the extent that no qualifications (limitations) have been scheduled.
The export of services is challenging because services are intangible and the service
actually is not created until it is delivered, it is critical for service providers to develop profile
and credibility in new markets. Furthermore, many of the GATS provisions are ‘very loosely
defined and broad in terminology, and thus subject to discretionary interpretation’ (Chanda,
2003). The GATS includes trade in services, but nothing about privatisation. Additionally,
applications in public services such as education and health are rather difficult. For example,
by using the exemptions a country may decide not to allow the doctors to work. The
Transition period is 10 years. However, these exemptions have tended to become permanent
features of the GATS system (Hufbauer et al., 2007, 611). So, barriers such as licensing
requirements, investment restrictions, and quotas along side other entry barriers such as
legislated telecommunications monopolies and other legal practices such as cartels or other
protection rackets limit trade in services.
3. Trade in Services in Turkey
Turkey is a founding member of the WTO and the final act of the Uruguay Round
trade negotiations discussions was approved by the National Assembly on the 25 February
1995. Turkey assumes the resulting obligations of the GATS and therefore it is important to
analyse the service sector in Turkey before studying the trade in services.
The service sector has been important for Turkey since the 1980s liberalisation.Figure
1 shows the composition of the Turkish economy by kind of economic activities in 1982 and
2005. One significant outcome is that the share of agriculture in the overall economy
decreased significantly from 23% in 1982 to 11% in 2005. The shares of services and industry
increased. Yet, the share of services dominated the economy, increasing from 55% in 1982 to
60% in 2005. Alternatively, Table 1 shows the growth rates of the overall economy and
2001 financial crises, growth rates in the service sector generally were greater than the growth
rate of the overall economy. For example, the service sector grew by 12.7% in 1987 when the
economy grew only by 9.5%. Since 2003, the service sector has grown at a rate faster than
[image:7.595.71.494.198.323.2]that of the overall economy.
Figure 1. Gross Domestic Product by kind of economic activity (1987 at constant prices)
Source: Turkstat
Table 1. Growth rates by sectors (%)
Year GDP Agriculture Industry Services Year GDP Agriculture Industry Services
1986 7.0 3.6 13.1 5.6 1996 7.0 4.6 6.8 7.7
1987 9.5 0.4 9.2 12.7 1997 7.5 -2.2 10.2 8.6
1988 2.1 8.0 2.1 0.4 1998 3.1 9.6 1.8 2.3
1989 0.3 -7.7 4.9 0.7 1999 -4.7 -5.6 -5.1 -4.3
1990 9.3 7.0 9.3 9.9 2000 7.4 3.8 6.2 8.8
1991 0.9 -0.6 2.9 0.5 2001 -7.5 -6.0 -7.4 -7.9
1992 6.0 4.3 6.2 6.3 2002 7.9 7.5 9.1 7.5
1993 8.0 -0.8 8.3 10.4 2003 5.8 -2.4 7.8 6.7
1994 -5.5 -0.6 -5.7 -6.6 2004 8.9 2.0 9.4 10.2
1995 7.2 1.3 12.5 6.3 2005 7.4 5.7 6.6 8.1
Source: Turkstat
Figure 2 shows the current account and the trade balance for goods and services,
separately. The current account does not provide a sustainable trend in some years and gives
deficit and or surplus in other years. Ongan (2008) proposes that the only way to maintain the
sustainability of the current account is to keep increasing tourism receipts in Turkey.
However, from 2004 the current account deficit grew significantly, breaking the records and
reaching 32.8 billion dollars in 2007. From the 1980s, the trade balance for goods gave
deficit. For example, 8.1 billion dollars of the trade deficit in 1992 increased to 14 billion
dollars in 2003 and, breaking the record, reached 42.1 billion dollars in 2007. On the other
hand, in the same time period, the service trade balance gave surplus from the early 1980s.
Sector Shares (1982)
Industry 22% Agriculture
23%
Service
55% Service 60%
Agriculture 11%
[image:7.595.70.530.385.565.2]For example, the service sector was 5.8 billion dollars in 1992, reaching 10.5 billion dollars in
[image:8.595.78.523.133.423.2]2003 and 13.8 billion dollars in 2007.
Figure 2. Current account and trade balances.
Source: Central Bank of Turkey
Table 2. The share of trade in services (%)
Years
Share of service trade in total trade
Share of service exports in total trade
Share of service imports in total trade
Share of service exports in total exports
Share of service imports in total imports
1990 25.54 17.45 8.08 38.87 14.66
1991 26.92 18.35 8.57 38.78 16.25
1992 25.98 18.56 7.42 38.87 14.19
1993 25.09 18.11 6.98 41.35 12.45
1994 27.25 19.96 7.28 37.72 15.37
1995 26.40 19.46 6.94 40.53 13.32
1996 20.70 13.89 6.81 28.91 13.11
1997 25.59 17.75 7.83 36.84 15.06
1998 30.18 21.25 8.93 42.58 17.76
1999 27.21 17.64 9.57 36.22 18.70
2000 24.73 17.34 7.38 38.27 13.45
2001 22.55 16.10 6.45 30.36 13.71
2002 18.53 12.78 5.76 25.32 11.57
2003 17.40 12.14 5.26 24.61 10.23
2004 16.98 11.68 5.30 24.60 10.00
2005 16.61 11.56 5.05 24.95 9.33
2006 13.44 9.17 4.27 20.41 7.70
-5000 -4000 -3000 -2000 -1000 0 1000 2000 3000 4000
1992 1993 1994 1995 1996 1997 1998 1999 2000 2001 2002 2003 2004 2005 2006 Years
[image:8.595.71.520.476.770.2]Source: Central Bank of Turkey
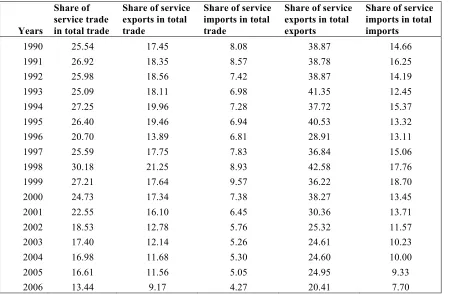
Table 2 shows the share of trade in services that are based on balance of payment. The
first column in the table shows the share of service exports and service imports in the total
exports and imports of goods and services. From 1998, the share of trade in services in total
trade reduced significantly. In 1998, the share of service trade was reduced from 30% in 1998
to 13% in 2006. The share of service exports in total exports decreased from 41.4% in 1993 to
25.3% in 2002 and to 20.4% in 2007. The share of service import in total imports decreased to
12.5% in 1993, to 11.6% in 2002, and to 7.7% in 2007.
The previous tables and figures show that the service sector had an important and
increasing role in total economic activity in the period under study. Additionally, although
trade in services gave surplus from the 1980s, the share of trade in services in total trade was
a decreasing trend. Therefore, it is an advantage for Turkey, which is suffering from high
levels of current account deficits, to direct its resources to promote trade in services. Thus, our
intention is to analyse the service sector in more detail by studying sub-sectors that are
specified in the balance of payments such as transportation (including the transportation of
goods, passengers and luggage), tourism, construction, financial services, public services
(including diplomatic payments) and other services (such as insurance, postal services,
telecommunication, payments on intellectual and property rights and services regarding
[image:9.595.76.466.488.723.2]special privileges).
Figure 3. Trade in services
-500 0 500 1000 1500 2000 2500 3000 3500 4000 4500
1984 1986 1988 1990 1992 1994 1996 1998 2000 2002 2004 2006
years tr ad e b al an ce s (m il li on d ol lar s) TRANSPORTATION TOURISM CONSTRUCTION FINANCIAL SERVICES PUBLIC SERVICES OTHER SERVICES TOTAL SERVICES
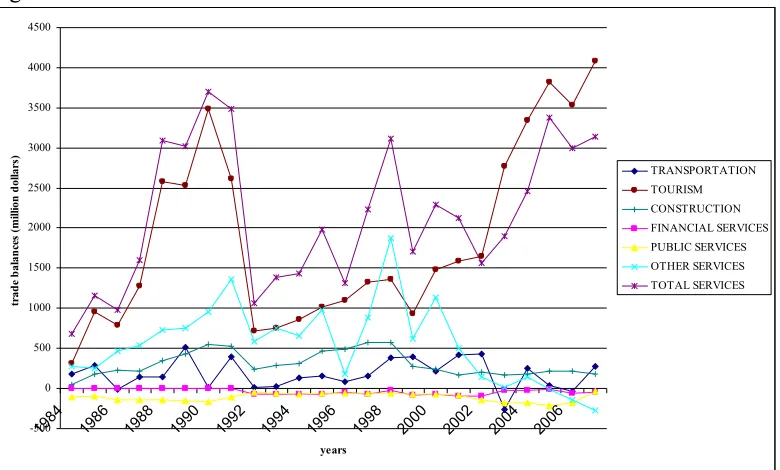
Figure 3 shows trade balances for these sub-sectors of trade in services. All sectors
other than public services and financial services give trade surplus. Recent figures show that
the trade balance of all services other than tourism shows a decreasing trend. For example,
since the late 1990s, there has been a considerable reduction in construction and other
services. On the other hand, since 2003, the trade balance of the tourism sector is greater than
the trade balance of total services. This brings the conclusion that tourism is the major sector
for trade in services, and tourism and transportation together account nearly more than 60% of
trade in services both in exports and imports (see appendix 1).
4. The Econometric Analysis of Trade in Services in Turkey: the elasticity approach
4.1. Literature Review
In the literature, one way to investigate the determinants of trade flows is the
elasticities approach, which estimates the import and export demand functions. In most
studies, export (import) demand volumes are regressed on exchange rates, relative export
(import) price and world (domestic) real income6. Furthermore, there has been growing
interest in the price and income elasticities in the trade of goods for different countries and
economic regions7.
Studies have been conducted on the trade elasticity of imports and exports of goods for
the Turkish economy. The relationship between Turkey's export and exchange rates is
controversial. For example, studies like that of Celasun and Rodrick (1988) found little
support for establishing a relationship between export and exchange rate policy, whereas
studies like Arslan and Wijnbergen (1993) found a positive relationship between the exports
and domestic depreciation of the currency. Nevertheless, there are studies showing that the
Marshal–Lerner condition holds as the absolute values of estimated price elasticities for
imports and exports of goods sum up to more than unity (Simsek and Kadilar, 2004; Togan
and Berument, 2007).
For the income elasticity of goods exports, Aydin et al. (2004) found a positive
relation, with elastic income in the long run and inelastic income in the short run. Ozkale and
Karaman (2006) showed that Turkey’s import demand is income elastic and price inelastic.
However, Ozkale et al. (2006) found inelastic income elasticity for the period after the
6
See, for example, Tadesse (2009), Marquez (2005), Bahmani-Oskoeeand Hegerty (2009)and others.
7
establishment of the customs union between Turkey and the EU (for the period between 1996
and 2004), with negative sign for income elasticity coefficient. Simsek and Kadilar (2004)
found that there is a long-term relationship between the export or import of goods and price
and income. Aydin et al. (2004) and another recent study by Togan and Berument (2007)
found elastic foreign demand for exports of goods with a positive sign.
However, little attention in the literature has been given to studying the service sector
empirically. Firstly, Marquez (2005) studied the elasticities for the US trade in services. He
concluded that estimated elasticities vary across different types of services and also the
income elasticity for U.S. exports of services was significantly greater than the income
elasticity for U.S. imports of services. In another study, El Khoury and Savvides (2006)
examined the relationship between openness in services trade (telecommunication and
financial) and economic growth. Trade in services in Turkey is an area that has not been
studied much empirically. However, sectors such as tourism and construction have been
popular, since these sectors are important in terms of their contribution to total production,
employment and trade (see appendix 1 for the share of these sectors in total exports or
imports). For example, Tosun (2000) studied the factors that emerged as challenges to
sustainable tourism development.
4.2. Theoretical Framework
The effect of income and the real exchange rate on international trade is well
recognised in the literature. To examine to what extent movements in the balance of trade of
services are explained by change in relative prices, income and exchange rate we employ the
imperfect substitute model (Goldstein and Khan, 1985) for the export and import demand
function, where we assume that foreign and domestic products are imperfect substitutes.
Xit = f(Pxit,Pt*,Yt*) (1)
Where t denotes the time period of estimation, Xit is the export value of ith type of
service in Turkey, Pxi is the export price of ith type of service in Turkish Lira, P* denotes the
foreign price deflator in Turkish Lira, and Y* is foreign real GDP expressed in New Turkish
Lira. If we divide right-hand side of equation (1) by foreign prices Pt*, due to the linearity of
demand functions the export demand is not going to change (Goldstein and Khan, 1985).
Therefore, the logarithmic form of the export demand function is as follows:
Where LnXit is the natural log of export value for ith service, Ln(Pxit/Pt*) is the natural
log of relative export prices for considered service categories and Ln(Yt*) is the natural log of
the foreign income. Finally, εt is the error term.
However, this approach used in equation 2 is not feasible because import and export
prices are not available for services. An alternative approach used in the literature is to specify
a direct relation between export value and the real exchange rate in one equation and import
value and real exchange rate in another. Studies such as those by Bahmani-Oskooee and
Economidou (2005), Bahmani-Oskooee and Ratha (2008), Irandoust et al. (2006), and Kwack
et al. (2007) used real exchange rates in their studies to calculate the exchange rate elasticity.
Therefore, the alternative log-linear form of the export demand function can be written as
follows:
LnXit = α0 + α1 Ln(Et) + α2 Ln(Yt*) + εt (2a)
Where Et is the real exchange rate calculated by (ER.P*)/P, ER is the nominal
exchange rate represented in domestic currency per foreign currency. We followed Irandoust
et al. (2006) and Kwack et al. (2007) and used GDP deflator both for domestic and foreign
price (see appendix 2 for data description). Variables are in natural log forms.
We expect the coefficient of relative export price c1 and α1 in equation 2 and 2a to be
negatively related to export volume as an increase in domestic prices will decrease demand
for export while a foreign price increase will raise demand for export. It is difficult to define
the sign of income elasticity c2 and α2 as it can have different signs. From one side, increase in
the foreign income can raise demand for Turkish export. However, if foreign services are
highly competitive with Turkish export foreign income in this case can have a negative effect
on the export volume from Turkey.
The standard form of the import demand function can be expressed by the following
equation:
Mit = f(Pmit,Pt,Yt) (3)
Where Mit is the import value of ith type of service in Turkey, Pmit denotes the import
price of each type of service in New Turkish Lira, Ptdenotes domestic price deflatorand Ytis
domestic real GDP. Following the analysis made in export demand function extraction we can
divide the right-hand side of equation (3) by domestic prices Pt. As a result, the estimated
import demand function is as follows:
Where LnMitis the natural log of import value for ith category of service, Ln(Pmit/Pt)
is the natural log of relative import prices, and Ln(Yt) is the natural log of the domestic
income. Finally ut is the error term.
For import demand we applied the same method to export demand function and used
real exchange rate in the equation. Then, the alternative log-linear form of the import demand
function can be written as follows:
LnMit = β0 + β1 Ln(Et) + β2 Ln(Yt) + ut (4a)
Where Et is the real exchange rate and Y is the domestic output. We assume that the
relative import prices coefficients γ1 andβ1 will be negatively related to the import quantity as
according to the demand theory, an increase in the import price will reduce the import
demand while an increase in domestic prices will raise demand for import. However, income
coefficients γ 2 andβ2 can have a positive as well as negative effect on the import demand. If
there are no any alternatives for imported goods in the domestic production, income will have
a positive effect on the import volume. However, the opposite effect was also found in some
studies. Thus Sinha (2001) found that income has negative effect on import demand in India
and Sri Lanka. Therefore, there is no certain expected sign for income elasticity.
4.3. Unit Root Results
Firstly we need to investigate the integration properties of the variables necessary for
estimation of export and import demand models (see appendix 3). The variables investigated
for the unit root are total services, transportation, tourism, construction, finance, public
services and other services. These variables are considered for export and for import demands
separately Xit andMit. Additionally, we used real exchange rate, Et, domestic GDP, Yt and
foreign GDP, Yt*.
In order to test the integration properties of variables, we used the Dickey and Fuller
(1979), Augmented Dickey-Fuller (ADF) test, the Phillips-Perron (1988) test, the
Kwiatkowski, Phillips, Schmidt, and Shin (1992) KPSS test, and finally the Elliott,
Rothenberg, and Stock (1996) DF-GLS unit root tests. The ADF test constructs a parametric
correction for higher-order correlation. The lag length for the ADF tests was selected to
ensure that the residuals were white noise. Testing for the integration properties of variables
the Phillips-Perron test proposes a nonparametric method of controlling for serial correlation.
This method estimates the non-augmented Dickey-Fuller test. In the DF-GLS test, the simple
power. The main difference of the KPSS test from the other tests described above is that the
series are assumed to be stationary (no unit root) under the null hypothesis, while the null
hypothesis of the tests described above assumes the non-stationarity of series.
The tests for the individual time series are presented in appendix 3, while the empirical
results for their first differences are not presented here due to considerations of space. Every
test includes results of estimations with constant or with constant and trend together.
Stationarity columns (S) show the level of integration of series, where I(0) denotes the
stationarity of a variable or absence of the unit root, and I(1) indicates the non-stationarity of
a variable or existence of the unit root.
It is obvious that at conventional levels of significance almost none of the variables
represent a stationary process when they are in levels. However, differencing these series
produces stationarity. One variable requests special attention; that is the total services for
export. The non-stationarity of these series is rejected by the majority of tests and stationarity
is accepted by the KPSS test in both cases. Therefore, we conclude that all considered
variables except total services and relative prices series are integrated in order 1 or I(1), and
found evidence of unit root. Since we established that total services are found stationary,
therefore their deviations from any linear combination of variables in the export and import
demand models are going to be stationary. For this reason we can not continue to consider
total services in the cointegration procedure.
4.4. Cointegration Test Results
We used different estimation procedures such as the Engle and Yoo (1987) Ordinary
Least Square (OLS) test, the Phillips and Hansen (1990) fully modified OLS – the FM-OLS
test, the Saikkonen (1991), the Stock and Watson (1993), the dynamic OLS (DOLS) test, the
Autoregressive Distributed Lag (ARDL) and the multivariate maximum likelihood procedure
of Johansen (1988, 1991) JOH-ML to test the cointegration relation between exchange rates
and monetary variables. Each method has different advantages and disadvantages. For
example, the OLS estimates provide consistent coefficients of the long-run model, but
standard errors are unreliable, whereas the long-run model estimates suffer from small-sample
bias. Therefore, the OLS estimators showed little evidence of efficiency. In the DOLS
estimates, however, leads and lags eliminate asymptotically any possible bias due to
endogeneity or serial correlation. Therefore, they are asymptotically efficient in Saikkonen’s
random mixture of normals. Additionally, the ARDL and JOH-ML estimates are also
asymptotically efficient and yield covariance matrices appropriate for inference. However, the
JOH-ML method is sensitive to the number of lags included and this method does not perform
very well in small samples.
a. Cointegration Coefficient Estimates
The stationarity of the linear combination of a group of non-stationary series is defined
by the cointegration test. In order to find the long-run equilibrium relationship among
variables, the linear combination of the non-stationary time series has to be stationary. The
cointegrating coefficients are estimated by using different estimation procedures such as the
OLS, DOLS, ARDL and JOH-ML. It is common in the literature to include two lags and two
leads in DOLS estimates (Stock and Watson, 1993). In ARDL, we decided the appropriate the
autoregressive order by using the Akaike Information Criterion (AIC)8. In JOH-ML
estimates, one important thing is the selection of lag order. We focus mainly on two selection
criteria that are commonly used in the literature: the Sims (1980) sequential modified
likelihood ratio (LR) test and the Schwarz criterion (SC). We used a maximum lag order of
11, and modified LR. It selects eleven lags for import of tourism and eight lags for export of
tourism, while seven lags were chosen for import of public services. Six lags were preferred
for import of transportation services, other services and total services for export of
transportation service. Five lags were chosen for exports of construction, public services and
others services. We rely on modified LR for the reason that there is no evidence for
[image:15.595.87.452.615.717.2]heteroskedasticity and no serial autocorrelation9 for these lag orders.
Table 3. Cointegration coefficient estimates
Export Coefficients OLS FM-OLS DOLS ARDL JOH-ML
Transport α1 -0.001 -0.001* -0.001 -0.001** 0.008***
α2 0.122*** 0.113*** 0.111*** 0.134*** -0.095***
Tourism α1 -0.003*** -0.002** -0.005*** -0.001*** 0.009***
α2 0.030 0.014 -0.043** 0.069** 0.051***
Construction α1 -0.003*** -0.003*** -0.003*** -0.001 0.012***
α2 -0.029* -0.022** -0.009 -0.112* -0.027
Finance α1 -0.001 -0.001 -0.003** -0.001* -0.003
8
Also, we followed the traditional method and used AIC for determining the appropriate autoregressive lag order in cointegration tests (to see whether the residuals are stationary).
9
α2 0.165*** 0.146*** 0.249*** 0.169*** -0.006
Public services α1 -0.005*** -0.005*** -0.007*** -0.002* 0.015***
α2 -0.033* -0.041* -0.083*** 0.023 0.095**
Other services α1 -0.002*** -0.002*** -0.003*** -0.001 0.010***
α2 -0.095*** -0.079*** -0.063*** -0.120 0.058*
Import
Transport β1 -0.005*** -0.005*** -0.007*** -0.001 0.011***
β2 0.749*** 0.659*** 1.119*** 0.223*** -0.663**
Tourism β1 -0.002*** -0.002*** -0.003*** -0.001** 0.012***
β2 0.485*** 0.242** 0.374** 0.028 0.838***
Finance β1 -0.002** -0.001 -0.003* -0.002*** 0.103***
β2 0.812*** 0.799*** 2.209*** 0.167 30.460***
Public services β1 -0.003*** -0.002*** -0.004*** -0.002** 0.009***
β2 0.409*** 0.191* 0.070 0.702*** 0.589*
Other services β1 -0.001* -0.001 -0.001 -0.001*** 0.004**
β2 -0.092 -0.095 -0.431** 0.106* 1.108***
Total services β1 -0.002*** -0.002*** -0.003*** -0.001* 0.005***
β2 0.299*** 0.192** 0.189* 0.175* 0.155
*, **, *** indicate significance at 10%, 5% and 1% levels, respectively; standard errors for the coefficient estimate are given in parenthesis.
α1 and β1 are elasticities of exchange rates for export and import respectively from equations 2a and 4a
α2 andβ2 areelasticities of income for export and import respectively from equations 2a and 4a
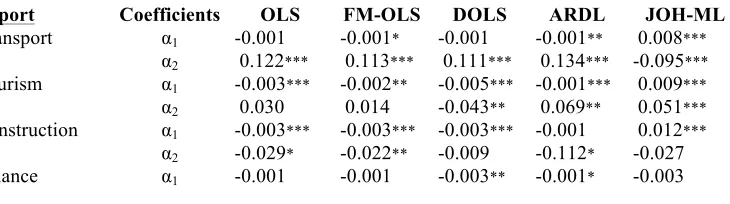
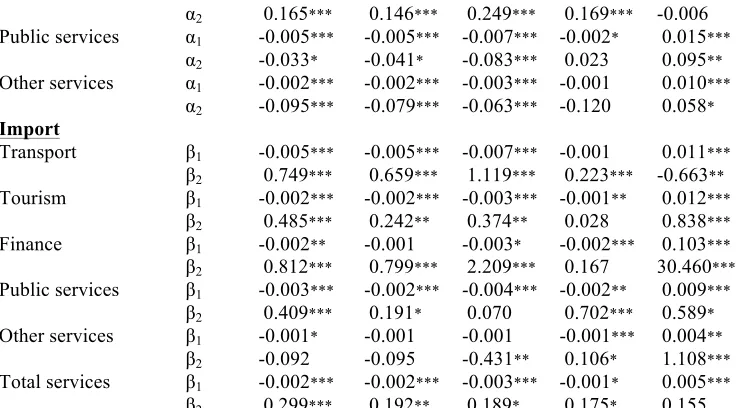
Table 3 reports coefficient estimates for chosen cointegration tests which represent
long-run elasticities of exchange rate and income. We assumed that α1 and β1 which are
exchange rate coefficients of export and import, respectively, are negatively related to trade
flow of services. From the table we can see that exchange rate elasticities of almost of all
reported services produced negative sign and the majority of estimates show significance at
1% level, which confirm negative relations between the exchange rate and trade flows of
services. Only JOH-ML provided opposite results for all service categories except import for
commercial services showing high significance level for all estimates. However, as discussed
above, especially the JOH-ML test is very sensitive to lags choice and may not be reliable in
small samples. Analysing the values of statistically significant elasticity estimates, we have
enough evidence to conclude that the long-run exchange rate elasticities of both the export
and import of considered service categories are inelastic and in addition they came out to be
nearly zero. In most of the estimations, exchange rate coefficients gave similar results for the
different estimation techniques used in this study. This is consistent with the results of Ozkale
et al. (2006), where they concluded that price is inelastic and the sign of the real exchange rate
is negative for the export demand function for goods trade. Another recent study by Togan
and Berument (2007) also found that the CPI-based real exchange rate for the export demand
function is inelastic but positive in sign. Yet, they also found that the real exchange rate is
elastic for the import demand function for goods with a negative sign. Aydin et al. (2004), on
[image:16.595.75.444.70.274.2]for the exports or imports of goods, exchange rate elasticity might give different results and
might show conflicting relations. In our study, we found no evidence to assume that in Turkey
the appreciation or devaluation of exchange rate seriously might affect the trade flow of
considered services in the long run.
For income coefficients α2 andβ2 of export and import, respectively, we did not define
certain positive or negative relation on services trade flow. So, we may assume that when
there is an increase in foreign income then we may expect an increase in Turkish exports,
giving positive sign of elasticities. In consideration of import demand it can be assumed that
an increase in the domestic level of income is expected to increase the demand for imports.
However, in the case of Turkey, where it is the competitive producer of imported services,
then the relation between domestic income and services imported can be expected to have a
negative sign. Our findings show that we have enough evidence to assume a positive
relationship between income and foreign trade, since estimations of transport and trade that
accounts for the majority of trade in services give a positive sign (appendix 1). However, in
some sectors, such as the construction and other services, the estimations of income
coefficients provide a negative sign. So, it is important to analyse each category of services
separately.
All coefficient estimates of income for transportation service for both export and
import were found to be statistically significant at the 1% level. The signs of these
coefficients are positive for OLS, FM-OLS, DOLS and ARDL test, while JOH-ML estimates
performed a negative sign for export as well as for import trade flows. The positive sign of
income elasticity for both export and import shows that with an increase in income, Turkey
and the considered foreign countries have higher preferences for imported transport service
than for a domestic one. The estimations show that the long-run income elasticity of transport
service export is close to 0.1 or inelastic. Therefore, the Turkish export of transport service in
the long run is not significantly affected by the changes in foreign income. The values of
statistically significant income elasticities for the import of transport service vary through all
tests, having the same positive sign except JOH-ML. It varies from 0.2 to its highest value of
1.1. It is obvious that income elasticities for the import are much higher than for the export of
transportation service, even if they are still inelastic or close to unitary elasticity. Therefore,
there is enough evidence to conclude that the import of transportation service is more
positively responsible for the changes in domestic income than the export to the changes in
The long-run income elasticities for tourism show a positive sign in both export and
import demand functions, except for the DOLS test, where the income elasticity of export
demand appeared negative with 5% significance. The income elasticity of export for tourism
in Turkey is found to be around 0.05, which is the long-run inelasticity of income for export
demand in Turkey. It means that in the long run changes in foreign income do not affect the
changes in the export of tourism in Turkey. However, if we look at the import of tourism
service, we see stronger evidence for the significance of long-term income elasticity. In the
dependence of cointegration tests, the income elasticity of import is changing from 0.2 to 0.8.
These results again indicate the inelastic income elasticity in the import demand of tourism
service in Turkey. However, these figures are much higher than the income elasticities of
export demand in the tourism sector and even they approach unitary elasticity. Therefore, it
can be concluded that the import of tourism service in Turkey is more sensitive to changes in
domestic income than the export of tourism service in Turkey to changes in foreign income.
With increase in income, Turkish customers prefer to increase their travel abroad, while the
increase in the income of considered foreign countries does not affect their decisions for
travel to Turkey.
As mentioned above, the construction service in this study is considered only for
export, because there is no official data in Turkey for the import of construction services. All
cointegration tests indicate a negative relationship between changes in foreign income and
changes in the export of the commercial services of Turkey. It means with an increase of
income in foreign countries the export of construction service of Turkey tends to fall.
However, the significance of income coefficients does not provide enough evidence in results
to make any conclusion. The case of construction can be considered separately in further
studies as Turkey mainly exports its construction service to Eastern European countries, while
the group of foreign countries considered in this study does not include enough eastern
countries to make a full conclusion about the elasticity of income for the export of the
construction services of Turkey.
The cointegration coefficient estimates for the export of public services presented
different signs. The OLS, FM-OLS and DOLS tests revealed a negative relationship between
foreign income and export demand, while the ARDL and JOH-ML tests indicated positive
relationships. Therefore, we do not have enough evidence for the long-run income elasticity
for the export of public services in Turkey. However cointegration coefficients for the income
in the import of public services are more consistent with each other. All of the β2 coefficients
significance of these coefficients for the OLS and ARDL tests allow us to conclude that the
long-run income elasticity of public services of import demand is inelastic, but close to
unitary elasticity 0.7 (the ARDL test). An increase in domestic income leads to a slighter
increase in the import of public services.
The majority of income cointegration coefficients for the export of other services
produced negative signs in the considered tests, except for the JOH-ML. The high level of
statistical significance, 1%, allows us to conclude that the long-run income elasticity of the
export of other services is inelastic and that any increase in foreign income leads to no
significant diminishing changes of the export of other services of Turkey. However, it is
difficult to conclude anything about the long-run income elasticity of the import of other
services as signs of coefficient estimates appeared to be heterogeneous in different
cointegration tests. The OLS, FM-OLS and DOLS tests produced negative signs, while the
ARDL and JOH-ML tests performed positive sign.
As was mentioned above, we tested the cointegration of total services only for
imports, due to the stationarity of the total services series for export (see Table 1). All income
coefficients of the import for total services β2 cameout homogenous in sign as well as in value.
A positive relationship was found between domestic income and the import of total services
with an elasticity value of about 0.2-0.3. The statistical significance of coefficient estimates
provides enough evidence to conclude that the long-run income elasticity of the total services
import is inelastic; however, we can see that increase in domestic income induces a slight
increase of total services’ import.
In general, we found that the long-run exchange rate elasticities have negative signs
for all of the service categories of export and import demand functions and that they are
inelastic. In another words, the fluctuations of exchange rate do not affect the trade flow of
services in Turkey in the long run. We found strong evidence of positive values for income
elasticities. Additionally, in contrast to Marquez (2005), we found that income elasticity for
imports is significantly greater than income elasticity for exports for different categories of
services. Furthermore, transportation and tourism are two major groups and income
elasticities for the import and export of transportation were found to be inelastic; however,
income elasticity for the imports of transportation was greater than the income elasticity for
the exports of transportation. Income elasticity for imports of tourism was found inelastic with
positive sign. In addition, we found that the long-run income elasticity of imports for total
services is inelastic, which means that the increase in domestic income slightly affects the
b. Cointegration Test
In this section, we report the cointegration test results for the selected service
categories in order to find whether the residuals of the tested variables are stationary. Export
of total services is not included in the cointegration test as these series were found to be
[image:20.595.74.394.273.462.2]stationary (see appendix 3).
Table 4.Cointegration test results
Export OLSa FM-OLSa DOLSa ARDLa JOHb
Transport -0.20 -0.35** -0.25* -0.90*** 33.52** (1)
Tourism -0.17 -1.07*** -0.99*** -0.83* 84.50*** (3)
Construction -0.13 -0.33*** -0.26 -0.94* 48.61*** (3)
Finance -0.21 -0.22 -0.49** -0.61 60.37*** (2)
Public services -0.34** -0.34** -0.30** -1.16** 44.73*** (1)
Other services -0.14 -0.34** -0.32 -0.93** 45.17*** (1)
Import
Transport -0.20 -0.27* -0.19 -1.02*** 33.10** (1)
Tourism -0.24 -0.31** -0.31 -0.80** 144.26***(2)
Finance -0.20 -0.22 -0.28 -1.44** 36.69*** (1)
Public services -0.24 -0.38*** -0.26 -0.52 36.61*** (1)
Other services -0.21** -0.15 -0.16 -0.93*** 27.35* (0)
Total services -0.23* -0.20 -0.21 -1.07*** 39.53*** (1)
*, **, *** indicate significance at 10%, 5% and 1% levels, respectively; standard errors for the coefficient estimate are given in parenthesis.
a
OLS, FM-OLS, DOLS and ARDL tests of H0: No cointegration, significance based on MacKinnon (1991) b
Johansen one-sided upper-tail test of H0: No cointegration; 10, 5, and 1% critical values equal -27.07, -29.8, and -35.46
respectively. Numbers of cointegration equation(s) at the 5% significance level are shown in parenthesis. Number of lags are shown in Table 5.
Table 4 presents the cointegration test results by using the OLS, FM-OLS, DOLS,
ARDL and Johansen tests, as discussed earlier. We used alternative tests to find cointegrating
relationships in order to control their results and to maximize the power of the found
evidence. We reject the hypothesis of no-cointegration for a selected series if three or more
tests presented its cointegration.
Based on the results represented in Table 5, we found strong evidence of the
cointegrating relationship in the following export categories of services: transport, tourism,
construction, public services and other services with varying levels of significance. On the
other hand, we found weak evidence for cointegration where only two tests, the DOLS and
can be concluded that there is strong support for a long term relationship between export,
exchange rate and income in selected service categories other than finance.
Testing service import categories only for tourism series, existence of cointegration
can be confirmed with 1 and 5% significance level. There is enough evidence to assume that
there is cointegration in sectors such as transport, other services and total services with 10, 5
and 1% significance levels. However, in the public services series with a 1% significance
level, only in two (FM-OLS and JOH) out of five considered tests and only 2 tests confirmed
cointegration in finance. Therefore, we can conclude that import demand functions for finance
and public services are a short-run phenomenon and there are no long-run relationships exist
for these series.
c. Error Correction Model
The vector error correction model is designed only for cointegrated series. The vector
error correction model specifies the short-run adjustment dynamics that play an important role
in the long-run relationships of variables. The deviations from long-run equilibrium are
gradually adjusted by defined short-run dynamics. In previous part we did not find support for
a cointegration relationship in the export and import series of financial services, or the import
series of public services. Therefore, these series can not be included in the vector error
correction model.
Table 5 presents the results for vector error correction model estimates. Error
correction terms of λ1 for the export and µ1 for the import of services were not found
statistically significant in any service category. At the same time, the exchange rate error
correction terms λ2 and µ2 were found to be highly statistically significant almost in all service
categories for both export and import, respectively. In addition to these, the signs of the error
term for exchange rates were consistent with the negative sign of the long-run exchange rate
elasticity found in Table 3. We found strong support for concluding that in the short-run
exchange rate plays a very important role in the long-term behaviour of import and export
demands. Thus, it was found that in all categories, more than 100% of the disequilibrium of
the export and import of selected services each quarter is corrected by exchange rate. About
26% of disequilibrium in the export of tourism service is adjusted by foreign income, while
45% of disequilibrium in the import of tourism service is adjusted by domestic income each
quarter. In other words, when deviations from the long-run equilibrium occur in the exports
primarily the exchange rate that adjusts to restore long-run equilibrium each quarter, rather
[image:22.595.76.528.177.315.2]than foreign or domestic income.
Table 5. Vector error correction
Export k λ1 λ2 λ3 Import k µ1 µ2 µ3
Transportation 6 -0.03 -40.78*** -0.06 Transportation 6 0.04 -35.67** -0.01
(0.06) (9.39) (0.02) (0.06) (8.80) (0.05)
Tourism 8 -0.13 -118.60*** -0.26*** Tourism 11 0.04 -55.48*** -0.45***
(0.17) (20.74) (0.04) (0.12) (10.46) (0.04)
Construction 5 -0.03 -37.93 -0.02 Other services 6 -0.09 -25.23*** -0.09**
(0.06) (7.63)*** (0.02) (0.01) (2.60) (0.02)
Public services 5 -0.23*** -22.09*** -0.03** Total 6 -0.13 -49.83** -0.08
(0.07) (6.41) (0.01) (0.07) (12.51) (0.06)
Other services 5 -0.07 -31.64** -0.02
(0.07) (7.83) (0.02)
*, **, *** indicate significance at 10, 5, and 1%levels, respectively (Banerjee, A., Dolado, J.J. and R. Mestre (1992)). Standard errors in parenthesis.
k – lag, chosen according to modified LR test results.
λ1 , λ2 , λ3 -measure the speed of adjustment of the export of selected service categories, exchange rate and foreign income, respectively towards the equilibrium,
µ1 , µ2 , µ3
-measure the speed of adjustment of the import of selected service categories, exchange rate and domestic income, respectively towards the equilibrium.
5. Conclusion
This study determined the major concepts behind trade in services including the global
trends and recent developments in Turkey. There has been an increasing role of the service
sector and its contribution in economic activity, especially in emerging markets. The GATS
rules, however, were found to be ineffective in the case of Turkey, despite the decrease in
their implementation share of the service trade in the last decade. Recent figures show that the
trade in services in the Turkish economy has shown a downward trend even though its share
in the contribution has increased significantly. Additionally, this study estimated the export
and import demands of Turkey using the empirical framework of Goldstein and Khan (1985).
The results for cointegration coefficient estimates are broadly consistent across alternative
estimators with some exceptions. The long-run exchange rate elasticities of almost all of the
selected service categories reported negative sign with a high statistical significance level and
indicated inelasticity almost close to 0. So, we can conclude that exchange rate is considered
as an insignificant factor in determining the export and import demand for services, which is
income elasticities for both the export and import series were found to be higher than the
exchange rate elasticities. At the same time, the long-run income elasticities for the import of
various service categories were found to be higher than the income elasticities for export
elasticities in bounds of unitary elasticity.
We found strong evidence of a long-term relationship in the export demand of the
transport, tourism, public services and other services and in the import demand of the tourism
service. Weak evidence of a long-term relationship was found in the export demand of
construction and in the import demand of the transport, public services, other services and
total services, while there is no support indicated for a long-term relationship in the import of
public services. The error correction model presented interesting results. While the long-run
exchange rate and income elasticities were found inelastic, we found proof of a high exchange
rate effect on export and import disequilibrium. We found that more than 100% of the
disequilibrium of export and import in Turkey are adjusted by exchange rate every quarter.
Even though in the long run in both cases exchange rate and income elasticities were
found inelastic, the effect of income elasticity on the export and import of services is much
higher than effect of exchange rate elasticity. The ineffectiveness of the GATS rules in the
case of Turkey due to the country-specific social, political or institutional factors may slow
down the effect of any measures for promoting trade in services. However, based on the
results, Turkey has to follow the trends of changes in consumer preferences that can help the
tradability of services in Turkey and abroad.
For further study, the analysis may be extended by including other emerging
economies to analyse the determinants of import and export demand in services. Moreover,
export supply with other variables such as labour costs may be introduced in the model.
Furthermore, the focus of the analysis may be on the estimation of the elasticities at the
bilateral trade level (even though we are aware of the lack of availability in the services trade
data). Alternatively, other price measures may be used for relative prices in the model for the
reason that there is no official price measure either for the domestic service sector or the
export/import prices for services in Turkey. Other econometric techniques may be used for a
6. References
Arslan, I., and Wijnbergen, S.V. 1993. Export incentives, exchange rate policy and export growth in Turkey. The Review of Economics and Statistics 75(1): 128-133.
Aydin, M.F., Ciplak, U., and Yucel, M.E. 2004. Export supply and import demand models for the Turkish economy. The Central Bank of the Republic of Turkey Research Department Working Paper 04/09.
Bahmani-Oskooee, M., and Kara, O. 2005. Income and Price elasticities of trade: Some new estimates. International Trade Journal 19(2): 165-78.
Bahmani-Oskooee, M., and Economidou, C. 2005. How sensitive are Britain’s inpayments and outpayments to the value of the British pound. Journal of Economic Studies 32: 455-467.
Bahmani-Oskooee, M., and Ratha, A. 2008. Exchange rate sensitivity of US bilateral trade flows. Economic Systems 32: 129-141.
Bahmani-Oskooee, M. and Hegerty, S. W. 2009. The Japanese –U.S. trade balance and the yen: Evidence from industry data. Japan and the World Economy 21(2): 161-171. Banerjee, A., Dolado, J.J., and Mestre, R. 1992. On some simple tests for cointegration: The
cost of simplicity. Bank of Spain Working Paper 9302.
Barhoumi, K. 2005a. Exchange rate pass-through into import process in developing countries: an empirical investigation. Economics Bulletin 3(26): 1-14.
Barhoumi, K. 2005b. Long-run exchange rate pass-through into import prices in developing countries: An homogenous or heterogeneous phenomenon? Economics Bulletin 6(14): 1-12.
Bhagwati, J. 1984. Splintering and disembodiment of services and developing countries. The
World Economy 7(2): 133-44.
Caporale, G., and Chui, M. 1999. Estimating income and price elasticities of trade in a cointegrating framework. Review of International Economics 7(2): 254-64.
Celasun, M., and Rodrik, D. 1988. Some policy dilemmas in Turkish macroeconomic management. Kennedy School of Government Discussion Paper 173D. Harvard University.
Chanda, R. 2003. Social services and the GATS: key issues and concerns. World
Development 32(12): 1997-2011.
Dickey, D.A., and Fuller, W. A. 1979. Distribution of the estimators for autoregressive time series with a unit root. Journal of the American Statistical Association 74: 427-431. El Khoury, A.C., and Savvides, A. 2006. Openness in services trade and economic growth.
Economics Letters 92: 277-283.
Elliot, G., Rothenberg, T.J., and Stock, J.H. 1996. Efficient tests for an autoregressive unit root. Econometrica 64: 813-836.
Engle, R., and Yoo, B.S. 1987. Forecasting and Testing in Cointegrated Systems. Journal of
Econometrics 35: 143-159.
Goldberg, P., and Knetter, M. 1997. Goods prices and exchange rates: What have we learned?
Journal of Eonomic Literature 35(3): 1243-1272.
Goldstein, M., and Khan, M. 1985. Income and price effect in foreign trade. In: Jones, R.W., Kenen, P.B. (Eds.), Handbook of International Economics. Amsterdam, North Holland, pp. 1042–1099.
Hooper, P., Johnson, K., and Marquez, J. 1998. Trade elasticities for G-7 countries, International Finance Discussion Paper 609. Washington: Board of Governors of the Federal Reserve System.
Irandoust, M., Ekblad, K., and Parmler, J. 2006. Bilateral trade flows and exchange rate sensitivity: Evidence using likelihood-based panel cointegration. Economic Systems 30 (2): 170-183.
International Monetary Fund. 2006. Exchange rates and trade balance adjustment in emerging market economy. Prepared by the Policy Development and Review Department. In collaboration with the Research Department and in consultation with other Departments. Approved by Mark Allen, October 10.
Jara, A., and Carmen Dominguez, M. 2006. Liberalisation of trade in services and trade negotiations. Journal of World Trade 40(1): 113-127.
Johansen, S. 1988. Statistical analysis of cointegrating vectors. Journal of Economic
Dynamics and Control 12: 231-254.
Johansen, S. 1991. Estimation and hypothesis testing of cointegration vectors in Graussian vector autoregressive models. Econometrica 59: 1551-1580.
Kee, H., Nicita, A., and Olarreaga, M. 2004. Import demand elasticities and trade distortions. Policy Research Working Paper 3452. Washington: The World Bank.
Kwack, S.Y., Ahn, C.Y., and Yang, D.Y. 2007. Consistent estimates of world trade elasticities and an application to the effects of Chineese Yuan (RMB) appreciation.
Journal of Asian Economics 18: 314-330.
Kwiatkowski, D., Phillips, P.C.B., Schmidt, P., and Shin, Y. 1992. Testing the null of stationarity against the alternative of a unit root: How sure are we that economic time series have a unit root? Journal of Econometrics 54: 159-178.
MacKinnon, J.G. 1996. Numerical distribution functions for unit root and cointegration tests.
Journal of Applied Econometrics 11: 601-18.
Marquez, J. 2005. Estimating elasticities for US trade in services. Economic Modelling 23: 276-307.
Ongan, S. 2008. The sustainability of current account deficits and tourism receipts in Turkey.
The International Trade Journal 22(1): 39-62.
Ozkale, L., and Karaman, F.N. 2006 (in Turkish). Static effects of the EU-Turkey customs union. International Economics and Foreign Trade Policies. Undersecretariat of the Prime Ministry for Foreign Trade.
Phillips, P.C.B., and Hansen, B.E. 1990. Statistical inference in instrumental variables regression with I(1) processes. Review of Economic Studies 57: 99-125.
Phillips, P.C.B., and Perron, P. 1988. Testing for a unit root in time series regression.
Biometrika 75: 335-346.
Robinson, S, Wang, Z., and Martin, W. 1999. Capturing the implications of services trade liberalisation. Paper presented at the Second Annual Conference on Global Economic Analysis, Ebberrup, Denmark, 20-22 June 1999 cited in Hufbauer, G. and S. Stephenson, 2007. Services trade: Past liberalisation and future chanllenges. Journal
of International Economic Law 10(3): 610.
Saikkonen, P. 1991. Asymptotically efficient estimation of cointegration regressions.
Econometric Theory 7: 1-21.
Sampson, G., and Snape, R. 1985. Identifying issues in trade in services. The World Economy
8(2): 171-82.
Simsek, M., and Kadilar, C. 2004 (in Turkish). The cointegration analysis of Turkey’s import demand function with bounds test: 1970-2002. Dogus University Journal 5(1): 27-34. Sinha, D. 2001. A note of elasticities in Asian countries. The International Trade Journal
15(2): 221–237.
Stock, J. H., and Watson, M.W. 1993. A simple estimator of cointegrating vector in high order integrated systems. Econometrica 61(4): 783-820.
Sims, C.A. 1980. Macroeconomics and reality. Econometrica 48 (1): 1-48.
Tadesse, B. 2009. Volatility in exchange rate components and the volume of international trade. The International Trade Journal 23(2): 110-141.
Togan, S., and Berument, H. 2007. The Turkish current account, real exchange rate and sustainability: a methodological framework. The Journal of International Trade and
Diplomacy 1(1): 155-192.
Appendix 1: Share of different types of services in total services trade (%)
3.a. Exports
Transport. Tourism Construction Financial Public Others
1992 12.46 36.39 9.95 1.40 1.61 38.19
1993 11.75 34.48 10.80 1.15 1.26 40.56
1994 11.33 36.96 11.77 0.92 0.75 38.27
1995 11.83 31.17 12.86 1.04 0.90 42.20
1996 13.63 41.52 15.18 2.25 1.25 26.18
1997 12.07 34.14 12.47 1.67 0.99 38.67
1998 13.94 29.79 10.24 2.20 0.73 43.09
1999 17.84 30.95 6.80 1.98 1.35 41.08
2000 15.74 36.87 5.12 1.96 1.45 38.85
2001 19.41 50.36 4.66 2.36 1.01 22.22
2002 21.62 57.13 6.46 1.79 0.56 12.43
2003 14.80 68.24 4.62 2.00 0.67 9.66
2004 15.60 65.80 3.54 1.49 1.25 12.33
2005 19.66 64.28 3.59 1.48 1.52 9.47
2006 18.48 65.68 4.11 1.30 1.44 8.99
2007 22.82 61.86 3.27 1.43 2.12 8.48
3.b. Imports
Transport Tourism Construction Financial Public Others
1992 26.06 19.95 0.00 10.75 9.06 34.18
1993 28.53 22.20 0.00 9.96 8.64 30.67
1994 23.61 21.89 0.00 8.85 8.99 36.66
1995 26.55 17.32 0.00 7.98 7.10 41.05
1996 27.29 19.61 0.00 7.53 6.11 39.46
1997 22.41 20.52 0.00 7.29 5.01 44.76
1998 24.41 18.17 0.00 6.08 4.35 47.00
1999 23.75 16.17 0.00 7.12 5.65 47.31
2000 30.98 20.87 0.00 8.56 6.65 32.93
2001 33.09 27.83 0.00 11.87 8.10 19.10
2002 31.67 30.29 0.00 10.26 10.24 17.54
2003 36.53 28.55 0.00 5.06 10.58 19.28
2004 42.58 25.18 0.00 3.79 9.06 19.39
2005 41.76 25.34 0.00 3.42 10.16 19.30
2006 38.67 24.64 0.00 4.78 9.08 22.83
2007 43.37 22.89 0.00 4.19 5.84 23.70
Appendix 2: Data sources and description
The data sample includes disaggregated data for services in their six categories:
transport, tourism, construction, commercial services; public services; and other services. All
of these categories represent the export and import demands for Turkey, except the
construction category, which is used only for the export demand due to lack of data for the