0095-1137/06/$08.00
⫹
0
doi:10.1128/JCM.00024-06
Real-Time PCR Assay for Detection and Quantification of
Hepatitis B Virus Genotypes A to G
Tania M. Welzel,
1Wendell J. Miley,
2Thomas L. Parks,
2James J. Goedert,
1Denise Whitby,
2and Betty A. Ortiz-Conde
2*
Division of Cancer Epidemiology and Genetics, National Cancer Institute, National Institutes of Health, Department of
Health and Human Services, Rockville, Maryland 20892,
1and Viral Epidemiology Section, AIDS Vaccine Program,
SAIC-Frederick, NCI-Frederick, P.O. Box B, Frederick, Maryland 21702
2Received 5 January 2006/Accepted 3 April 2006
The detection and quantification of hepatitis B virus (HBV) DNA play an important role in diagnosing and
monitoring HBV infection as well as assessing therapeutic response. The great variability among HBV
genotypes and the enormous range of clinical HBV DNA levels present challenges for PCR-based amplification
techniques. In this study, we describe the development, evaluation, and validation of a novel real-time PCR
assay designed to provide accurate quantification of DNA from all eight HBV genotypes in patient plasma
specimens. A computer algorithm was used to design degenerate real-time PCR primers and probes based
upon a large number (
n
ⴝ
340) of full-length genomic sequences including HBV genotypes A to H from Europe,
Africa, Asia, and North and South America. Genotype performance was tested and confirmed using 59 genotype
A to G specimens from two commercially available worldwide genotype panels. This assay has a dynamic range
of at least 8 log
10without the need for specimen dilution, good clinical intra- and interassay precision, and
excellent correlation with the Bayer Diagnostics VERSANT HBV DNA 3.0 (branched DNA) assay (
r
ⴝ
0.93).
Probit analysis determined the 95% detection level was 56 IU/ml, corresponding to 11 copies per PCR well. The
high sensitivity, wide linear range, good reproducibility, and genotype inclusivity, combined with a small
sample volume requirement and low cost, make this novel quantitative HBV real-time PCR assay particularly
well suited for application to large clinical and epidemiological studies.
Hepatitis B virus (HBV) is an enveloped DNA virus that
belongs to the family
Hepadnaviridae
(4). Approximately 350
million people are chronically infected with HBV worldwide,
placing them at high risk for developing cirrhosis, end-stage
liver disease, and hepatocellular carcinoma (34). Detection
and quantification of circulating HBV in plasma or serum play
an important role in diagnosing and monitoring HBV infection
as well as assessing response to therapy (27). Clinically, HBV
DNA titers vary greatly, from levels as high as 10
10copies/ml
during acute HBV infection (33), to very low levels in HBe
antigen-negative chronic carriers and in patients undergoing
antiviral therapy, and in those with occult HBV infection (30).
In addition to the wide range of HBV DNA levels likely to
be encountered in patient specimens, there is great variability
within the HBV genome. In combination, these present
tech-nical challenges for developing a quantitative HBV DNA
as-say. To date, eight different HBV genotypes (A to H) have
been identified and defined by sequence divergence of greater
than 8% throughout the genome (23, 24, 29). The various
HBV genotypes have characteristic geographic distributions;
genotype A is prevalent in North America, Europe, South
Africa, and India; genotypes B and C are prevalent in Asia;
genotype D is prevalent in Europe (Mediterranean area), the
Middle East and Far East, India, and South Africa; genotype E
is prevalent in West Africa; genotype F is prevalent in Central
and South America and Alaska; and genotype G is prevalent in
Europe, Mexico, and the United States. Genotype H was
re-cently reported in Central America, the United States, and
Japan (3, 13, 25). In addition, a number of common mutations
have been described in HBV strains (17) and recombinant
genomes have been reported. These include variability within
the basic core promoter, precore/core region, and the pre-S1
gene, which displays great heterogeneity. A number of
vaccine-induced mutations in the S gene major hydrophilic region, as
well as the X gene, and, finally, drug-induced polymerase gene
mutations are common in patients undergoing antiviral
ther-apy.
Among the methods most commonly used for HBV DNA
quantification, including hybrid capture and branched DNA
(bDNA) signal amplification (19–21, 35), assays based on
real-time PCR technology (12) offer the greatest sensitivity and
broad-est linear dynamic range (9, 32). This technology utilizes three
oligonucleotides in the PCR mix: a probe labeled with a
fluores-cent reporter dye and a quenching dye, as well as two primers.
During amplification, the reporter dye is cleaved from the probe
by the 5
⬘
-exonuclease activity of a DNA polymerase, allowing
real-time measurement of the fluorescent light emissions from
the reporter dye. In real-time PCR, there is a direct relationship
between the starting template copy number and the number of
cycles needed to measure a positive signal from the reporter dye.
However, due to the great heterogeneity in HBV genomic
sequences, designing primer-probe sets to detect and quantify
all HBV genotypes by real-time PCR is challenging at best. A
recent report suggested that at least two different primer-probe
sets may be necessary for detection and amplification of all
eight HBV genotypes (8). In the present study, we describe a
* Corresponding author. Mailing address: Viral Epidemiology
Sec-tion, AIDS Vaccine Program, SAIC-Frederick, NCI-Frederick, P.O.
Box B, Frederick, MD 21702. Phone: (301) 7533. Fax: (301)
846-7119. E-mail: [email protected].
3325
on May 16, 2020 by guest
http://jcm.asm.org/
novel, highly sensitive, and accurate real-time quantitative
PCR assay capable of equally detecting and quantifying HBV
genotypes A through G using a single degenerate
primer-probe set within the X gene.
MATERIALS AND METHODS
Plasmid control template and standard curve preparation.The plasmid pAM6 (ATCC 45020D; ATCC, Manassas, VA) was used as the template to prepare the standard curve for the real-time PCR assay and also as a source of HBV DNA for initial testing of all primer-probe sets. This plasmid contains a full-length HBV genomic sequence (nucleotide positions 1 to 3020) inserted into the vector pBR322 (22). Plasmid pAM6 was propagated inEscherichia coliand purified using the QIAprep Spin Miniprep kit (QIAGEN, Valencia, CA). The purified plasmid DNA was digested using endonuclease EcoRI (Invitrogen, Carlsbad, CA), and the insert size was confirmed by agarose gel electrophoresis. The pAM6 DNA was quantified byA260measurement (Spectramax 384Plus, Sunnyvale, CA), and the copy number was calculated based on the plasmid molecular weight. For each experiment, a standard curve was prepared by serial end-point dilution of linearized pAM6 control template DNA. Typically, the standard curve ranged from 5⫻101IU/ml to 5⫻106 IU/ml, with each dilution tested in triplicate reactions. To assess linearity of the assay over an extended range, a standard curve ranging from 5⫻101IU/ml to 5⫻108 IU/ml was prepared and tested.
Assay controls.The Accurun 325 HBV DNA positive control (series 370; BBI Diagnostics, West Bridgewater, MA) was used as the assay positive control. The value assigned to this HBV positive control by the manufacturer, based upon Roche Molecular Diagnostics COBAS AMPLICOR HBV MONITOR test re-sults, was 7.25⫻103copies/ml, corresponding to 1.38⫻103IU/ml. Basematrix 53 diluent (BBI Diagnostics), a defribrinated human plasma product certified negative for HBV DNA, HBsAg, anti-HBc, human immunodeficiency virus (HIV) RNA, anti-HIV-1/2, anti-human T-cell leukemia virus type 1/2, hepatitis C virus (HCV) RNA, and anti-HCV was used as the assay negative control. For each experiment, the assay positive and negative controls were extracted con-currently with test specimens to serve as extraction controls that were included in triplicate on every 96-well PCR plate. The HBV positive control also served as a longitudinal control since the positive control data were used to track assay performance over time.
Clinical specimens.Clinical specimens (listed in Table 3) from HBsAg-seropos-itive, HBV DNA-positive patients from various countries were obtained as ge-notype panels from two commercial sources: Teragenix Corporation (Ft. Lau-derdale, FL) and BBI Diagnostics (West Bridgewater, MA). The Teragenix HBV worldwide genotype panel (HBVGTP-002A) comprised 50 specimens with ge-notypes A to G, and the BBI Diagnostics HBV genotype performance panel PHD201(E) included 9 genotype A-to-F clinical samples. These 59 clinical spec-imens were used to investigate genotype inclusivity of the novel HBV real-time PCR assay. In addition, the clinical specimen quantitative results from our real-time PCR assay were compared to the Bayer Diagnostics VERSANT HBV DNA 3.0 (bDNA) assay results provided by the genotype panel manufacturers. Two high-titer clinical HBV DNA specimens from HBsAg-seropositive pa-tients, one genotype A and one genotype B specimen, were also used to measure assay characteristics such as sensitivity, linearity, and precision. The high-titer HBV genotype A specimen had 4.77⫻108copies/ml (9.10⫻107IU/ml), and the genotype B specimen had 1.59⫻109
copies/ml (3.02⫻108
IU/ml), based upon results of the Roche Molecular Diagnostics COBAS AMPLICOR HBV MONITOR test, v2.0 (supplied by the manufacturer, BBI Diagnostics).
Specimens from blood donors (n⫽100) who tested negative for HBsAg by enzyme-linked immunosorbent assay (ELISA) were obtained from the National Heart, Lung, and Blood Institute Retrovirus Epidemiology Donor Study (REDS) (37) and were tested using the HBV real-time PCR assay to determine clinical specificity. All samples were stored at⫺70°C until processing and testing.
PCR primers and probe design.HBV sequences were selected from the GenBank nucleotide database using the search terms “human hepatitis B virus” and “complete genome.” We obtained 544 HBV genomic sequences, but ex-cluded incomplete sequences, redundant isolates, and those lacking clear geno-type information. This left 340 complete HBV genomic sequences, including genotypes A to H from Europe, North and South America, Asia, and Africa. The sequences were aligned using AlignX (Informax Vector NTI suite of programs, version 9.0.0; Invitrogen, Carlsbad, CA), and a consensus nucleotide sequence was generated by requiring greater than 50% agreement among the sequences. All sequences, including the consensus sequence, were exported in MSF format and converted to a FASTA file using an in-house PERL script that preserved all alignment landmarks such as gaps, insertions, and deletions. For each nucleotide
position of the HBV consensus sequence, the PERL script program calculated the absolute number and percentage agreement with the corresponding nucle-otides of all the aligned sequences. This allowed identification of the most conserved nucleotide positions and regions across all 340 HBV genomes. For divergent positions, the program replaced the corresponding base in the consen-sus sequence with a degenerate or universal base (such as P and K nucleoside phosphoramitides to mimic a C/T and an A/G mix, respectively) as necessary to maximize concordance (15, 16). The program then recalculated both the abso-lute number and percentage of agreement of the individual nucleotide positions among the 340 sequences.
In selecting primer-probe candidates, the variability of the HBV genome and existence of common mutations were taken into account (17). Specifically, HBV variants such as drug-inducedpolmutations, basic core promoter polymor-phisms, pre-S and S gene vaccine escape mutants, mutations resulting in prema-ture stop codons, and regions prone to recombination were all considered. A large number of potential primer-probe combinations were selected from the HBV S gene and core/X gene regions and analyzed for melting temperature (Tm), self-complementarity, and secondary structure using Northwestern Uni-versity’s Online Oligonucleotide Properties Calculator (http://www.basic .northwestern.edu/biotools/oligocalc.html). BLAST (Basic Local Alignment Search Tool) searches (2) were performed on all candidate primer and probe oligonucleotides to assess their potential for amplifying non-HBV sequences. No matches with any human or microbial nucleotide sequences were found for any of the selected oligonucleotides.
A total of 70 different primer-probe combinations were initially tested using a single concentration of plasmid pAM6 as the DNA template. Primer-probe sets that successfully amplified the stock concentration of pAM6 were subsequently tested using a standard curve dilution series of the plasmid. Regression analyses of the data were examined, and those primer-probe sets that met predetermined criteria (slope⬍ ⫺3.8 andy-intercept value⬍a cycle threshold [CT] of 50) were selected for further evaluation. The eight most promising sets were tested using the individual clinical plasma specimens with HBV genotypes A to G from the two commercial genotype panels described above. The single primer-probe pair that performed best was chosen for further development and full validation of the HBV real-time quantitative PCR assay. The selected HBV X gene primer and probe sequences are as follows: forward primer HBV-F3, 5⬘-GGCCATCA GCGCATGC-3⬘, and reverse primer HBV-R3M3, 5⬘-C [5-NitIdl] GCTGCGA GCAAAACA-3⬘; and probe HBV-P3, 5⬘-R-CTCTGCCGATCCATACTGCGG AACTC–Q-3⬘.
The probe is labeled at the 5⬘end with the reporter dye (R) FAM (6-carboxy-fluorescein) and at the 3⬘end with the quencher dye (Q) TAMRA (6-carboxytet-ramethylrhodamine). A 5-nitroindole residue was incorporated in the reverse primer at a heterogeneous position to enable detection of variant HBV strains. The primers and probe were purified by high-pressure liquid chromatography by Operon Technologies (Alameda, CA). These primers amplify an 86-bp fragment of the HBV genome X gene. Agarose gel analysis of the PCR product confirmed that it migrated at the expected size (data not shown).
Real-time PCR.Real-time PCR was performed using an ABI Prism 7900HT or 7700 Sequence Detection System (Applied Biosystems, Foster City, CA) in a 96-well optical plate format. The standard curve, positive and negative controls, and samples were all tested in triplicate replicates. Each 50-l reaction mixture consisted of 40l of PCR mix combined with 10l of standard, control, or specimen DNA. The 10l of specimen DNA was equivalent to 2% of the total DNA present in 1 ml of plasma. The PCR mix contained universal master mix (Applied Biosystems), primers HBV-F3 and HBV-R3M3 (each at 50 nmol/ reaction), probe HBV-P3 (10 nmol/reaction), and 13l of RNase/DNase-free water (Brinkmann/Eppendorf, Westbury, NY). After 2 min at 50°C and 10 min at 95°C, there were 45 cycles (95°C for 15 s and 60°C for 1 min) of PCR amplification for HBV detection. AmpErase and dUTP within the master mix provided carryover contamination control.
Least-squares regression analysis, performed by the ABI Prism 7700 or 7900HT software, plottedCTas a function of nominal input copy number. The measured raw copy number for each reaction was calculated using theCTvalue of each PCR interpolated against the linear regression of the standard curve. For each DNA specimen, the triplicate average raw copy number per well was multiplied either by 50 to convert to copies/ml or 5 to convert to IU/ml.
Specimen processing/DNA extraction.Reportedly, recovery of virion-derived HBV DNA can vary with the method used for DNA extraction because HBV DNA is covalently linked to protein that remains bound to it unless removed by proteinase digestion. The bound protein can interfere with elution of HBV DNA from purification columns (11). To circumvent this problem, we investigated the effect of proteinase K (QIAGEN, Valencia, CA) digestion time on DNA recov-ery from an HBV genotype A clinical specimen (BBI Diagnostics). The specimen
on May 16, 2020 by guest
http://jcm.asm.org/
was incubated for 15, 30, 45, 60, and 90 min, as well as 24 and 48 h, in two separate experiments that included three aliquots of plasma specimen extracted at each time point. All aliquots were tested in triplicate with the HBV real-time PCR assay. Maximum HBV DNA recovery was seen with incubation times of at least 24 h (data not shown). Therefore, we included a 24-h proteinase K digestion in the protocol that was used for all experiments described herein.
HBV DNA was isolated from specimens using the QIAamp MinElute Virus Spin kit (QIAGEN, Valencia, CA) with adaptations to the manufacturer’s pro-tocol. Briefly, 200l of plasma, 30l of proteinase K (QIAGEN), and 200l of buffer AL lysis reagent were incubated overnight at 56°C with mixing. After proteinase K digestion, 6g of carrier RNA, followed by 250l of ethanol (Aaper Alcohol & Chemical, Shelbyville, KY), was added. The rest of the procedure was performed according to the manufacturer’s instructions, except that HBV DNA was eluted in 100l of buffer AVE (provided with the kit).
WHO HBV International Unit Standard. The World Health Organization (WHO) International Standard for HBV Nucleic Acid Amplification Techniques (NAT), product code 97/746 (28), was obtained from the National Institute for Biological Standards and Controls (NIBSC; Hertfordshire, United Kingdom). This control is used as the benchmark reference for comparison of HBV assay
results from a diverse range of nucleic acid detection technologies. The standard was tested according to the NIBSC protocol (version 6). The test results were used to calculate the factor for converting the HBV real-time PCR assay units from copies/ml to IU/ml.
Data analysis.All results were converted to IU/ml prior to analysis, and all statistical analyses were performed using SAS Enterprise Guide software, ver-sion 9.0 (SAS Institute, Cary, NC). The HBV real-time quantitative PCR assay and Bayer VERSANT HBV bDNA assay results for 30 genotype panel speci-mens within the linear range of both assays were correlated using Pearson’s correlation. Probit statistics was performed to determine the limit of detection of our HBV real-time PCR assay. Poisson distribution statistics were used to assess the single-copy dilution level of the plasmid standard curve.
RESULTS
We tested the WHO HBV International Standard to allow
direct comparison of our HBV quantitative assay results with
those obtained by other assay methods. The amount of HBV in
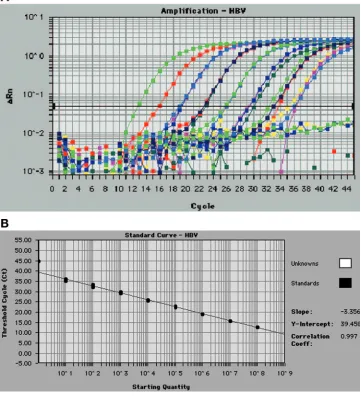
FIG. 1. (A) HBV real-time PCR assay amplification plot obtained from triplicates of 8-log
10serial dilutions of plasmid pAM6 ranging from a
nominal concentration of 5
⫻
10
1to 5
⫻
10
8IU/ml. This figure was generated by the ABI Prism 7700 Sequence Detection Software (SDS) version
1.9.1. (B) HBV real-time PCR plasmid pAM6 standard curve showing linearity over an 8-log
10dynamic range. This standard curve was generated
from the amplification plot displayed in Fig. 1A. The least-squares regression was calculated from plots of measured
C
T(
y
axis) versus input
plasmid DNA over a range of 5
⫻
10
1to 5
⫻
10
8IU/ml (
x
axis) tested in triplicate PCR wells per dilution. The correlation coefficient was 0.997,
and the slope of the line was
⫺
3.36.
on May 16, 2020 by guest
http://jcm.asm.org/
[image:3.585.112.473.78.474.2]each vial of NIBSC lyophilized WHO International Standard
was defined as 1,000,000 IU/ml. Using our novel HBV
real-time PCR assay, this WHO International Standard measured
an average of 1
⫻
10
7copies/ml. This yielded a calculated
conversion ratio of copies/ml to IU/ml of 10:1, indicating that
10 HBV copies/ml measured by our real-time PCR assay is
equivalent to 1 IU/ml. Data are presented as IU/ml followed by
conversion to log
10values for statistical analyses.
The linear dynamic range of the HBV real-time PCR assay
was initially assessed using an 8-log
10dilution series of plasmid
pAM6 DNA. The assay was shown to be linear over the entire
range of 5
⫻
10
1to 5
⫻
10
8IU/ml. A typical standard curve
amplification plot and linear regression analysis of these data
are shown in Fig. 1A and B. The regression analysis yielded a
correlation coefficient of 0.997 and a
y
-intercept value of 39.5.
The slope of
⫺
3.36 closely approximates the theoretical
max-imum amplification efficiency of 100% (
⫺
3.32 slope).
To evaluate assay reproducibility, three independent
exper-iments were performed, in which each of the standard curve
dilution levels was tested in triplicate reactions and each plate
contained quadruplicate plasmid pAM6 standard curves. The
standard curve inter- and intra-assay precision, calculated from
a total of 36 replicates, ranged from 0.5% at 5.0
⫻
10
6IU/ml
to a maximum of 21% at the level of 5.0
⫻
10
1IU/ml (data not
shown).
Sensitivity of the assay was assessed by comparing the
ob-served and expected frequencies of single-copy detection using
the plasmid pAM6 dilution series. The observed single-copy
frequency of plasmid pAM6 was 28% (10 wells out of 36 wells
were positive), in good agreement with the expected
single-copy detection probability of 37% calculated by Poisson
dis-tribution (data not shown).
The clinical sensitivity of the quantitative real-time PCR
assay was determined using a low-titer dilution series of an
HBV genotype B specimen. HBV DNA was diluted to
con-centrations of 150, 125, 100, 75, 40, and 30 IU/ml,
correspond-ing to 30, 25, 20, 15, 8, and 6 copies per reaction, respectively
(Table 1). Twelve independent experiments were run, with
each dilution tested in triplicate, yielding a total of 36 replicate
results for each DNA concentration level. The 95% clinical
detection limit of the assay, calculated by Probit statistics, was
11 copies per reaction, which corresponds to 56 IU/ml.
The clinical linear range of the assay was determined by
diluting and testing high-titer HBV genotype A (9.10
⫻
10
7IU/ml) and genotype B (3.02
⫻
10
8IU/ml) plasma specimens.
Eight independent experiments were performed for each
ge-notype; each HBV DNA concentration level was tested in
triplicate, resulting in a total of 24 replicate measurements per
dilution. The results for the genotype A specimen are shown in
Fig. 2. The clinical linear dynamic range was at least 7 log
10(2.88
⫻
10
0to 2.69
⫻
10
7IU/ml), since the results were linear
over the entire range of dilutions tested.
The clinical HBV genotype A specimen dilution series was
also used to assess the clinical intra- and interassay precision of
the real-time PCR assay. The statistical analysis results for
each concentration level are shown in Table 2. As expected,
the percent CV increased as the HBV DNA level in the sample
decreased with each dilution. Since the assay’s 95% detection
limit is 56 IU/ml (1.75 log
10), the percent coefficient of
varia-tion (%CV) increases greatly in the two diluvaria-tions beyond this
limit. The %CV for clinical specimens is greater than that for
purified plasmid DNA since the patient specimens require the
additional step of DNA extraction.
Clinical specificity was determined using 100 blood donor
samples from the REDS study. All of these blood donor
sam-FIG. 2. Clinical linear dynamic range of the HBV real-time PCR assay. These data were obtained using a 7-log
10dilution series of a high-titer
[image:4.585.43.284.90.182.2]HBV genotype A plasma specimen in eight independent experiments. Each dilution was tested in triplicate, resulting in a total of 24 replicate
measurements. The assay is linear over a range of 2.88
⫻
10
0to at least 2.69
⫻
10
7IU/ml.
TABLE 1. Probit analysis used to determine the 95% detection limit
of the HBV real-time PCR assay using a genotype B specimen
a Measured HBVDNA concn (IU/ml)
Measured amt of HBV DNA (copies/PCR well)
No. (%) of positive wells/total wells
150
30
36/36 (100)
125
25
36/36 (100)
100
20
36/36 (100)
75
15
36/36 (100)
56
11
(95)
40
8
32/36 (89)
30
6
30/36 (83)
aThe assay clinical sensitivity was calculated using 36 replicate measurements at each dilution obtained from 12 independent experiments. The data used for the analysis are shown in regular typeface, and the calculated 95% detection limit of 56 IU/ml (equivalent to 11 copies per PCR well) is shown in boldface.
on May 16, 2020 by guest
http://jcm.asm.org/
[image:4.585.135.447.543.693.2]ples were negative for HBV DNA by our real-time PCR assay,
resulting in a clinical specificity of 100%.
Genotype inclusivity was evaluated using a total of 59 clinical
plasma specimens, including genotypes A to G. The novel
real-time PCR assay successfully detected HBV DNA in 58 of
these specimens, demonstrating an ability to detect all of these
HBV genotypes (Table 3). Since the primer-probe set we
se-lected has 100% homology to the genotype H sequence in the
databank, it is likely to detect this genotype as well.
The 59 genotyped HBV clinical specimens were also used to
compare results from our real-time PCR assay to those
ob-tained with a commercial assay, the Bayer Diagnostics
VERSANT HBV 3.0 (bDNA) assay. Of the 59 specimens, 21
members were below the limit of detection (
⬍
357 IU/ml) and
7 members were above the cutoff (
⬎
17,857,140 IU/ml) of the
Bayer VERSANT HBV bDNA assay. Twenty of the 21
spec-imens that were undetectable with the Bayer VERSANT HBV
bDNA assay tested positive with our novel real-time PCR
assay, with values ranging from 1.91 to 525 IU/ml (0.28 to 2.72
log
10IU/ml) HBV DNA (Table 3). Values below the lower
quantitative limit of 56 IU/ml are usually defined as qualitative
positives and are not assigned a numerical value. However, to
allow comparison with bDNA results, we assigned values
(Ta-ble 3).
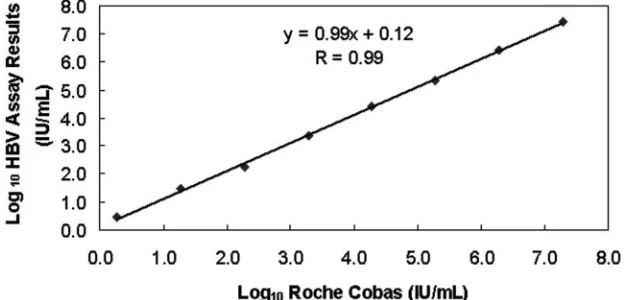
We had both Bayer VERSANT bDNA and real-time PCR
assay results for 30 plasma specimens with genotypes A to G
within the shared linear range of both assays (Table 3). We
compared the results for these 30 samples from both assays
and calculated a correlation coefficient of 0.88. After removal
of a single genotype C outlier (Table 3), the correlation
coef-ficient increased to 0.93 (see Fig. 3 for a graphical
represen-tation).
Each experiment was assessed for quality control (QC)
based upon the following QC data: standard curve
perfor-mance, positive/negative control perforperfor-mance, and acceptable
replicate PCR coefficient of variation (%CV). If the standard
curve regression
R
2value was
⬍
0.985, the slope value was
outside the range of
⫺
3.2 to
⫺
3.7, or the
y
-intercept was
outside the
C
Trange of 37 to 43, the plate failed QC criteria,
the experiment was invalidated, and all data were
nonreport-able. In this case, the assay was repeated in its entirety.
[image:5.585.43.283.81.191.2]As an exogenous DNA extraction control and to monitor
TABLE 2. Precision of the novel HBV real-time PCR assay
a Predicted HBVconcn (log10 IU/ml)
Measured HBV concn (log10IU/ml)
Intra-assay Interassay
SD %CV SD %CV
7.28
7.43
0.014
0.19
0.07
1.0
6.28
6.43
0.014
0.22
0.15
2.3
5.28
5.34
0.019
0.35
0.15
2.9
4.28
4.42
0.032
0.72
0.07
1.5
3.28
3.37
0.039
1.17
0.17
5.1
2.28
2.22
0.077
3.56
0.22
10.1
1.28
1.47
0.196
16.6
0.26
18.0
0.28
0.46
0.369
97.2
0.30
64.1
aA clinical HBV genotype A plasma specimen was serially diluted in Base-matrix (HBV-negative human plasma) and tested in triplicate in eight indepen-dent experiments. The SD and %CV were calculated using data from 24 repli-cates per dilution.
TABLE 3. Detection of HBV genotypes A through G in specimens
from all over the world by the HBV real-time PCR assay
aHBV
genotype Country oforigin
Result (log10IU/ml) by:
Versant HBV bDNA HBV real-time PCR
A United States 2.92 2.33
A Senegal ND 2.23
A Senegal ND 2.51
A Senegal ND 1.86
A Senegal ND 1.81
A Senegal ND 1.57b
A Senegal 3.75 1.81
A United States ND 1.70b
A United States 3.30 2.26
A United States ND 1.40b
A United States 2.80 1.80
A United States 7.25⫹ 5.70
A United States ND 1.78
A* United States 3.99 3.90
A* United States 3.97 3.72
A* United States 3.37 3.12
B United States 3.72 2.74
B United States ND 1.60b
B United States ND 1.76
B* Eastern Asia 3.08 3.44
C United States 4.06 3.29
C United States 7.25⫹ 6.51
C United States 4.59 4.44
C United States 4.50 4.20
C United States ND 1.40b
C United States 7.25⫹ 7.88
C United States ND 1.48b
C outlier United States 5.81 3.44
C* Eastern Asia 3.43 1.99
D United States 6.47 5.81
D United States 7.25⫹ 7.70
D United States ND 2.54
D United States 3.09 2.26
D* Mediterranean 3.82 3.57
D* Middle East 3.17 2.57
E Cote D’Ivoire ND 1.51b
E Cote D’Ivoire 7.25⫹ 7.88
E United States ND 1.11b
E Venezuela ND 2.72
E Cote D’Ivoire 6.57 6.48
E Cote D’Ivoire 2.70 0.75b
E Cote D’Ivoire 7.25⫹ 7.38
E Venezuela ND ND
E Venezuela 3.05 1.40b
E* Africa 3.59 3.54
F Venezuela ND 1.57b
F Venezuela 3.21 2.20
F Venezuela 3.24 2.20
F Venezuela ND 2.05
F Venezuela 2.56 1.70b
F Venezuela 3.12 2.02
F Venezuela 2.74 1.98
F Venezuela 3.45 1.83
F Venezuela ND 0.28b
F Venezuela ND 1.81
F Venezuela 3.40 1.40b
F Venezuela 7.25⫹ 5.83
F* South America 3.76 1.97
G United States 6.06 6.48
aThe clinical plasma specimens were from two commercially available worldwide genotype panels. Asterisks indicate specimens that were purchased from Boston Biomedica; all other samples were from Teragenix. The Bayer Diagnostics VER SANT HBV DNA 3.0 (bDNA) assay quantitative results provided by the manufac-turers were converted to log10IU/ml for comparison. Samples in boldface type were within the linear range of both the real-time PCR and Bayer bDNA assays. The data in italics are for an outlier that was omitted from the graph in Fig. 3. ND, not detected.⫹, value was greater than the bDNA assay upper limit of detection.
bQualitative positive.
on May 16, 2020 by guest
http://jcm.asm.org/
[image:5.585.305.536.101.640.2]interassay precision to detect longitudinal assay drift, a positive
control specimen was processed concurrently with the
experi-mental specimens and tested in triplicate on every PCR plate.
The longitudinal HBV control data from 78 independent
ex-periments are shown as a bar graph in Fig. 4. The positive
control running average was 2.78 log
10IU/ml, the standard
deviation (SD) was 0.15, and %CV was 5.4%. The plate failed
QC if the measured IU/ml of this HBV positive control was
more than 2 SD greater or less than the HBV positive control
running average. Three positive control results out of 78
(3.8%) exceeded these limits, invalidating those three plates.
Furthermore, an individual specimen failed QC criteria and
was retested if the %CV of the PCR replicates for that sample
exceeded 30% (for HBV DNA concentrations
⬎
500 IU/ml).
Positive DNA measurements below the lower quantitative
limit (56 IU/ml) of the real-time PCR assay were defined as
qualitative positives and were not assigned a numerical value.
DISCUSSION
In this study, we described the development and validation
of a novel, highly accurate quantitative real-time PCR assay
that allows equal detection and quantification of HBV DNA
(genotypes A to G) in human plasma specimens. This assay has
good clinical sensitivity at 56 IU/ml using an initial sample
volume of only 200
l, at least an 8-log
10linear dynamic range
without the need for specimen dilution, as well as good clinical
reproducibility. Quantitative HBV DNA measurements for
specimens with genotypes A to G obtained using this novel
real-time PCR assay showed excellent correlation with Bayer
VERSANT HBV DNA 3.0 (bDNA) assay results (
r
⫽
0.93).
[image:6.585.136.450.70.287.2]Commercially available assays for detection and
quantifica-tion of HBV DNA in human serum or plasma include the
Bayer VERSANT HBV DNA 3.0 (bDNA) assay; the Digene
hepatitis B virus (HBV) DNA assay, the Roche Molecular
FIG. 3. Graph showing correlation of the HBV real-time PCR assay results with the Bayer Diagnostics VERSANT HBV DNA 3.0 (bDNA)
assay results for 29 HBsAg-positive clinical specimens (numerical values are listed in boldface in Table 3). The HBV genotype of each specimen
is adjacent to the data point on the graph. There was excellent correlation (
r
⫽
0.93) between the two assays for all HBV genotypes (A to G).
FIG. 4. Bar graph showing QC tracking of HBV real-time PCR positive control results over time. The BBI ACCURUN positive control was
extracted and tested (in triplicate) concurrently with samples in 78 independent experiments over the course of 1 year. Each vertical bar represents
the average positive control result for a single experiment. The overall average is shown as a horizontal black line. The positive control QC upper
and lower limits, shown as horizontal red lines, were calculated as 2 SD above and below the average, respectively. Only 3 of the 78 positive control
results (3.8%) exceeded these limits.
on May 16, 2020 by guest
http://jcm.asm.org/
[image:6.585.136.451.555.677.2]Diagnostics COBAS AMPLICOR HBV MONITOR test, v2.0;
and the COBAS TaqMan HBV test (32). These assays use
various molecular methods for HBV DNA quantification. The
Bayer assay is based on branched DNA signal amplification,
the Digene assay uses chemiluminescent signal amplification,
the Roche AMPLICOR HBV MONITOR test depends upon
target amplification with biotinylated primers followed by
am-plicon hybridization within a microwell plate containing bound
detection probe, and the Roche COBAS TaqMan utilizes
real-time PCR.
Although these commercial assays are routinely used in
di-agnostic laboratories, some have limitations in sensitivity,
lin-ear range, genotype inclusivity, or sample volume. A
compar-ison of these commercially available assays with our novel
real-time PCR assay is shown in Table 4. For example, the
sensitivity of the Bayer HBV bDNA and Digene HBV DNA
assays might be insufficient for detecting very low HBV DNA
levels typical in patients undergoing antiviral therapy and those
with occult HBV DNA infection. In fact, 21 of 59 samples in
the Teragenix and BBI worldwide genotype panels were below
the detection limit of the Bayer VERSANT HBV DNA 3.0
(bDNA) assay (Table 3), whereas our assay detected HBV
DNA in 58 of the 59 specimens. The limited dynamic range of
the Roche Diagnostics COBAS AMPLICOR HBV
MONI-TOR assay requires dilution of high-titer HBV specimens. In
addition, two of the commercial assays do not detect all
geno-types and some may show genotype bias.
The HBV COBAS TaqMan, recently introduced by Roche
Molecular Diagnostics (32), is a real-time PCR assay reported
to equally amplify HBV genotypes A to G. The linear range of
at least 8 logs and good reproducibility are comparable to
those of the real-time PCR assay described herein. The large
specimen volume used for the Roche COBAS TaqMan (500
l), as compared to 200
l for our real-time PCR assay, results
in greater clinical sensitivity (6 IU/ml compared to 56 IU/ml,
respectively). However, the clinical sensitivity of our assay
could also be easily increased by a similar scale up to a larger
specimen volume (5, 10). In addition, the larger specimen
volume required for the Roche COBAS TaqMan HBV assay may
be problematic for studies with limited samples. The
primer-probe set of the Roche COBAS TaqMan assay targets the
precore/core region, while the real-time PCR assay we
devel-oped targets the HBV X gene.
Although a variety of in-house real-time PCR assays have
been described (1, 6, 14, 18, 26, 31, 32, 36), genotype inclusivity
has only been reported in one recent study (9). Compared to
this previous study, our primer-probe set design was based on
a much larger number (
n
⫽
340) of complete HBV DNA
sequences. We used more than twice as many sequences and
designed primer-probe sets within the HBV S and X genes.
The sequences we used included HBV genotypes A to H
ob-tained from North, Central, and South America; Europe; Asia;
Africa; and Australia. In addition, we developed a unique
algorithm and software program for primer-probe set design
that enabled us to incorporate degenerate bases to increase
detection of genotypic variants. We felt this was necessary due
to the great variability seen in HBV genomic sequences.
Fur-thermore, performance of primer-probe sets was tested on a
large number (
n
⫽
59) of genotyped clinical specimens rather
than linearized plasmid DNA containing cloned inserts of
HBV genotypes A to G, as described by Weiss and coworkers
(32).
A recent nationwide epidemiological study of HBV
geno-types in the United States revealed that genogeno-types A to G are
present in the United States. The prevalence of genotypes
differed by region and was strongly associated with place of
birth and ethnicity of the study participants (7). These results
indicate that immigration from areas of HBV endemicity can
alter country or region-specific HBV epidemiology. As a
con-sequence, genotype-inclusive assays for HBV DNA
quantifi-cation are not only relevant in epidemiological studies
involv-ing specimens from all over the world, but also in routine
diagnostic laboratories, particularly in countries where
immi-gration is common.
Quantitative HBV DNA measurements can vary widely with
the quantification method used and among different
laborato-ries performing the testing. To enable comparison of results
from our novel assay to those obtained with other assays, we
determined the conversion factor from HBV copies per
milli-liter to international units per ml by testing the World Health
Organization International Standard for HBV (28). We
com-pared our novel real-time PCR assay with the Bayer VERSANT
HBV DNA 3.0 (bDNA) assay and found excellent
correla-tion for results within the linear range of both assays (
r
⫽
0.93; Fig. 3).
[image:7.585.44.542.82.189.2]Interestingly, the apparent homogeneous distribution of
HBV genotypes with respect to the regression line (see Fig. 3)
suggests there is no bias in detection of one genotype over
another by either our real-time PCR assay or the Bayer
VER-SANT HBV DNA 3.0 (bDNA) assay. This is despite the fact
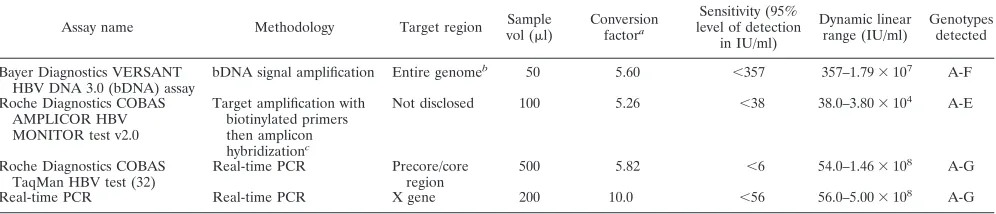
TABLE 4. Comparison of commercially available assays with the novel HBV real-time PCR assay described in this study
Assay name Methodology Target region Sample
vol (l)
Conversion factora
Sensitivity (95% level of detection
in IU/ml)
Dynamic linear range (IU/ml)
Genotypes detected
Bayer Diagnostics VERSANT HBV DNA 3.0 (bDNA) assay
bDNA signal amplification Entire genomeb 50 5.60 ⬍357 357–1.79⫻107 A-F
Roche Diagnostics COBAS AMPLICOR HBV MONITOR test v2.0
Target amplification with biotinylated primers then amplicon hybridizationc
Not disclosed 100 5.26 ⬍38 38.0–3.80⫻104 A-E
Roche Diagnostics COBAS TaqMan HBV test (32)
Real-time PCR Precore/core region
500 5.82 ⬍6 54.0–1.46⫻108 A-G
Real-time PCR Real-time PCR X gene 200 10.0 ⬍56 56.0–5.00⫻108
A-G
aDivide by this factor to convert from copies/ml to IU/ml. bTargets conserved sequences throughout the entire genome. cRequires use of the COBAS AMPLICOR Analyzer instrument.
on May 16, 2020 by guest
http://jcm.asm.org/
that our real-time PCR assay targets only an 86-bp sequence
within the X gene while the bDNA targets conserved
se-quences across the entire HBV genome. Note that the
regres-sion line is skewed to the right in Fig. 3, reflecting the
differ-ence in sensitivities between the two assays.
In summary, the real-time quantitative PCR assay described
in this study uses an X gene primer-probe set to provide
ac-curate detection and quantification of HBV DNA from all
genotypes over a wide dynamic range of levels. Specific
advan-tages of this assay include the following: (i) good clinical
sen-sitivity (56 IU/ml); (ii) excellent clinical specificity (100%); (iii)
broad linear dynamic range (56 to 5.0
⫻
10
8IU/ml); (iv) equal
detection/quantification of HBV genotypes A to G; (v)
excel-lent within- and between-run precision; (vi) excelexcel-lent
correla-tion with the Bayer VERSANT HBV bDNA assay (
r
⫽
0.93);
(vii) low sample volume requirement (200
l); (viii)
signifi-cantly lower cost than commercial assays; and (ix) rigorous
QC, including longitudinal assay tracking.
These characteristics make the novel quantitative real-time
HBV PCR assay described herein particularly well suited for
clinical and epidemiological studies for which good sensitivity
and genotype inclusivity are mandatory, and the low sample
volume and low cost are advantageous.
ACKNOWLEDGMENTS
We thank Thomas O’Brien, Division of Cancer Epidemiology and
Genetics, for providing blood donor specimens and helpful discussion.
We also thank Hormuzd Katki, Biostatistics Branch, Division of
Can-cer Epidemiology and Genetics, National CanCan-cer Institute for
assis-tance with the Probit analysis.
This publication has been funded in whole or in part with Federal
funds from the National Cancer Institute, National Institutes of
Health, under contract NO1-CO-12400. This research was supported
(in part) by the Intramural Research Program of the NIH, National
Cancer Institute, Division of Cancer Epidemiology and Genetics.
The content of this publication does not necessarily reflect the views
or policies of the Department of Health and Human Services, nor does
mention of trade names, commercial products, or organizations imply
any endorsement by the U.S. Government.
This technology as described herein is subject to a pending patent
application.
REFERENCES
1.Abe, A., K. Inoue, T. Tanaka, J. Kato, N. Kajiyama, R. Kawaguchi, S. Tanaka, M. Yoshiba, and M. Kohara.1999. Quantitation of hepatitis B virus genomic DNA by real-time detection PCR. J. Clin. Microbiol.37:2899–2903. 2.Altschul, S. F., W. Gish, W. Miller, E. W. Myers, and D. J. Lipman.1990.
Basic local alignment search tool. J. Mol. Biol.215:403–410.
3.Arauz-Ruiz, P., H. Norder, B. H. Robertson, and L. O. Magnius.2002. Genotype H: a new Amerindian genotype of hepatitis B virus revealed in Central America. J. Gen. Virol.83:2059–2073.
4.Bu¨chen-Osmond, C. (ed.).2003. Hepadnaviridae.InICTVdB—the Univer-sal Virus Database, version 3. ICTVdB Management, Columbia University, New York, N.Y. [Online.] http://www.ncbi.nlm.nih.gov/ICTVdb/ICTVdB /30000000.htm.
5.Burgener, M., U. Candrian, and M. Gilgen.2003. Comparative evaluation of four large-volume RNA extraction kits in the isolation of viral RNA from water samples. J. Virol. Methods108:165–170.
6.Chen, R. W., H. Piiparinen, M. Seppanen, P. Koskela, S. Sarna, and M. Lappalainen.2001. Real-time PCR for detection and quantitation of hepa-titis B virus DNA. J. Med. Virol.65:250–256.
7.Chu, C. J., E. B. Keeffe, S. H. Han, R. P. Perrillo, A. D. Min, C. Soldevila-Pico, W. Carey, R. S. Brown, Jr., V. A. Luketic, N. Terrault, and A. S. Lok.
2003. Hepatitis B virus genotypes in the United States: results of a nation-wide study. Gastroenterology125:444–451.
8.Gardner, S. N., T. A. Kuczmarski, E. A. Vitalis, and T. R. Slezak.2003. Limitations of TaqMan PCR for detecting divergent viral pathogens illus-trated by hepatitis A, B, C, and E viruses and human immunodeficiency virus. J. Clin. Microbiol.41:2417–2427.
9.Garson, J. A., P. R. Grant, U. Ayliffe, R. B. Ferns, and R. S. Tedder.2005.
Real-time PCR quantitation of hepatitis B virus DNA using automated sample preparation and murine cytomegalovirus internal control. J. Virol. Methods126:207–213.
10.Gobbers, E., T. A. M. Oosterlaken, M. J. A. W. M. van Bussel, R. Melsert, A. C. M. Kroes, and E. C. J. Claas.2001. Efficient extraction of virus DNA by NucliSens Extractor allows sensitive detection of hepatitis B virus by PCR. J. Clin. Microbiol.39:4339–4343.
11.Heermann, K.-H., W. H. Gerlich, M. Chudy, S. Schaefer, R. Thomssen, and the Eurohep Pathobiology Group.1999. Quantitative detection of hepatitis B virus DNA in two international reference plasma preparations. J. Clin. Mi-crobiol.37:68–73.
12.Heid, C. A., J. Stevens, K. J. Livak, and P. M. Williams.1996. Real time quantitative PCR. Genome Res.6:986–994.
13.Kato, H., R. G. Gish, N. Bzowej, M. Newsom, F. Sugauchi, Y. Tanaka, T. Kato, E. Orito, S. Usuda, R. Ueda, Y. Miyakawa, and M. Mizokami.2004. Eight genotypes (A-H) of hepatitis B virus infecting patients from San Francisco and their demographic, clinical, and virological characteristics. J. Med. Virol.73:516–521.
14.Kohmoto, M., M. Enomoto, Y. Yano, S. Otani, S. Minamitani, A. Tamori, D. Habu, T. Takeda, S. Shiomi, S. Seki, T. Arakawa, and S. Nishiguchi.2003. Detection of serum hepatitis B virus DNA by real-time quantitative poly-merase chain reaction (TaqMan PCR) during lamivudine treatment: com-parison with three other assays. Hepatol. Res.26:125–133.
15.Lin, P. K., and D. M. Brown.1989. Synthesis and duplex stability of oligo-nucleotides containing cytosine-thymine analogues. Nucleic Acids Res.17:
10373–10383.
16.Loakes, D., and D. M. Brown.1994. 5-Nitroindole as an universal base analogue. Nucleic Acids Res.22:4039–4043.
17.Locarnini, S., J. McMillan, and A. Bartholomeusz.2003. The hepatitis B virus and common mutants. Semin. Liver Dis.23:5–20.
18.Loeb, K. R., K. R. Jerome, J. Goddard, M. Huang, A. Cent, and L. Corey.
2000. High-throughput quantitative analysis of hepatitis B virus DNA in serum using the TaqMan fluorogenic detection system. Hepatology32:626– 629.
19.Lopez, V. A., E. J. Bourne, M. W. Lutz, and L. D. Condreay.2002. Assess-ment of the COBAS Amplicor HBV Monitor test for quantitation of serum hepatitis B virus DNA levels. J. Clin. Microbiol.40:1972–1976.
20.Marin, I. J., M. Poljak, K. Seme, V. Brinovec, M. Maticic, J. Meglic-Volkar, G. Lesnicar, and P. Gradisek.2002. Comparative evaluation of three com-mercial assays for quantitative measurement of hepatitis B virus DNA in serum samples. Hepato-Gastroenterology49:1390–1394.
21.Marin, I. J., M. Poljak, K. Seme, J. Meglicˇ-Volkar, M. Maticˇicˇ, G. Lesˇnicˇar, and V. Brinovec.2001. Comparative evaluation of semiautomated COBAS AMPLICOR hepatitis B virus (HBV) MONITOR Test and manual micro-well plate-based AMPLICOR HBV MONITOR Test. J. Clin. Microbiol.
39:758–761.
22.Moriarty, A. M., B. H. Hoyer, J. W. Shih, J. L. Gerin, and D. H. Hamer.1981. Expression of the hepatitis B virus surface antigen gene in cell culture by using a simian virus 40 vector. Proc. Natl. Acad. Sci. USA78:2606–2610. 23.Norder, H., B. Hammas, S. D. Lee, K. Bile, A. M. Courouce, I. K. Mushahwar,
and L. O. Magnius.1993. Genetic relatedness of hepatitis B viral strains of diverse geographical origin and natural variations in the primary structure of the surface antigen. J. Gen. Virol.74:1341–1348.
24.Norder, H., B. Hammas, S. Lofdahl, A. M. Courouce, and L. O. Magnius.
1992. Comparison of the amino acid sequences of nine different serotypes of hepatitis B surface antigen and genomic classification of the corresponding hepatitis B virus strains. J. Gen. Virol.73:1201–1208.
25.Ohnuma, H., A. Yoshikawa, H. Mizoguchi, and H. Okamoto.2005. Charac-terization of genotype H hepatitis B virus strain identified for the first time from a Japanese blood donor by nucleic acid amplification test. J. Gen. Virol.
86:595–599.
26.Pas, S. D., and H. G. Niesters.2002. Detection of HBV DNA using real time analysis. J. Clin. Virol.25:93–94.
27.Pawlotsky, J. M. (ed.).2002. Hepatitis B virus (HBV) DNA assays (methods and practical use) and viral kinetics. [Online.] http://www.hbvadvocate.org/news /NewsUpdates_pdf/2.2_Conference_Reports/EASL_2002_Agenda/Section1 /pawlotsky.pdf.
28.Saldanha, J., W. Gerlich, N. Lelie, P. Dawson, K. Heermann, and A. Heath.
2001. An international collaborative study to establish a World Health Or-ganization international standard for hepatitis B virus DNA nucleic acid amplification techniques. Vox Sang.80:63–71.
29.Stuyver, L., S. De Gendt, C. Van Geyt, F. Zoulim, M. Fried, R. F. Schinazi, and R. Rossau.2000. A new genotype of hepatitis B virus: complete genome and phylogenetic relatedness. J. Gen. Virol.81:67–74.
30.Torbenson, M., and D. L. Thomas.2002. Occult hepatitis B. Lancet Infect. Dis.2:479–486.
31.Weinberger, K. M., E. Wiedenmann, S. Bohm, and W. Jilg.2000. Sensitive and accurate quantitation of hepatitis B virus DNA using a kinetic fluores-cence detection system (TaqMan PCR). J. Virol. Methods85:75–82. 32.Weiss, J., H. Wu, B. Farrenkopf, T. Schultz, G. Song, S. Shah, and J. Siegel.
2004. Real time TaqMan PCR detection and quantitation of HBV genotypes
on May 16, 2020 by guest
http://jcm.asm.org/
A-G with the use of an internal quantitation standard. J. Clin. Virol.30:86–93. 33.Whalley, S. A., J. M. Murray, D. Brown, G. J. Webster, V. C. Emery, G. M. Dusheiko, and A. S. Perelson.2001. Kinetics of acute hepatitis B virus infection in humans. J. Exp. Med.193:847–854.
34.World Health Organization, Department of Communicable Diseases and Surveillance and Response.2002. Hepatitis B. [Online.] http://www.who.int /csr/disease/hepatitis/HepatitisB_whocdscsrlyo2002_2.pdf.
35.Yao, J. D. C., M. G. H. M. Beld, L. L. E. Oon, C. H. Sherlock, J. Germer, S. Menting, S. Y. Se Thoe, L. Merrick, R. Ziermann, J. Surtihadi, and H. J.
Hnatyszyn.2004. Multicenter evaluation of the VERSANT hepatitis B virus DNA 3.0 Assay. J. Clin. Microbiol.42:800–806.
36.Zanella, I., A. Rossini, D. Domenighini, A. Albertini, and E. Cariani.2002. Quantitative analysis of hepatitis B virus DNA by real-time amplification. Eur. J. Clin. Microbiol. Infect. Dis.21:22–26.
37.Zuck, T. F., R. A. Thomson, G. B. Schreiber, R. O. Gilcher, S. H. Kleinman, E. L. Murphy, H. E. Ownby, A. E. Williams, M. P. Busch, J. W. Smith, et al.
1995. The Retrovirus Epidemiology Donor Study (REDS): rationale and methods. Transfusion35:944–951.