Munich Personal RePEc Archive
Parameter estimation from multinomial
trees to jump diffusions with k means
clustering
Lee, Kiseop and Xu, Mingxin
University of North Carolina at Charlotte
26 April 2007
Online at
https://mpra.ub.uni-muenchen.de/3307/
Parameter Estimation from Multinomial Trees to
Jump Diffusions with K Means Clustering
Kiseop Lee
∗, Mingxin Xu
†April 26, 2007
Abstract
Ever since the pioneering work of Cox, Ross and Rubinstein [8], tree models have been popular among asset pricing methods. On the other hand, statistical estimation of parameters of tree models has not been studied as much. In this paper, we use K Means Clustering method to estimate the parameters of multinomial trees. By the weak convergence property of multinomial trees to continuous-time models, we show that this method can be in turn used to estimate parameters in continuous time models, illustrated by an example of jump-diffusion model.
1
Introduction
Since the seminal work by Black, Scholes and Merton on the geometrical Brownian motion model, various continuous time models were introduced as alternatives of the Black-Shcoles’ model, such as L´evy pure-jump models, stochastic volatility models, and jump-diffusion models. These models were introduced to fix some unrealistic properties of the Black-Scholes’ model, and have been successful in various degrees for the application to derivative pricing and hedging. On the other hand, an important practical problem about the estimation of parameters has not been addressed as extensively. A few exceptions are Ait-Sahalia [1], Ait-Sahalia and Kimmel [2], and
∗Department of Mathematics, University of Louisville, Louisville, KY 40292, USA ([email protected])
Bhar, Chiarella, and To [4]. The existing methods mostly use maximum likelihood estimation and have turned out to be difficult to calculate and implement in jump models: in most cases clever numerical procedures are required in both estimating the likelihood function and finding the maximum.
Close relatives of these continuous time models in discrete time are multinomial trees. It is known that certain multinomial trees converge to continuous time models in distribution. Since the introduction of binomial trees as an approximation of the geometrical Brownian motion by Cox, Ross and Rubinstein [8], it has been popular in term structure modelling and other exotic derivative pricing. In fact, the estimation of the volatility parameter used in the geometrical Brownian motion model (σ) is fairly standard and is used for constructing the binomial tree (u =
eσ√∆t, d=e−σ √
∆t).
In this paper, we apply a simple but powerful statistical method called K Means Clustering to directly estimate the parameters in multinomial tree models. Then, using the weak convergence properties, we suggest that this method can be used to estimate parameters of continuous time models. The advantages of our approach in estimating the parameters in jump models are that it is a statistically well-established method and that it is easy to implement. We can avoid long numerical calculations, and instead use typical statistical softwares such as SAS and SPSS.
The paper is organized as follows. In section 2, we introduce the main problem. Section 3.1 explains the K Means Clustering Method. Section 3.2 explains how to use K Means Clustering to estimate parameters in the multinomial trees. In section 3.3, we find the parameter estimation in jump diffusion models that are the weak limits of the multinomial trees. We provide a couple of numerical examples in section 3.4. Section 4 concludes.
2
The Problem
Let us consider a multinomial tree withm time steps andk nodes at each time step. Formally, Si denotes the price of the stock at time ti, i = 0,1, ..., m. The evolution
of the stock prices process is
Si+1 Si
=ξ, i= 0,1, ..., m−1, (1)
where the multiplying factorξis a random variable that take different constant values with different probabilities as long as there is no arbitrage in the model, i.e.,ξ =ξj
A natural question arising is how to estimate ξj coupled with pj, j = 1,2, ...k.
Since the multinomial tree is just an approximate model of the reality, we understand that statistically speaking, we observe the prices with some errors. In other words, what we really observe can be formulated as
Si+1 Si
=ξ+ǫi, i= 0,1, ..., m−1. (2)
3
Main Result
3.1
K Means Clustering
When we have both input variables and output variables, we can build a model which explains the effects of inputs on outputs. Such a case is called supervised learning. On the other hand, if we have only outputs without inputs, then it becomes unsuper-vised learning. K Means Clustering is a popular unsuperunsuper-vised learning algorithm for finding clusters and cluster centers in a set of unlabeled data.1 Suppose we already
know that there are k different clusters, we use the following steps:
• Step 1 : Define k centers, one for each cluster.
• Step 2 : Each point is assigned to the cluster with the smallest distance.
• Step 3 : Once all points are assigned, recalculate the cluster centers.
We repeat Steps 1 to 3 until no more changes are done. In other words centers do not move any more. Detailed explanations of K Means Clustering Method and its implementation are given in standard textbooks such as Hastie et al. [11].
3.2
Application to the Multinomial Tree
Recall that we observe
Si+1 Si
=ξ+ǫi, , i= 0,1, ..., m−1, (3)
whereξ =ξj with probabilitypj, and j = 1,2, ..., k.
1There are other possible clustering methods such as Learning Vector Quantization and Gaussian
We consider the data set composed of nSi+1
Si , i= 0,1,2, ...m−1
o
. Then estimat-ing ξj, j = 1,2, ..., k is equivalent to finding k centers in K Means Clustering. Of
course, a reasonable choice of initial centers is important. After finding the k cen-ters, and assigning xj number of points to the center ξj, we can estimate pj with
sample proportions ˆpj = xj
m.
3.3
Weak Convergence and Parameter Estimation in a
Con-tinuous Time Jump-Diffusion Model
For the simplest case, the convergence of Binomial approximation to the Black-Scholes model is studied by a classical work of Cox, Ross and Rubinstein [8]. There are other possible multinomial approximations derived from the PDE approach as shown in Heston and Zhou [12]. However, parameter estimation is fairly standard in this case and we will apply the K Means Clustering Method to a more interesting case of a simple jump-diffusion process.
A jump-diffusion model can be approximated by multinomial trees in a few differ-ent ways. One natural approach is through the PDE method explained in Chapters 2 and 3 of Prigent [15] and Chapter 3 of Clewlow and Strickland [6]. There exist extensive studies on numerical methods for the implementation of PDEs for option pricing such as the Finite Difference Method. In this section, we will adopt a tri-nomial tree from a direct approximation approach suggested by Nieuwenhuis and Vellekoop [14]. Let Wt be a standard Brownian motion, and Nt a Poisson process
with constant intensityλ. The stock price process follows the stochastic differential equation
dSt=St(µdt+σdWt+αdNt). (4)
Supposeµ∈R, σ >0, α∈R, λ >0, and these are the parameters we are interested in
estimating. On a finite-time interval [0, T], define a stochastic processesXtn = τn
t
Wn t
Nn t
such that
Xtn =00 0
on t∈ 0,n1
; Xtn=
nT
X
k=1
ηnk1[Tn
k,T)(t) on t∈
1
n, T
whereTn k =
k
n, k= 1,2, ..., nT, and
ηkn= 1 n 1 √n 0
with probability 12(1− λ n); 1 n − 1 √n 0
with probability 12(1− λ n); 1 n 0 1
with probability λ n.
(6)
Then,Xtn converges weakly to Wtt
Nt
on [0, T] as n goes to ∞. Let us define
Stn=S0expn(µ−σ2
2 )τ
n t +σW
n
t + ln(1 +α)N n t
o
=S0exp (
µ−σ
2
2
σ
ln(1+α)
′
Xtn
)
.
Then Stn also converges weakly toSt as n goes to ∞. Therefore, the three branches
of the corresponding trinomial tree should be
• expn(µ−σ22)1n+ σ √n
o
with probability 12(1− λ n),
• expn(µ−σ22)1n− σ √n
o
with probability 12(1− λ n),
• expn(µ−σ22)1
n+ ln(1 +α)
o
with probability λ n
By the K Means Clustering Method introduced in Sections 3.1 and 3.2, we can estimateu, m, das the centersξ1, ξ2, ξ3, along with probabilitiesp1, p2, p3 forpu, pm, pd
from the data set nSi+1
Si , i= 0,1,2, ...nT −1
o
. After ordering ξ1, ξ2, ξ3 from high to
low, we assign them to u, m, d. From these six statisticsξ1, ξ2, ξ3, pu, pm, pd, we need
to back out the parameters for the continuous time model µ, σ, α, λ.
For this purpose, we need to decide which two branches correspond to the Brown-ian motion and which branch corresponds to the jump amongu, m, d. It is important to notice that the probabilities associated to the Brownian movements is symmetric with 1
2(1−
λ
n). Therefore, in the numerical example we show below, we will choose
then we assign
u= expn(µ−σ22)1
n+ ln(1 +α)
o
, pu = λn; (7)
m= expn(µ−σ22)1n+ σ √n
o
, pm = 12(1− λn); (8)
d= expn(µ−σ22)1n− σ √n
o
, pd = 12(1− λn). (9)
From the three equations involving u, m, d in (7)-(9), we can solve for µ, σ, α:
µ= n
2 ln(md) +
n
8
lnm
d
2
, (10)
σ =
√
n
2 ln
m
d, (11)
α= √u
md −1. (12)
The estimation of λ is not so straightforward and we will apply the Maximum Likelihood Method. LetXu, Xm, Xd be numbers of ups, middles, and downs
respec-tively. Then (Xu, Xm, Xd) follows the trinomial distribution with density function
P(Xu =xu, Xm =xm, Xd=xd) = xunTxmxd
λ
n
xu 1 2(1−
λ n)
xm 1 2(1−
λ n)
xd ,
where xu +xm +xd = nT. We obtain the maximum likelihood estimator of λ by
finding maximum of the likelihood functionL(λ) =P(Xu =xu, Xm =xm, Xd =xd):
ˆ
λ= xu
T .
Note thatpu = nTxu and this is exactly
ˆ
λ =npu =n(1−pm−pd),
by checking the three equations involving λ from (7)-(9).
To achieve higher precision, we can allow different jump sizes where the stock price process is driven by a compound Poisson process and can be represented as
dSt=St(µdt+σdWt+ k
X
i=1
αidNi,t), (13)
where each Ni,t is a standard Poisson process with constant intensity λi for i =
1, ..., k. The total intensity of the compound Poisson process is λ = Pk
corresponding multinomial tree will have k+ 2 branches in each time step, and we
can still define Xtn= τn t Wn t Nn 1,t ... Nn k,t
with (5), and the expanded
ηjn= 1 n 1 √n 0 ... 0
with probability 12(1− λn),
1 n − 1 √n 0 ... 0
with probability 12(1− λn),
1 n 0 ... 1 ... 0
with probability qinλ, i= 1,2, ..., k,
(14)
where 1 is placed at (i+ 2)th component, and qi = λλi. Then the resulting discrete
process
Stn=S0exp
(
(µ−σ22)τtn+σWtn+
k
X
i=1
log(1 +αi)Ni,tn
)
converges weakly to the continuous version (13), and the corresponding branches in the k+ 2-multinomial tree are
• expn(µ−σ22)1
n+ σ √ n
o
with probability 1 2(1−
λ n),
• expn(µ−σ22)1n− σ √n
o
with probability 12(1− λ n),
• expn(µ−σ22)1n+ ln(1 +αi)
o
with probability qiλ
n , i= 1,2, ..., m.
There arek+ 2 equations that relate the k+ 2 estimated centers ξi in the K Means
Clustering Method to solve for the k + 2 parameters µ, σ, α1, ..., αk. There are
ad-ditional k+ 2 equations that relate estimated probabilities p1, .., pk+2 associated to
the centers ξi bypi = nTxi to estimate the k intensitiesλi throughqi. Since the
prob-abilities pi sum up to 1, we have one more degree of freedom than the number of
variables we would like to solve. As in the trinomial model, the maximum likelihood estimators of the intensities are
ˆ
λi =
xi
T,
node frequency (xi) estimated probability (pi) estimated center (ξi)
up 35 0.2846 1.0116
middle 79 0.6423 0.9986
[image:9.612.108.505.94.156.2]down 9 0.0731 0.9825
Table 1: Trinomial approximation of IBM daily closing prices.
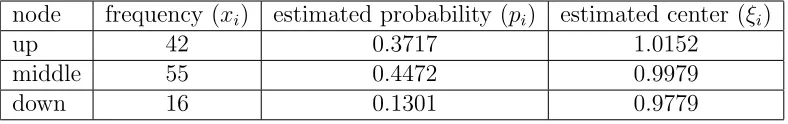
node frequency (xi) estimated probability (pi) estimated center (ξi)
up 42 0.3717 1.0152
middle 55 0.4472 0.9979
down 16 0.1301 0.9779
Table 2: Trinomial approximation of S&P 500 index weekly closing prices.
3.4
Examples
3.4.1 Trinomial Approximation of the IBM Daily Stock Price
In this subsection, we illustrate the K Means Clustering approximation method by using the daily closing prices of the IBM stock from Oct 2, 2006 to March 31, 2007. There were 124 trading days, so we observed 123 data points for St+1
St . We use
trinomial tree as our approximation model. Table 1 shows the results for K Means Clustering with three centers.
The corresponding parameters for the trinomial trees is u = 1.0116 with proba-bility pu = 0.2846, m = 0.9986 with probability pm = 0.6423 and d = 0.9825 with
probability pd = 0.0731. Percentage-wise, the IBM stock moves up by 1.16% daily,
moves down by 0.14% or 1.75%.
3.4.2 Jump Diffusion Approximation of the S&P 500 Index
Next, we approximate the S&P500 index weekly closing data with jump-diffusion model (4) and estimate its parameters through a trinomial tree parameter estimation from K Means Clustering Method. We collected data form the first week of January 2005 to the last week of March 2007. There are 114 weeks in total, which gives 113 data points for St+1
St . The time unit is a year, so n = 52. Table 2 shows the result
[image:9.612.110.504.201.263.2]for the jump diffusion model is thus estimated as
σ =
√
n
2 ln
u
m = 0.0620,
µ= n
2 ln(um) +
n
8
ln u
m
2
= 0.3395,
α= √d
um −1 = −0.0284,
λ= xd
T = 7.3628. (15)
This implies a 2.84% downward jump of S&P with a frequency of about 7.36 times per year, while the volatility coming from the Brownian motion is 6.2%.
4
Conclusion
We have studied how to estimate parameters in multinomial tree models using the K Means Clustering Method. This is a simple, but powerful statistical method which can be easily done by standard software such as SAS and SPSS. This method was then applied to parameter estimation in continuous time jump-diffusion models as explained in Section 3.3 and an example in Section 3.4.2. However, this methodology can be applied more widely to other continuous time models that are weak limits of multinomial trees. For stochastic volatility models the reader can consult Ait-Sahalia and Kimmel [2] and Florescu and Viens [10] about their approximation by multinomial models.
References
[1] Ait-Sahalia, Y.: Maximum likelihood estimation of discretely sampled diffu-sions: A closed-form approximation approach, Econometrica,70, 223-262 (2002)
[2] Ait-Sahalia, Y., Kimmel, R.: Maximum likelihood estimation of stochastic volatility models, Journal of Financial Economics,83, 413-452 (2007)
[3] Albanese, C., Kuznetsov, A.: Discretization schemes for subordinated processes, working paper (2007)
[5] Chang, L. B., Palmer, K.: Smooth convergence in the binomial model, Finance and Stochastics 11, 91–105 (2007)
[6] Clewlow, L., Strickland, C.: Implementing Derivatives Models, Wiley Financial Engineering, (1999)
[7] Ramezani, C., Zeng, Y.: An Empirical Assessment of Double Exponential Jump-Diffusion Process, Forthcoming in Annals of Finance
[8] Cox, J. C., Ross, S. A., Rubinstein, M.: Option pricing: a simple approach, The Journal of Financial Economics7, 229–263 (1979)
[9] Durham, G., Gallant, R.: Numerical techniques for maximum likelihood esti-mation of continuous-time diffusion processes, preprint
[10] Florescu, I., Viens, F.: Stochastic volatility: option pricing using a multinomial recombining tree, preprint (2006)
[11] Hastie, T., Tibshirani, R., Freidman, J.: The Elements of Statistical Learning, Springer Series in Statistics (2001)
[12] Heston, S., Zhou, G.: On the rate of convergence of discrete-time contingent claims, Mathematical Finance10, 53–75 (2000)
[13] Li, M., pearson, N., Posteshman, A.: Conditional estimation of diffusion pro-cesses, Journal of Financial Economics74, 31-66 (2004)
[14] Nieuwenhuis, J. W., Vellekoop, M. H.: Weak convergence of tree methods, to price options on defaultable assets, Decisions in Economics and Finance 27, 87–107 (2004)