Evaluation of a TaqMan PCR Assay To Detect Rabies Virus RNA:
Influence of Sequence Variation and Application to
Quantification of Viral Loads
G. J. Hughes, J. S. Smith, C. A. Hanlon, and C. E. Rupprecht*
Rabies Section, Centers for Disease Control and Prevention, Atlanta, Georgia 30033
Received 30 June 2003/Returned for modification 25 September 2003/Accepted 17 October 2003
Published assays that use TaqMan PCR are consistently sensitive, rapid, and readily transferable. Here we describe a TaqMan PCR-based method for the detection of rabies virus (RV) RNA in tissue samples. We show that the method has an acceptable linear range, is both sensitive and specific, and, importantly, correlates with the concentration of infectious virus. In addition, the levels of RV-specific amplification are adjustable
according to the levels of an endogenous control (-actin mRNA), allowing the calculation of comparable
quantities. We tested the capacity of this assay to cope with target sequence variations. The number of sequence mismatches between gene-specific oligonucleotides and the target sequence significantly affects amplification
(P< 0.001), and point mutations at the center of the probe can result in false-negative results through the
prevention of probe binding and subsequent fluorescence. This study demonstrates that the genetic heteroge-neity of RVs may prove a serious obstacle in the development of a diagnostic assay based on TaqMan PCR; however, the quantification of RV levels may prove to be a valuable application of this assay.
TaqMan PCR is widely implemented as a detection and quantitation method for viruses isolated from a variety of sam-ple types. Assays have been developed for a number of nega-tive-strand RNA viruses, e.g., respiratory syncytial virus (8), Hendra virus (17) and Rift Valley fever virus (6), and have been found to be sensitive and specific, coupled with the ad-vantages of a test that is rapid, requires no post-PCR manip-ulation, and is amenable to high-throughput testing.
The rabies virus (RV) is the type member of theLyssavirus
genus that includes Lagos bat virus, Mokola virus, Duvenhage virus, European bat lyssavirus 1, European bat lyssavirus 2, and Australian bat lyssavirus. Recently, a new lyssavirus discovered in central Asia has been proposed as a new genotype (2). Isolates of RV in the United States exhibit considerable se-quence heterogeneity in nature (18), making problematic the designing of oligonucleotide primers for RNA detection. RNA virus heterogeneity may affect the performance of TaqMan PCR assays (16), but there are few data available on the tol-erance of TaqMan technology to sequence variation. A Taq-Man PCR assay to differentiate lyssaviruses by genotype has been developed (3), but there has been no formal assessment of the impact of RNA sequence diversity on this assay.
The direct fluorescent antibody test (25) is the current lab-oratory test of choice for detecting RV antigen in tissue sam-ples and has adequate levels of sensitivity and specificity when it is performed correctly (22, 23). The advantages of RNA detection methods are in the transferability of the technology to a wide variety of other sample types that may be unsuitable for the direct fluorescent antibody test, such as saliva and cerebrospinal fluid (5). PCR has been used for the
confirma-tory diagnosis of human rabies when other tests could not be readily applied (4). For experimental studies, PCR-based tech-niques have been utilized for the detection of RV RNA from oral swabs (15). RNA can be buffered adequately at room temperature for considerable periods by using commercially available products such as RNAlater (Ambion) and TRIzol (Life Technologies).
In addition to its application to qualitative detection-based assays, TaqMan technology has been used to quantify viral loads from tissue samples (1). At present, methods for esti-mating the levels of RV in clinical samples are limited to titration in animals or tissue culture. The classic mouse inoc-ulation test (10) can lead to a considerable delay in the esti-mation of an end point, requires facilities for the use of exper-imental animals, and is labor intensive. Cell culture isolation methods (26) are problematical due to the inability of certain RV variants to propagate easily in specific cell lines. The Taq-Man PCR provides a potential means to accurately quantify levels of RV RNA in a wide variety of sample types. Such information is vital for investigating RV pathogenesis.
In this study, we assessed a TaqMan PCR for the detection of RV RNA in clinical samples. We also assessed the kinetics of the TaqMan reaction for application to quantitative virology and analyzed the effects of sequence divergence on the effi-ciency of this reaction.
MATERIALS AND METHODS
Experimental samples.Experimental samples were used to investigate assay dynamics (linearity, sensitivity, and amenability to quantification). Tissue sam-ples were obtained at necropsy from rabid, striped skunks (Mephitis mephitis) experimentally infected with either an RV variant epidemiologically associated with big brown bats (Eptesicus fuscus; herein referred to as AZ-EF) or an RV variant associated historically with skunks in the southwestern United States (herein referred to as AZ-SK). AZ-EF has recently been identified in naturally infected skunks (J. Smith, R. Rohde, B. Mayes, C. Parmely, and M. Leslie, Abstr. 12th Annu. Rabies Am. Conf., abstr., 2001). All animal care and experimental procedures were performed in compliance with the Centers for Disease Control and Prevention (CDC) Institutional Animal Care and Use Guidelines.
* Corresponding author. Mailing address: Rabies Section, Centers for Disease Control and Prevention, 1600 Clifton Rd., Mail Stop G33, Atlanta, GA 30033. Phone: (404) 639-1050. Fax: (404) 639-1564. E-mail: [email protected].
299
on May 15, 2020 by guest
http://jcm.asm.org/
Following homogenization in phosphate-buffered saline, salivary gland (SG) samples were titrated in mice (10), and 250l of homogenate was added directly to TRIzol LS reagent (Invitrogen Life Technologies, Carlsbad, Calif.) for RNA extraction. A 3-mm3sample of frozen brain tissue (BR) was homogenized
di-rectly in 750l of TRIzol reagent according to the manufacturer’s instructions. All samples were stored at⫺80°C prior to processing.
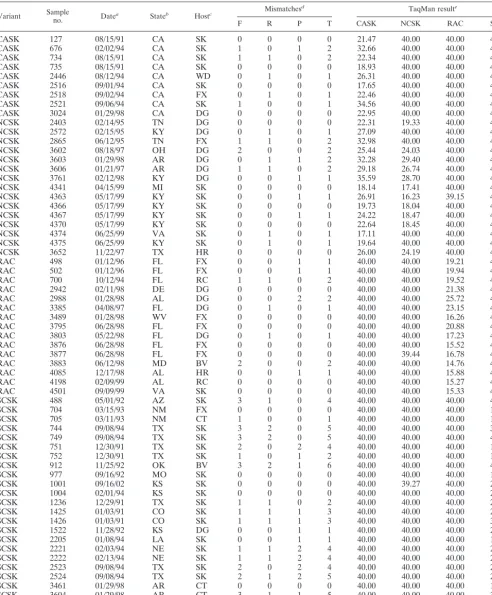
Historical samples.A selection of historical samples was used to test the effects of sequence variation on the kinetics of the TaqMan reaction. Four RV variants associated with the infection of terrestrial mammals (11) were selected for this study: California skunk (CASK), north central skunk (NCSK), raccoon (RAC), and south central skunk (SCSK). A total of 63 isolates, which were previously typed by molecular techniques, were selected from those available at the CDC where sequence data for the nucleoprotein (N) gene were available (Table 1 and Fig. 1). These samples are not representative of all circulating lineages of RV in the United States, but they provide a means to study the effect of sequence diversity on the TaqMan PCR. RNA extracted prior to November 1994 had been extracted by a method described elsewhere (19). After November 1994, RNA was extracted by using TRIzol according to the manufacturer’s instructions.
RNA extraction and cDNA generation.RNA was extracted from experimental samples with TRIzol and TRIzol LS reagents according to the manufacturer’s instructions and with 1l of Glycoblue (Ambion, Austin, Tex.) used as a copre-cipitant. Dried RNA pellets were resuspended in 100l of nuclease-free water (Promega, Madison, Wis.). RNA samples were stored at⫺80°C until used.
Reverse transcription (RT) of all RNA samples (experimental and historical) was undertaken by using a reverse transcription system (Promega) according to the manufacturer’s instructions with 0.5g of the supplied random primers. RT was performed with 1l of RNA from experimental samples (to avoid satura-tion) and 5l of RNA from historical samples.
Design of TaqMan primer and probe sets.All TaqMan primers and probes were designed by the Primer Express computer program (Applied Biosystems, Foster City, Calif.). For the two isolates used for the experimental infection of the skunks, nucleotide sequences from the N gene of each variant (AZ-SK and AZ-EF with GenBank accession numbers AF483524 and AY170413, respec-tively) were inputted into the program, and the optimal primer and probe sequences were obtained by using the default settings of the program.
For historical samples, a consensus sequence was generated for the sets of sequences comprising each RV variant (Fig. 1) from a sequence alignment generated with the BioEdit computer program (7). From this alignment, areas of relative conservation were selected as target regions for placement of the Taq-Man primers and probes. These regions were used as input for Primer Express to generate the optimal primer and probe sequences according to the default settings.
TaqMan primer and probe details are shown in Table 2. All TaqMan probes were labeled at the 5⬘end with a fluorescent reporter dye (6-carboxy-fluorescein) and at the 3⬘ end with a quencher. The AZ-EF and AZ-SK probes were quenched with a minor groove binder-nonfluorescent quencher (Applied Bio-systems), while the CASK, NCSK, RAC and SCSK probes were quenched with Black Hole Quencher (Biosearch Technologies, Novato, Calif.). Primer and probe concentrations were optimized according to the manufacturer’s recom-mendations.
TaqMan PCR.The TaqMan reactions were performed in a 25-l reaction volume comprised of 12.5l of TaqMan master mix (Applied Biosystems), 2.5l of each TaqMan primer (at the concentrations shown in Table 2), 2.5l of probe (at the concentrations shown in Table 2), 4l of nuclease-free water, and 1l of cDNA. All TaqMan PCRs were performed as uniplex reactions with one set of TaqMan primers and probe per well. All reactions were carried out in MicroAmp optical 96-well reaction plates (Applied Biosystems) sealed with MicroAmp optical caps (Applied Biosystems). Plates were transferred to an ABI Prism 7700 sequence detection system (Applied Biosystems), and DNA was amplified ac-cording to the following program: 1 cycle each of 50°C for 2 min and 95°C for 10 min, followed by 40 cycles each of 95°C for 15 s and 60°C for 1 min.
TaqMan runs of experimental samples contained at least four replicates each of a known positive control (from RV-positive BR), an RV-negative control cDNA, and nuclease-free water. Each historical sample was run in triplicate with each of the four variant-specific TaqMan primer and probe sets alongside a positive control cDNA for each variant (from RV-positive BR), negative control cDNA (from BR infected with a big brown bat RV variant), and nuclease-free water (3 wells). Previous testing showed that all four terrestrial TaqMan primer and probe sets did not amplify the big brown bat RV variant used for the control reactions with no amplification. All sample replicates were run on the same plate, thus measuring variability only within the run. In addition, a number of samples were run on separate plates to assess variability between runs.
For each PCR, a threshold cycle number (Ct) was obtained corresponding to
the PCR cycle number during which the fluorescence of the reaction rose above a threshold value statistically determined by the computer software. The Ct
values are inversely proportional to the log10of the amount of template in the
PCR. A difference of 1Ct corresponds to a twofold difference in template
amounts. ACtvalue less than the mean plus two standard deviations of the
negative control wells was considered positive. ACtvalue of 40 corresponds to
no amplification.
Levels of-actin, determined by TaqMan PCR, were used to normalize levels of all samples (both experimental and historic). For amplification of-actin mRNA, the PCR assay was performed with a-actin detection kit (Applied Biosystems) according to the manufacturer’s instructions. The adjustment ac-cording to the levels of-actin was performed by subtracting the highest mean
-actinCtvalue (i.e., the lowest levels of-actin) from the mean-actinCtof
each sample. This difference was subtracted from the meanCtvalue obtained
from the RV-specific TaqMan PCR. This provided a method to account for differences in the levels of viral RNA due to sample heterogeneity. Data were adjusted in sets according to tissue type because the suitability of endogenous controls can be tissue specific (14). Standard curves were not generated for quantification experiments as all total RNA levels were within the linear and equal amplification range of the assay and thus applicable to quantification through normalization with-actin mRNA.
Conventional PCR and sensitivity assay.A conventional, heminested PCR was used to compare the sensitivity of the TaqMan assay and was performed as described elsewhere (15). Briefly, fivefold serial dilutions of a known RV-positive RNA sample were made in nuclease-free water, and RT was carried out by using a reverse transcription system with random primers. The same cDNA sample was used for heminested (10l) and TaqMan (1l/replicate) PCRs. Products of conventional PCRs (15l) were visualized on a 2% agarose gel stained with ethidium bromide (0.5g/ml).
Statistical analysis.Differences in the RNA yields were assessed by means of the Mann-Whitney U test. Associations between variables were determined according to Spearman’s rank correlation coefficient (rs) or by linear regression
analysis. For parametric tests, data were checked for normality by using the Kolmogorov-Smirnov test. All analyses were performed with SPSS version 11.0 (SPSS Inc., Chicago, Ill.).
RESULTS
Linearity of the TaqMan PCR.Total RNA yields from
tis-sue, determined by spectrophotometry, were typically in the range of 5 to 10g although in several cases the concentration was below the level accurately determinable (⬃0.1g/l). For experimental samples for which accurate measurement was possible, there were no significant differences in RNA yields from BR and SG samples (P⫽0.805).
To test for potential saturation of the RT reaction, fourfold serial dilutions of total RNA from SG and BR samples were made in nuclease-free water and used for RT. The RNA quan-tities ranged from 1g to⬃17 pg. The linear ranges of the assay were comparable for RNA from both SG and BR (Fig. 2). Over this range, and for both tissue types, there was no evidence that amplification of -actin mRNA was nonlinear (results not shown). There were no differences in the linear ranges of the assay between TaqMan primer and probe sets or between samples of the same tissue but from different animals (results not shown). For both sample types, a departure from linearity was observed with the addition of between 15 and 63 ng of total RNA. In all cases this increase required the addition of more than 1l of stock RNA. Within the linear range (⬍63 ng for SG; ⬍15 ng for BR), there was a strongly significant inverse correlation between the amount of total RNA and correspondingCt(for both,rs⫽1.000,P⬍0.0001). The am-plification efficiencies of the RV-specific target sequence and
-actin mRNA were assessed by subtracting the -actin Ct from the RV Ct over this dilution series and assessing the
300 HUGHES ET AL. J. CLIN. MICROBIOL.
on May 15, 2020 by guest
http://jcm.asm.org/
Variant Sampleno. Datea Stateb Hostc Mismatches
d TaqMan resulte
F R P T CASK NCSK RAC SCSK
CASK 127 08/15/91 CA SK 0 0 0 0 21.47 40.00 40.00 40.00
CASK 676 02/02/94 CA SK 1 0 1 2 32.66 40.00 40.00 40.00
CASK 734 08/15/91 CA SK 1 1 0 2 22.34 40.00 40.00 40.00
CASK 735 08/15/91 CA SK 0 0 0 0 18.93 40.00 40.00 40.00
CASK 2446 08/12/94 CA WD 0 1 0 1 26.31 40.00 40.00 40.00
CASK 2516 09/01/94 CA SK 0 0 0 0 17.65 40.00 40.00 40.00
CASK 2518 09/02/94 CA FX 0 1 0 1 22.46 40.00 40.00 40.00
CASK 2521 09/06/94 CA SK 1 0 0 1 34.56 40.00 40.00 40.00
CASK 3024 01/29/98 CA DG 0 0 0 0 22.95 40.00 40.00 40.00
NCSK 2403 02/14/95 TN DG 0 0 0 0 22.31 19.33 40.00 40.00
NCSK 2572 02/15/95 KY DG 0 1 0 1 27.09 40.00 40.00 40.00
NCSK 2865 06/12/95 TN FX 1 1 0 2 32.98 40.00 40.00 40.00
NCSK 3602 08/18/97 OH DG 2 0 0 2 25.44 24.03 40.00 40.00
NCSK 3603 01/29/98 AR DG 0 1 1 2 32.28 29.40 40.00 40.00
NCSK 3606 01/21/97 AR DG 1 1 0 2 29.18 26.74 40.00 40.00
NCSK 3761 02/12/98 KY DG 0 0 1 1 35.59 28.70 40.00 40.00
NCSK 4341 04/15/99 MI SK 0 0 0 0 18.14 17.41 40.00 40.00
NCSK 4363 05/17/99 KY SK 0 0 1 1 26.91 16.23 39.15 40.00
NCSK 4366 05/17/99 KY SK 0 0 0 0 19.73 18.04 40.00 40.00
NCSK 4367 05/17/99 KY SK 0 0 1 1 24.22 18.47 40.00 40.00
NCSK 4370 05/17/99 KY SK 0 0 0 0 22.64 18.45 40.00 40.00
NCSK 4374 06/25/99 VA SK 0 1 0 1 17.11 40.00 40.00 40.00
NCSK 4375 06/25/99 KY SK 0 1 0 1 19.64 40.00 40.00 40.00
NCSK 3652 11/22/97 TX HR 0 0 0 0 26.00 24.19 40.00 40.00
RAC 498 01/12/96 FL FX 0 0 1 1 40.00 40.00 19.21 40.00
RAC 502 01/12/96 FL FX 0 0 1 1 40.00 40.00 19.94 40.00
RAC 700 10/12/94 FL RC 1 1 0 2 40.00 40.00 19.52 40.00
RAC 2942 02/11/98 DE DG 0 0 0 0 40.00 40.00 21.38 40.00
RAC 2988 01/28/98 AL DG 0 0 2 2 40.00 40.00 25.72 40.00
RAC 3385 04/08/97 FL DG 0 1 0 1 40.00 40.00 23.15 40.00
RAC 3489 01/28/98 WV FX 0 0 0 0 40.00 40.00 16.26 40.00
RAC 3795 06/28/98 FL FX 0 0 0 0 40.00 40.00 20.88 40.00
RAC 3803 05/22/98 FL DG 0 1 0 1 40.00 40.00 17.23 40.00
RAC 3876 06/28/98 FL FX 0 0 0 0 40.00 40.00 15.52 40.00
RAC 3877 06/28/98 FL FX 0 0 0 0 40.00 39.44 16.78 40.00
RAC 3883 06/12/98 MD BV 2 0 0 2 40.00 40.00 14.76 40.00
RAC 4085 12/17/98 AL HR 0 0 1 1 40.00 40.00 15.88 40.00
RAC 4198 02/09/99 AL RC 0 0 0 0 40.00 40.00 15.27 40.00
RAC 4501 09/09/99 VA SK 0 0 0 0 40.00 40.00 15.33 40.00
SCSK 488 05/01/92 AZ SK 3 1 0 4 40.00 40.00 40.00 40.00
SCSK 704 03/15/93 NM FX 0 0 0 0 40.00 40.00 40.00 18.12
SCSK 705 03/11/93 NM CT 1 0 0 1 40.00 40.00 40.00 18.29
SCSK 744 09/08/94 TX SK 3 2 0 5 40.00 40.00 40.00 37.55
SCSK 749 09/08/94 TX SK 3 2 0 5 40.00 40.00 40.00 40.00
SCSK 751 12/30/91 TX SK 2 0 2 4 40.00 40.00 40.00 19.58
SCSK 752 12/30/91 TX SK 1 0 1 2 40.00 40.00 40.00 17.84
SCSK 912 11/25/92 OK BV 3 2 1 6 40.00 40.00 40.00 40.00
SCSK 977 09/16/92 MO SK 0 0 0 0 40.00 40.00 40.00 17.82
SCSK 1001 09/16/02 KS SK 0 0 0 0 40.00 39.27 40.00 21.89
SCSK 1004 02/01/94 KS SK 0 0 0 0 40.00 40.00 40.00 26.38
SCSK 1236 12/29/91 TX SK 1 1 0 2 40.00 40.00 40.00 24.21
SCSK 1425 01/03/91 CO SK 1 1 1 3 40.00 40.00 40.00 26.93
SCSK 1426 01/03/91 CO SK 1 1 1 3 40.00 40.00 40.00 30.11
SCSK 1522 11/28/92 KS DG 0 0 1 1 40.00 40.00 40.00 20.24
SCSK 2205 01/08/94 LA SK 0 0 1 1 40.00 40.00 40.00 16.81
SCSK 2221 02/03/94 NE SK 1 1 2 4 40.00 40.00 40.00 28.09
SCSK 2222 02/13/94 NE SK 1 1 2 4 40.00 40.00 40.00 23.89
SCSK 2523 09/08/94 TX SK 2 0 2 4 40.00 40.00 40.00 23.05
SCSK 2524 09/08/94 TX SK 2 1 2 5 40.00 40.00 40.00 28.94
SCSK 3461 01/29/98 AR CT 0 0 0 0 40.00 40.00 40.00 18.25
SCSK 3604 01/29/98 AR CT 3 1 1 5 40.00 40.00 40.00 37.73
SCSK 3607 01/29/98 AR CT 0 0 0 0 40.00 40.00 40.00 16.24
aDate of RNA extraction.
bState from which the sample was submitted to CDC. AL, Alabama; AR, Arkansas; AZ, Arizona; CA, California; CO, Colorado; DE, Delaware; FL, Florida; KS,
Kansas; KY, Kentucky; LA, Louisiana; MD, Maryland; MI, Michigan; MO, Missouri; NE, Nebraska; NM, New Mexico; OH, Ohio; OK, Oklahoma; TN, Tennessee; TX, Texas; VA, Virginia; WV, West Virginia.
cHost species from which virus was isolated. BV, bovine; CT, cat; DG, dog; FX, fox; HR, horse; ML, mountain lion; RC, raccoon; SK, skunk; WD, wolf hybrid. dThe number of sequence mismatches between the target sequence and that of the TaqMan primers and probe designated as the phylogenetic variant. Mismatches
are shown as those in the sequences of the forward primers (F), reverse primers (R), and TaqMan probes (P). The total number (T) of mismatches is also shown.
eSamples were tested with all four sets of TaqMan primers and probe. Numbers areC tvalues.
301
on May 15, 2020 by guest
http://jcm.asm.org/
[image:3.603.48.541.66.662.2]stability of this new value with various amounts of RNA. Stable amplification efficiencies were evident for both SG and BR samples when ⬍15 ng of total RNA was added (results not shown).
Repeatability.Due to the limited quantity of the samples,
repeat RNA extraction was not possible. Therefore, the re-peatability of the assay could only be assessed by repeat RT reactions and TaqMan PCRs. For experimental tissue samples, results were consistent, showing little variability within runs. The ranges ofCtvalues for the three replicates of each sample were low for both BR (mean range, 0.2; 95% confidence limits [CL], 0.09 to 0.31) and SG (mean range, 0.7; 95% CL, 0.12 to 1.28). Interrun variability was found to be insignificant (rs⫽ 0.900,n⫽10,P⬍0.001).
Correlation with concentration of infectious virus.The SG
homogenates from experimentally infected skunks were inoc-ulated intracerebrally into mice, and a titer was calcinoc-ulated according to the Karber method (9). The MICLD50correlated significantly (P⬍0.01) with the corresponding TaqMan PCR quantity for samples from experimental animals (Fig. 3).
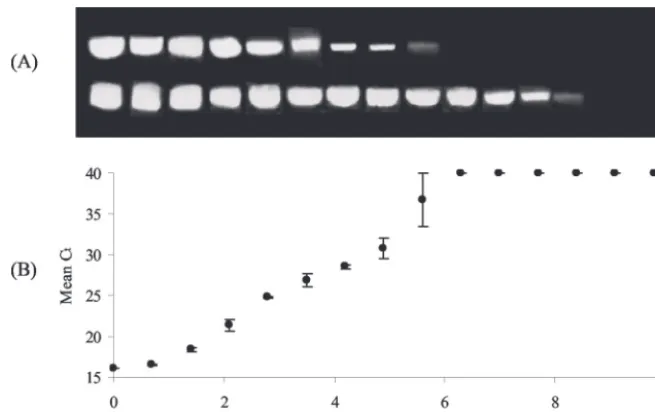
Sensitivity.The sensitivity of the TaqMan PCR was assessed
against the results of a heminested PCR (Fig. 4). The TaqMan
PCR was as sensitive as the primary PCR in that both could detect viral RNA from a 105.6 dilution of the stock RNA solution. The heminested PCR, however, was able to detect viral RNA from a 107.7dilution of the stock RNA.
To test for an increase in sensitivity, the TaqMan PCR was run for a greater number of cycles (60 rather than 40) and with increased volumes of cDNA in the PCR (3 to 5l). Neither of these methods resulted in an increased detection limit (results not shown).
Detection of rabies virus RNA from historical samples.Of
the 62 historical isolates tested, 44 (71%) were typed correctly by this assay. That is, cDNA was successfully amplified by the TaqMan primers and probe designed to detect the variant to which the isolate was placed (Fig. 1). Only three samples (5%) were negative against all TaqMan primer and probe sets (Ta-ble 1).
There was considerable cross-reaction between the NCSK and CASK TaqMan assays: 11 samples were positive in the assays using both NCSK and CASK primer and probe sets, but in each case the lowest Ct (i.e., the highest PCR quantity) corresponded to the phylogenetic placement of the isolate (Fig. 1). Additionally, four samples designated NCSK by
phy-FIG. 1. Maximum likelihood phylogenetic tree depicting the relationships of the 62 historical rabies virus isolates. The tree is rooted at the midpoint for purposes of clarity. The tree is based on 164 nucleotides of the N gene, corresponding to positions 1123 to 1287 of the Pasteur RV N gene (GenBank accession no. A492968) and generated with the PAUPⴱprogram (20). Samples within the clear box are those NCSK samples typed by the TaqMan PCR assay as CASK. Samples within the gray boxes are those that were weakly positive or negative by TaqMan PCR.
302 HUGHES ET AL. J. CLIN. MICROBIOL.
on May 15, 2020 by guest
http://jcm.asm.org/
[image:4.603.111.473.67.422.2]logeny were negative with the NCSK primer and probe set but positive with the CASK TaqMan primer and probe set (sample numbers 2865, 2572, 4374, and 4375).
Three samples were negative in assays that used all four sets of TaqMan primers and probes. Additionally, two samples had a meanCtof⬎35. These five samples were all SCSK variants with a high number of mismatches between the viral sequence and that of the TaqMan primer and probe set (4, 5, 6, 5, and 5 mismatches for sample numbers 488, 744, 749, 912, and 3604, respectively). Furthermore, all of these samples contained a mismatch close to the center of the probe.
To assess the effect onCtvalues of time since RNA extrac-tion, samples with no differences in sequences from the se-quences of the TaqMan primer and probe sets were selected. A correlation analysis showed that the age of the sample sig-nificantly reduced the unadjustedCtvalue (rs⫽0.549,n⫽22,
P⫽0.008) but not the-actin-adjusted values (rs⫽0.339,n⫽ 22,P⫽0.123). The method of RNA extraction did not signif-icantly alter the results of the TaqMan PCRs (results not shown).
Influence of sequence mismatches on amplification. The
results of TaqMan PCR assays using historical samples were normalized according to the levels of-actin mRNA. For each sample, adjusted values correlated significantly with raw values (rs ⫽ 0.851, n ⫽ 62, P ⬍ 0.001). Mean and adjusted data showed no significant departure from normality (P ⬍ 0.05). The total number of mismatches between the target sequences and those of the TaqMan primer and probe sets showed a significant positive association withCtvalues (Fig. 5).
DISCUSSION
The TaqMan PCR assay to detect RV RNA was as sensitive as the primary PCR assay but had a considerably reduced detection limit compared to the detection limit of a hemin-ested PCR. Methods adopted to increase sensitivity, such as
increasing the template concentration and the number of ther-mocycles, failed to increase the detection limit of the assay. For this reason, it is unlikely that this assay, in its present form, could improve upon the existing nested-PCR methods used for laboratory detection of RV RNA (15). However, the sensitivity of the assay can be increased to the level of the heminested PCR assay by using a first-round PCR product as the template for a TaqMan PCR (V. Shankar, personal communication). The sensitivity of our TaqMan assay compared to those of conventional PCR methods from other laboratories (13, 21) has not been tested.
The use of a large number of historical samples allowed an assessment of the effect of sequence mismatches between the TaqMan primers and probes and the viral target sequences. The primers and probes designed for this study were not in-tended to be optimal for the detection of the variants of inter-est but were chosen to allow a thorough, quantitative study of the effect of sequence mismatches on sensitivity and specificity. The genomic region from which the oligonucleotides were designed was limited to that where sufficient sequence data were available.
Mismatches between TaqMan primer and probe sequences and the target sequence are clearly detrimental to amplifica-tion. The number of mismatches reduces the efficiency of the reaction such that more than four differences can result in a weakly positive or negative result. A point mutation at the center of the probe (the site used for single nucleotide poly-morphism detection) can prevent generation of a fluorescent signal although the PCR itself proceeds normally (results not shown).
[image:5.603.42.549.81.273.2]For these reasons, which are based on existing sequence data, it seems unlikely that sufficient homology exists to gen-erate TaqMan primer and probe sets capable of detecting a wide range of RV variants. For over 250 bat RV variants from the United States (where sequence data were available over a
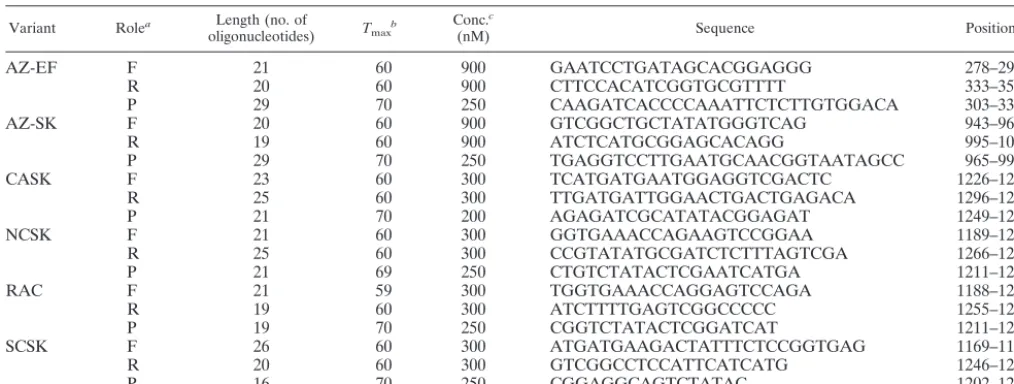
TABLE 2. Oligonucleotide sequences for TaqMan primers and probes
Variant Rolea Length (no. of
oligonucleotides) Tmaxb Conc.
c
(nM) Sequence Positiond
AZ-EF F 21 60 900 GAATCCTGATAGCACGGAGGG 278–298
R 20 60 900 CTTCCACATCGGTGCGTTTT 333–352
P 29 70 250 CAAGATCACCCCAAATTCTCTTGTGGACA 303–331
AZ-SK F 20 60 900 GTCGGCTGCTATATGGGTCAG 943–963
R 19 60 900 ATCTCATGCGGAGCACAGG 995–1013
P 29 70 250 TGAGGTCCTTGAATGCAACGGTAATAGCC 965–993
CASK F 23 60 300 TCATGATGAATGGAGGTCGACTC 1226–1247
R 25 60 300 TTGATGATTGGAACTGACTGAGACA 1296–1272
P 21 70 200 AGAGATCGCATATACGGAGAT 1249–1270
NCSK F 21 60 300 GGTGAAACCAGAAGTCCGGAA 1189–1209
R 25 60 300 CCGTATATGCGATCTCTTTAGTCGA 1266–1242
P 21 69 250 CTGTCTATACTCGAATCATGA 1211–1227
RAC F 21 59 300 TGGTGAAACCAGGAGTCCAGA 1188–1208
R 19 60 300 ATCTTTTGAGTCGGCCCCC 1255–1235
P 19 70 250 CGGTCTATACTCGGATCAT 1211–1227
SCSK F 26 60 300 ATGATGAAGACTATTTCTCCGGTGAG 1169–1191
R 20 60 300 GTCGGCCTCCATTCATCATG 1246–1226
P 16 70 250 CGGAGGCAGTCTATAC 1202–1219
aF, forward PCR primer; R, reverse PCR primer; P, TaqMan probe. bT
mcalculated by using Primer Express. cOptimal final concentration.
dNucleotide position relative to the Pasteur virus N gene (GenBank accession number A492968).
on May 15, 2020 by guest
http://jcm.asm.org/
300-nucleotide region of the N gene), based on the results of this study,⬃20 sets of TaqMan primers and probes would be required to detect every isolate (results not shown). An align-ment of bat RV sequence data for the region covered by the TaqMan primer and probe set recently described to detect genotype 1 lyssaviruses (3) suggests that a number of these
samples would not be detectable by existing TaqMan method-ology (results not shown). The level of microdiversity within clades of RV may prove highly problematic in applying Taq-Man technology to RV surveillance. Current PCR methods that utilize degenerate primers with a reduced annealing tem-perature allow amplification despite reduced sequence
homol-FIG. 2. Linearity of the TaqMan reaction for RNA extracted from SG homogenates (A) and BR homogenates (B) from an experimentally infected rabid skunk. Error bars show 95% CL of the mean of three replicate TaqMan PCRs.
FIG. 3. Correlation between infectious concentration of RV (mouse inoculation test) and TaqMan PCR quantity for SG tissues obtained from experimentally infected rabid skunks (rs⫽ ⫺1.00,n⫽5,P⬍0.01). For ease of interpretation, TaqMan quantities are given as 40 minus the meanCt.
304 HUGHES ET AL. J. CLIN. MICROBIOL.
on May 15, 2020 by guest
http://jcm.asm.org/
[image:6.603.137.448.66.411.2]ogy (15), although such methods do generate nonspecific prod-ucts, requiring confirmation of the PCR results by nucleotide sequencing.
The possibility remains, however, of using TaqMan technol-ogy as an adjunct to existing detection methods. If the epide-miology of rabies is well defined within a geographical region, then screening with RV variant-specific TaqMan primer and probe sets could serve as a substitute for nucleotide sequenc-ing. Multiplex assays have been developed that can simulta-neously detect different variants and/or viruses (12, 24). Our TaqMan assay used random primers for cDNA generation and identical thermocycling conditions for each TaqMan primer and probe set, ensuring that the same cDNA sample can be used for multiple reactions on the same TaqMan plate, irre-spective of the TaqMan primers and probes.
We propose that this TaqMan assay can be readily applied to quantitative studies of RV infection. Over a range of RNA
levels there was little distortion of relative values when RNA concentrations that occur with clinical samples were used. In fact, these results suggest that samples for which high levels of total RNA are expected (e.g., tissues) should be suspended in
⬎100l of water. The repeatability of the assay (as determined on the basis of different cDNA samples) was excellent in all cases. However, the variability due to repeat RNA extraction was not tested. Importantly, the quantity of RV determined by the TaqMan PCR assay correlated significantly with that esti-mated through virus isolation by the mouse inoculation test. Such an association is crucial when this technology is applied to pathogenesis studies, such as those used for foot-and-mouth disease virus infection of pigs (1). Although we have only assessed relative quantities of RV RNA, there is no evidence to suggest that absolute quantitation (according to quantitative standards) could not be developed if desired.
Crucial to the success of quantitative PCR is the ability to adjust the levels of RV determined by the TaqMan PCR ac-cording to levels of an endogenous control to account for variation in tissue samples and RNA extraction efficiency. Here we have shown that the levels of RV RNA determined by TaqMan PCR can be adjusted according to those of -actin mRNA. The amplification of both -actin mRNA and RV RNA had acceptable linear ranges and amplification efficien-cies over the levels of total RNA used in this study and those likely to be used from biological samples. Normalization was successfully applied to correct for the effects of RNA degra-dation over time.
ACKNOWLEDGMENTS
[image:7.603.128.456.69.275.2]We thank Ivan Kuzmin, Staci Murphy, Mike Niezgoda, and Lillian Orciari for their contributions to this work. We also thank the staff in the Viral and Rickettsial Zoonoses Branch and the Animal Resources Branch at the CDC for their outstanding technical expertise and con-tributions.
FIG. 4. Comparative sensitivity of a conventional heminested PCR and TaqMan PCR for detection of RV RNA. (A) Products of conventional PCR. The upper band shows the 397-bp product from the first-round reaction; the lower band shows the 376-bp product from the heminested reaction. (B) Results of TaqMan PCR. ACtvalue of 40 indicates a negative reaction. Error bars show 95% CL of the mean of three replicate
TaqMan PCRs.
FIG. 5. Association of TaqMan PCR values and sequence mis-matches between the TaqMan primer and probe sets and the viral target sequences. The two variables are significantly associated in terms of-actin-adjusted data (F1,60⫽57.86,P⬍0.001) and raw data (values not shown;F1,60⫽61.27,P⬍0.001).
on May 15, 2020 by guest
http://jcm.asm.org/
[image:7.603.46.282.558.679.2]G.J.H. was funded by an American Society for Microbiology and National Centers for Infectious Disease postdoctoral fellowship.
REFERENCES
1. Alexandersen, S., M. B. Oleksiewicz, and A. I. Donaldson.2001. The early pathogenesis of foot-and-mouth disease virus in pigs infected by contact: a quantitative time-course study using TaqMan RT-PCR. J. Gen. Virol.82:
747–755.
2. Arai, Y. T., I. V. Kuzmin, Y. Kameoka, and A. D. Botvinkin.2003. New lyssavirus genotype from the lesser mouse-eared bat (Myotis blythi), Kyrghyzstan. Emerg. Infect. Dis.9:333–337.
3. Black, E. M., J. P. Lowings, J. Smith, P. R. Heaton, and L. M. McElhinney.
2002. A rapid RT-PCR method to differentiate six established genotypes of rabies and rabies-related viruses using TaqMan technology. J. Virol. Meth-ods105:25–35.
4. Centers for Disease Control and Prevention.1997. Human rabies–Kentucky and Montana, 1996. Morb. Mortal. Wkly. Rep.46:397–400.
5. Crepin, P., L. Audry, Y. Rotivel, A. Gacoin, C. Caroff, and H. Bourhy.1998. Intravitam diagnosis of human rabies by PCR using saliva and cerebrospinal fluid. J. Clin. Microbiol.36:1117–1121.
6. Garcia, S., J.-M. Crance, A. Billecoco, A. Peinnequin, A. Jouan, M. Bouloy, and D. Garin.2001. Quantitative real-time PCR detection of Rift Valley fever virus and its application to evaluation of antiviral compounds. J. Clin. Microbiol.39:4456–4461.
7. Hall, T. A.1999. BioEdit: a user-friendly biological sequence alignment editor and analysis program for Windows 95/98/NT. Nucleic Acids Symp. Ser.41:95–98.
8. Hu, A., M. Colella, J. S. Tam, R. Rappaport, and S.-M. Cheng.2003. Simul-taneous detection, subgrouping, and quantitation of respiratory syncytial virus A and B by real-time PCR. J. Clin. Microbiol.41:149–154.
9. Karber, G.1931. 50% end point calculation. Arch. Exp. Pathol. Pharmakol.
162:480–483.
10. Koprowski, H.1996. The mouse inoculation test, p. 80–86.InF.-X. Meslin, M. M. Kaplan, and H. Koprowski (ed.), Laboratory techniques in rabies, 4th ed. World Health Organization, Geneva, Switzerland.
11. Krebs, J. W., H. R. Noll, C. E. Rupprecht, and J. E. Childs.2001. Rabies surveillance in the United States during 2001. J. Am. Vet. Med. Assoc.
221:1690–1701.
12. Meng, Q., C. Wong, A. Rangachari, S. Tamatsukuri, M. Sasaki, E. Fiss, L. Cheng, T. Ramankutty, D. Clarke, H. Yawata, Y. Sakakura, T. Hirose, and C. Impraim.2001. Automated multiplex assay system for simultaneous
de-tection of hepatitis B virus DNA, hepatitis C virus RNA, and human immu-nodeficiency type 1 RNA. J. Clin. Microbiol.39:2937–2945.
13. Nadin-Davis, S. A.1998. Polymerase chain reaction protocols for rabies virus discrimination. J. Virol. Methods75:1–8.
14. Oleksiewicz, M. B., A. I. Donaldson, and S. Alexandersen.2001. Develop-ment of a novel real-time RT-PCR assay for quantitation of foot-and-mouth disease virus in diverse porcine tissues. J. Virol. Methods92:23–35. 15. Orciari, L. A., M. Niezgoda, C. A. Hanlon, J. H. Shaddock, D. W. Sanderlin,
P. A. Yager, and C. E. Rupprecht.2001. Rapid clearance of SAG-2 rabies virus from dogs after oral vaccination. Vaccine19:4511–4518.
16. Schutten, M., B. van den Hoogen, M. E. van der Edne, R. A. Gruters, A. M. D. E. Osterhaus, and H. G. M. Niesters.2000. Development of a real-time quantitative RT-PCR for the detection of HIV-2 RNA in plasma. J. Virol. Methods88:81–87.
17. Smith, I. L., K. Halpin, D. Warrilow, and G. A. Smith.2001. Development of a fluorogenic RT-PCR assay (TaqMan) for the detection of Hendra virus. J. Virol. Methods98:33–40.
18. Smith, J. S.2002. Molecular epidemiology, p. 79–111.InA. C. Jackson and W. H. Wunner (ed.), Rabies. Academic Press, New York, N.Y.
19. Smith, J. S., D. B. Fishbein, C. E. Rupprecht, and K. Clark.1991. Unex-plained rabies in three immigrants in the United States: a virologic investi-gation. N. Engl. J. Med.324:205–211.
20. Swofford, D. L.2000. PAUPⴱversion 4: phylogenetic analysis using parsi-mony (ⴱand other methods). Sinauer Associates, Sunderland, Mass. 21. Tordo, N., H. Bourhy, and D. Sacremento.1995. Polymerase chain reaction
technology for rabies virus, p. 125–145.InJ. P. Clewley (ed.), The polymer-ase chain reaction (PCR) for human viral diagnosis. CRC Press, Boca Raton, Fla.
22. Trimarchi, C. V.2000. Rabies, p. 335–338.InS. Specter, R. Hodinka, and S. Young (ed.), Clinical virology manual. ASM Press, Washington, D.C. 23. Trimarchi, C. V., and J. S. Smith.2002. Diagnostic evaluation, p. 307–349.In
A. C. Jackson and W. H. Wunner (ed.), Rabies. Academic Press, New York, N.Y.
24. Van Elden, L. J. R., M. Nijhuis, P. Schipper, R. Schuurman, and A. M. Van Loon.2001. Simultaneous detection of influenza viruses A and B using real-time quantitative PCR. J. Clin. Microbiol.39:196–200.
25. Velleca, W. M., and F. T. Forrester.1981. Detection and identification, p. 69–107.InLaboratory methods for detecting rabies. Centers for Disease Control and Prevention, Atlanta, Ga.
26. Webster, W. A., and G. A. Casey.1996. Virus isolation in neuroblastoma cell culture, p. 96–104.InF.-X. Meslin, M. M. Kaplan, and H. Koprowski (ed.), Laboratory techniques in rabies, 4th ed. World Health Organization, Ge-neva, Switzerland.
306 HUGHES ET AL. J. CLIN. MICROBIOL.