Journal of Theoretical and Applied Information Technology 15th August 2017. Vol.95. No.15
© 2005 - Ongoing JATIT & LLS
ISSN: 1992-8645 www.jatit.org E-ISSN: 1817-3195
3441
THE ROLE OF THE OVERALL EQUIPMENT
EFFECTIVENESS AS A DECISION SUPPORT TOOL FOR
STRUCTURING THE ROADMAP OF A TFS
TRANSFORMATION (CONSTRAINT THEORY, SAFETY OF
OPERATION, AND SIX SIGMA).
1RABIAE SAIDI, 2PR AZIZ SOULHI, 3PR JAMILA EL ALAMI
1PhD student at the National School of Mining Laboratory LASTIMI, CEDOC EMI, Rabat, Morocco
2Professor at the National School of Mining, Rabat, Morocco
3Professor at the EST Sale, morocco
ABSTRACT
The purpose of this article is to explain how the overall equipment effectiveness (OEE) is used to initiate and structure reflection on a new approach called "TSF transformation", that can improve the performance of the means of production combining the theory of Constraints (ToC) and its translation to identify machine-spe-cific bottlenecks, Six sigma method to avoid variability of key maintenance parameters such as reliability and maintainability, availability and security, and (Such as survival law, reliability diagrams, etc.) that could be integrated into the Six Sigma method, like MSP (Statistical Process Methods) methods.
Kkeywords:Bottlenecks, Overall Equipment Effectiveness, Reliability-Based Maintenance, FMECA
Analy-sis, Operational Safety, Theory Of Constraints, Six Sigma.
1. INTRODUCTION
Given the importance of reliability, availability and safety of machines in improving the performance of production systems. The efficiency of these machines has become an inevitable crite-rion of judgment. But in order to improve this effi-ciency, it would be important to identify a relevant indicator to measure it properly, such as the OEE (Overall Equipment Effectiveness) in order to de-termine all factors of influence and to understand what it can not Be achieved only through a rational and coherent use of an operational transformation of improvement which aims at improving perfor-mance in this case six sigma, safety of operation as well as the theory of constraints. Through this arti-cle, we intend to show how the OEE can be a tool for decision-making. And how can it structure a re-flection around a new transformation of the opera-tional performance of a production system that we have named "TFS" integrating the Theory of con-straints, the Safety of Operation, and the Six Sigma approach?
2. LITERATURE REVIEW
We will present a general overview of methods for addressing the "efficiency, reliability, availability and safety" aspects of production equipment. These approaches can be divided, ac-cording to the analysis tools adopted, into three cat-egories:
Continuous improvement approach, particu-larly the new ToC (Constraint Theory) ap-proach as well as Six Sigma;
Empirical approach, we mainly mention maintenance based on reliability (RCM);
Analytical approach: safety of operation;
Standard approach: for NF E 60-182, which describes how operational indicators are calcu-lated.
2.1 ToC: Theory of Constraints
3442 (ToC) has been the subject of a series of publica-tions, but remains very unknown in the world of maintenance in the same way as the method Six Sigma. In general, the ToC makes it possible to con-centrate progress in the right place, that is to say, bottlenecks which are production resources whose real capacity does not satisfy the need Customers [1] presenting a constraint penalizing the total ca-pacity of the production. The Theory of Constraints makes it possible to increase performance faster, the approach of which is to show that bottlenecks completely determine the rules and conditions of production. It is based on two main steps:
Identify bottlenecks: Initially, the analysis of the plant must make it possible to locate the bottleneck (s). Generally, the identification of the constraint is easy because the outstanding and the fall of the capacities accumulate before the bottlenecks.
Rhythm the factory to the "sound" of the bot-tlenecks to balance the capacities and flows : The flows of the plant must be put under con-trol and piloted according to the capacity of the bottlenecks, following the so-called "drum-buffer-rope" approach:
Drum: optimizing the scheduling of bottle-necks to maximize production.
Buffers: establishment of a buffer stock in front of these resources and only these re-sources in order to avoid the forced shutdown of production and following the failure of a non-bottleneck equipment (c That is to say non-critical), and setting up a second stamp be-fore the expeditions to ensure compliance with the delays.
Rope: adaptation of production start-up rules according to the program of the bottleneck to avoid the accumulation of unnecessary work in progress.
2.2 Reliability Based Maintenance (RCM):
Reliability based maintenance (RCM) emerged in the 1960s in the aeronautical field, in particular to reduce the maintenance costs of B747 aircraft, or preventive maintenance was very expen-sive at the time. It was taken over by EDF in 1990 for the maintenance of the nuclear fleet and tends to be applied in many complex industrial sites where maintenance operations are carried out. Reliability-based maintenance is considered to be a systematic method for identifying the most efficient preventive maintenance tasks [3] and pursues three goals:
Reduce maintenance costs without degradation of reliability;
Improve the safety and availability of installa-tions (by being more relevant to the periodici-ties and elements to be maintained);
Master the life of the equipment;
In order to improve the availability of production equipment. It is based on the following three major steps:
Identify critical equipment;
Prioritize system failures using feedback from experiments (typically workshops with ex-perts, possibly using data from a CMMS sys-tem and / or manufacturer's documentation for each Equipment) to identify past failures to fo-cus maintenance on the least reliable compo-nents;
Developing FMEA analyzes (analysis of fail-ure modes of their effects and criticality) for each critical equipment. A failure mode, ac-cording to the standard NF EN 60 812, is an effect by which the failure of a component of the system is observed. This definition shows that the method is based on the decomposition of the system into elements. The data collec-tion makes it possible to know the behavior of each element. The system's hardware and func-tional architecture makes it possible to induce all the effects of all the failure modes of all the elements of the system [2].
The resolution of the failure modes of produc-tion equipment requires that one knows its pro-duction mission, the various components, and their modes of failure. The resolution methods must be chosen according to the complexity of the equipment. In this context, the FMECA analysis is important, particularly in the case where digital data are not available.
Develop maintenance plans that focus primar-ily on the most critical components that can cause failures.
2.3 Safety of Operation:
The safety of operation is a concept, which is cline in four quantifiable quantities; they de-pend on each other. These four quantities must be taken into account for any safety study. At times, the initials of its four characteristic magnitudes, FMDS, denote safety:
Reliability: probability the system is not failing on [0, t].
Maintainability: probability that the system is repaired on [0, t].
3443
Safety: Probability of avoiding an event cata-strophic.
2.4 Presentation of The French Standard NF E 60-182
In the industrial world, sources of disruption to production processes are generally multiple. This is the reason why real productivities are lower than expected. "... The theoretically achievable quantity is a function of the time allowed or considered, hence endless debates on the reference time: maxi-mum theoretical opening (365 days × 24 hours per year, for example), or the time actually worked ac-cording to the company's schedule, or the time the-oretically necessary to carry out the production ". Standard N FE 60-182 describes the procedures for calculating OEE. These are the formulas for calcu-lating this performance indicator taking into ac-count the configuration of the system which distrib-utes the different state times of a production means. The analysis of the OEE can be carried out from two different viewing angles: taking into account the productivity aspect as well as the functional safety aspect, that is to say taking into account only the functional or dysfunctional behaviors of Ma-chines.
[image:3.612.91.305.404.510.2]
Figure 1: Decomposition of OEE [4]
Total time (Tt): initial time, which brings to-gether all the possible states of the means of production. In the case of a year, the total is 8760 h.
Opening time (To): The total time which cor-responds to the part of the working time, while eliminating the closing of the workshop, which leads to the disengagement of the means of pro-duction (holiday periods...).
To= (Tt)-time (close factory) (1)
Required Time (Tr): The length of the opening time corresponding to the part of the working hours while eliminating stoppages related to
preventive maintenance or load tests of the means of production.
Tr= (To)-time(planned shutdown) (2)
Operating Time (Tp): The time period during which the means of production is ex-ploited in production, which does not include unexpected downtime and consequent breakdowns, change of series, absence of personnel.
Tp= (Tr)-time(availability losses) (3)
Net time (Tn): The period of time during which the means of production is exported without taking into account the duration corresponding to the fall in the rate, during which the means of production would have produced good prod-ucts and bad, referring to the criteria of quality.
Tn= (Tp)-time(speed loss) (4)
Useful time (Tu): The period of time during which the means of production is operated with the subtraction the time necessary to correct all problems related to non-quality (scrap, recy-cling, etc.).
Tu= (Tn)-time(quality loss) (5)
Based on figure 1, the standard NF E 60-182 defines the main performance indicators, in particular, the Economic yield rates, it is the strate-gic indicator of commitment of the means of pro-duction, it allows the managers to evaluate the in-dustrial strategy of organization of the company. The Economic yield rate is defined as:
Economic yield rate = Tu/Tt (6)
3444 investment ...). It expresses the reality of operation in relation to an ideal of operation and it allows to visualize the various losses of efficiency of use, per-formance and quality. The Global Rate of Return is a ratio between two quantities of time, or two quan-tities of coins produced. There are two types of weather: the time needed to produce good parts (useful time) and the available time (or opening time).The Overall yield rate is defined as:
Overall yield rate = Tu/To (7)
Overall equipment effectiveness: The optimization of production processes is based on a good appreciation of the performance indicators. The OEE has become, through the standard NF E 60-182, one of the performance indicators of pro-duction systems. The OEE primarily measures equipment performance [5]. It is a relevant means of measuring technical causes of non-performance in order to improve the efficiency of machines.
Overall equipment effectiveness = Tu/Tr (8)
2.5 World Class Performance
Each model of the system (according to the criteria already mentioned) makes it possible to calculate the value of the OEE at the SDF angle, referring to operating states [6]. The value obtained then makes it possible to evaluate the efficiency of the system taking into account the values of the World Class Performance, which defines
the thresholds based on three modes in which a sys-tem can be found:
The mode on (m) if the value Of TRS is ≥ 85%.
Degraded walking (md) if 25% ≥ OEE ≥ 85%.
Out of service if OEE≤ 25%.
As a result, the value of the Overall equipment effectiveness (OEE) of a machine can tell us about its operating states "on", "degraded" and "out of service" whose thresholds are set ac-cording to the World Class Performance. In this context, switching from one state to another is linked to events such as failure or premature degra-dation of components. This corresponds to the safe viewing angle of operation; the value of the OEE largely depends on the type of system (serial sys-tem, parallel). For a simple syssys-tem, this value cor-responds to the product of three indicators: Perfor-mance, Quality and Operational Availability. If we take into account the notion of "re-liability diagram" which is considered one of the
important concepts and foundations of operational safety, the evaluation of the OEE of a system com-prising, for example, several elements mounted in parallel depends on several Elements. It depends on the type of redundancy [7], the reparability of the components (repairable system or not), the number of components in the system. A parallel system in the case of active redundancy. For passive redun-dancy, two cases can be envisaged: first, if the sys-tem is not repairable, which means that the faulty elements are not restarted, and if the system is Re-pairable, and that any component that breaks down can be repaired and put on hold for another boot, the OEE will be defined by the formula.
3. CASE STUDY
3.1 Presentation of the Case Study
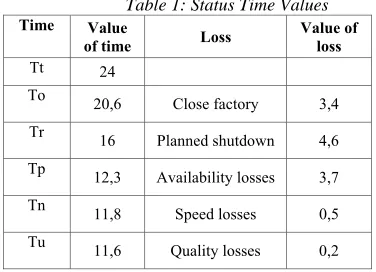
[image:4.612.326.514.557.693.2]The types of production can be classi-fied into three categories, continuous production, discontinuous or by project, knowing that many mixed types could be found. The standard in ques-tion is essentially adapted to discontinuous produc-tion. The calculation of the OEE according to the standard NF E 60-182 can be initiated under two different approaches, namely, productivity and safety of operation. The notion of productivity is ra-ther adapted to the discontinuous industry in which one can count the number of products realized, that is not the case for the continuous industry (chemis-try or parachemis(chemis-try, ..) whose term In question means the pace of production constituting an al-ready integrated loss in order to evaluate the net time (Tn). The example below illustrates the calcu-lation of the OEE for a total time of 24 hours and does not take into account the safety aspect of op-eration. This is more suitable for continuous pro-duction for the following reasons:
Table 1: Status Time Values
Time Value
of time Loss Value of loss
Tt 24
To 20,6 Close factory 3,4
Tr 16 Planned shutdown 4,6
Tp 12,3 Availability losses 3,7
Tn 11,8 Speed losses 0,5
Tu 11,6 Quality losses 0,2
3445 The availability indicates the fraction of the time planned for the production (load time), in which the equipment is actually producing [8].
Figure 2: Calculation Of Yields According To NFE 60-182
3.2 Result
Through this example, one can con-clude the value of the OEE from a "safe operating" point of view corresponds to the product of three indicators, which are performance, quality and op-erational readiness. This calculation mode is partic-ularly suitable for continuous production. The OEE because it takes into account even the losses due to the planning aspect such as preventive mainte-nance. As for continuous production, the petro-chemical industries, cement plants are typical ex-amples, machines or installations are dedicated to the product to be manufactured, which generally does not allow great flexibility. In addition to avoiding creating bottlenecks and fluidizing the flow of products, the balance of production of each of the machines must be cared for. We believe that the calculation of the Economic yield rate and Global yield rate indicators is essential for the case of an integrated platform, these indicators allow us to measure only the intrinsic performance of a pro-duction, but also performance related to extrinsic events associated with inevitable interactions in the upstream production workshops (production of the raw material). The Global yield rate in this case shows where the time is lost and categorizes both the internal and external losses as well as the axes of improvement that result.
Figure 3: Decomposition Of Losses
The case study deals with a facility that was designed to run 3.5 months (total time is in the order of 2624).
Rethinking the industrial strategy: The calcu-lation of the economic yield rate (formula 6) gives us: TRE = Tu / Tt = 36%, it shows that the commitment of this installation as means of production is very low if only for the seasonal period of operation. If we take the total stand-ard time (365 * 24h = 8760) into account, the ERR will be even lower (11% only). This re-quires a call to question the industrial strategy (Review the return on investment).
Introduce a constraint management approach as an integrated approach that can include other approaches (Lean, Six Sig-ma, and operational safety).
We note from Figure 4 that the constraints rep-resent 23% of the time lost; this is due to a time lost for the reconstitution of the stock in order to replenish the plant. This really constitutes two extrinsic bottlenecks, which totally deter-mines the rules of operation of this production installation.
The actual capacity of the facility (upstream) to meet the demand for the facility that is the sub-ject of our case study.
Integrated planning is lacking in this case. Our analysis of Figure 4 also allowed us to identify other bottlenecks on the same installa-tion with losses in terms of durainstalla-tions represented in %. But we can see from the outset that forced stops of machines as bottlenecks is the most penalizing, therefore more "constraining" than the others, and
77%
96% 98%
72%
Availaility yield
Speed yield
Quality yield
[image:5.612.90.306.150.284.2]3446 therefore it represents the major constraint of steer-ing production. In this case, if we want to improve the reliability and maintainability of the machines (source of 38% losses) by implementing a Six Sigma project, on what type of machine does it A priori without holding the constraints. Why? and in a management approach by constraints? Why. In a logic of constraint management, we will choose to carry out the Six Sigma project on the machines representing bottlenecks in terms of capacity [9] and actually penalizing production, even if they are not often broken down. The goal is to save produc-tion time. So to gain in capacity. This is the case of a metalworking company in Belgium producing steel sheets and which implemented the manage-ment not the constraints through the control of the drum-buffer-rope flows. The whole approach of a Six Sigma project to improve both the reliability (improvement of the MTBF) and the maintainabil-ity (decrease of the MTTR) must be reviewed in the way of management by constraints and by privileg-ing the bottlenecks. At this level the TRS (overall performance time) can be a CTQ (Critical to Qual-ity) indicators with double impact compared to ca-pacity and safety:
With regard to capacity, by adopting the WCP classification (World Class Performance), the calculation of the OEE makes it possible to identify the machines which are really bottle-necks and have the smallest capacity that does not allow To meet production requirements in terms of output flow, which determines both a new penalizing output rate and unexpected in-ventory levels. This is the case Implementation of the piloting of the Drum-Tampon-Cord flows. Increase of more than 80% of the flow of the gou-lot workshop. Increased productiv-ity by more than 40%. Reduction of the manu-facturing cycle by 50%.
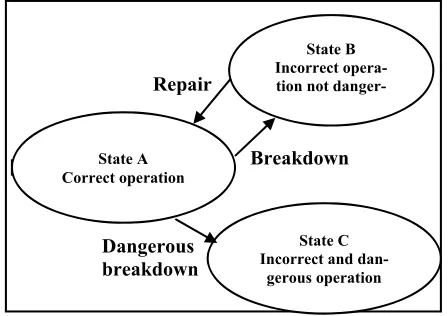
In a safety logic, a system can occupy three states by referring to the principles of safe op-eration. In addition to the normal operating state that can be defined by a OEE ≥ 85%, com-pared to the degraded step (25% ≥ OEE ≥ 85%), two degraded Combining the failure with safety) according to the figure: The ability of the machine not to pass to the incorrect and dangerous state of operation (state C, see Fig. 4) represents the parameter the safety which deserves This situation can lead to a potential
[image:6.612.329.553.396.554.2]bottleneck in the event of a technological acci-dent (the notion of an industrial catastrophe), which will have the consequence of material and human damage and a Long term, such as the case of the explosion which took place on September 21, 2001 at 10:17 am, which oc-curred at the AZF plant belonging to Grande Paroisse, a subsidiary of Total Fina Elf. "... The plant manufactures ammonium nitrate fertiliz-ers. Such an event produced a shock equivalent to an earthquake of 3.4 degrees on the Richter scale. The industrial site was immediately rav-aged for hundreds of meters, the shock wave spread in the city, blowing and damaging many homes, public buildings, blowing up windows even miles from the site. A toxic cloud rose above the plant and moved to the northwest of the agglomeration with medium- and long-term health consequences (beyond the initial record of deaths and the wounded of the first days) "[10].
Figure 4: The Three States of a System
4. DISCUSSION
4.1 Different View on the Concept of Capacity
We have seen that a bottleneck is de-fined as a production resource (machine, work-station,) whose capacity does not allow satisfying the demand. It is precisely the actual or demon-strated capacity that is different from the theoretical capacity. In this context, it will be interesting to carry out a Six Sigma project to improve the capac-ity of which the Six Sigma level will be linked to the desired (theoretical) capacity.
Dangerous breakdown
Breakdown Repair
State A Correct operation
State B Incorrect opera-tion not
danger-State C Incorrect and
3447
4.2 The OEE Does Not Take Into Account the Human
Aspect
Production systems are quite complex because they are influenced by the human, organi-zational, organizational and technical aspects that directly affect the efficiency of the maintenance of the production machines forming part of the sys-tem. Moreover, the definition of maintenance, which is defined as a set of technical, administrative and management activities aimed at maintaining a good in order to restore it to a state capable of ful-filling the required function [11]. It should be noted that the term "system" means a set of elements in-teracting in order to achieve a common goal. The elements can themselves be sets of other elements and, ultimately in our framework, men or machines, hence the emergence of the sociotechnical approach [12] and this as a new qualification of the com sys-tems of which production syssys-tems are a part. But maintain no longer means maintaining one-self in good condition, but achieving objectives [13]. In relation to this point precisely, the use of the OEE makes it possible to take another look at the maintenance of the means of production be-cause it makes it easy to identify the efficiency gap between a situation and a situation- And concludes that there is a need for a decision to improve the situation by clarifying objectives, goals and objec-tives.
However, the OEE presents a limitation insofar as it does not take into account production systems as a socio-technical system, in particular, recognizing human faults as a discrepancy in the same way as other types of loss. If, for example, af-ter a scheduled shutdown of a production plant for preventive maintenance, a triggering event causes a delay of three days in the restart of Production (here the duration and frequency of failures directly af-fects the net time Tn), the question of the efficiency of plant maintenance serves as the first reducing de-veloper focusing solely on the technical dimension. Perhaps it would be opportune to accept the losses caused by managerial incompetence and opera-tional skills or even the stress that potentially en-genders human fault.
This situation is often encountered in the case of production information systems requir-ing a high level of competence, a programmer in a DCS (numerical control system) is mistaken, for example, A line of a code using a programming lan-guage to add a new program remote control of a ro-tating machine: it has implanted a fault [13] (which
is called "dormant" if it does not manifest itself Im-mediately) in its program. When this line of code is executed, it writes an erroneous data in memory: one is then in the presence of an error. As soon as the operating operator manipulates the man-ma-chine graphical interface from the control room, the DCS system supplies him with erroneous infor-mation and thus does not perform the desired func-tion (remote machine shutdown) In accordance with what is asked of it: it is the failure, which can sometimes cost very dear.
4.3 RCM: An Empirical and Traditional Method for
Improving the Availability of Critical Equipment
Reliability-based maintenance (RCM) is an approach to improving the availability of ma-chines whose requirement to correctly set the prob-lem and quantify it is not really defined as an im-portant step. Before attempting to improve this pa-rameter, it must be measured in the same way as other losses such as the deviations of the cadence, which are intimately linked to the capacity of the machines. At this level, the MBF is not based on the initial calculation of the OEE of each machine, and therefore the quantification of initial and desired performance is often difficult. To be precise, the use of the theory of constraints (ToC) by measuring the OEE of each equipment which considers them-selves as bottlenecks and is interested in a first ac-tion consists in redefining the level of performance with respect to a base 100 Then, based on existing information, assess the gap with this base 100 and determine possible targets by quantifying the poten-tial improvement by a "Six Sigma Level".
3448 should we choose to keep the corrective or to im-plement a systematic preventive? To answer this question, there are several tools (eg Noiret's charts) including the use of the Weibüll law. The imple-mentation of this law will make it possible to an-swer mainly the following questions:
Is there a period of systematic intervention T such that preventive maintenance is more eco-nomical than corrective maintenance?
If yes, what is the optimized period θ?
On a repairable system, of which a "fragile" constituent is interchangeable, how to deter-mine the preventive replacement period θ.
4.4 Necessity to Make a Compromise Between Reliability,
Maintainability, Availability and Safety which are
Some Times Contradictory Indicators
As regards the safety of operation, some of the characteristic quantities may be contradic-tory. Improved maintainability can lead to choices that degrade reliability. The availability is therefore a compromise between reliability and maintainabil-ity.
Similarly, security and availability may be contradictory. We have seen that safety is the probability of avoiding a dangerous event, it is of-ten maximum when the system is stopped, but the availability is then zero, this is the case when a bridge 'collapse. Conversely, to improve the avail-ability of their aircraft, some airlines may be tempted to neglect preventive maintenance and flight safety decreases. The determination of a sys-tem responding to the optimal compromise between safety and availability requires that these quantities can be measured at the initial state for each critical equipment, to know the target and tolerance inter-vals. Which will be appropriate to integrate it in a Six Sigma approach by means of the CTQ diagram (phase M "To measure" of the DMAICS approach) and to decide on the parameter (s) that would be op-timized for each equipment using the voice of the (VOC) since this choice is highly dependent on ex-perience feedback.
4.5 The Calculation of the OEE Does Not Take Into
Account the Requirements of Metrology
The Standard NF E 60-182 does not re-quire metrological qualities when calculating yields because any indicator is a measure that must con-form to the rules of metrology that are standardized (NF Standard EN 13005, OIML standard...). Hence the need to carry out the following steps:
The value of the OEE of a machine can tell us about its operating states "degraded" and "out of service" according to the reference Word Class Performance (WCP) but not on the effi-ciency of the teams because behind a failure, There is always a fault and can go as far as ca-tastrophe (the case of a very sensitive equip-ment like a steam turbine, the fault can lead to a catastrophe);
Design a data collection plan;
A study of repeatability and reproducibil-ity(R& R);
The demerit of our research model is that it does not take into account the production sys-tem as a sociotechnical syssys-tem, since it always has an interaction between people and machines and therefore our article does not propose Solutions. Because the OEE as an operational indicator high-lights the losses of state times without broadening the concept of losses to cover those due to human failures and human faults which cause for example forced stops of machines (Incorrect setting of a ma-chine, failure to observe the operating parameters, etc.).This thesis will be the subject of a PhD thesis, which will have as a perspective the implementa-tion of a TFS transformaimplementa-tions approach, which will deal with a real case of the strategic thinking indus-try up to what the deployment and the soil passing of course the state of the matter in relation to the literature.
We have also shown that the theoretical model of the OEE is essentially focused on the def-inition and evaluation of availability, performance and quality. We have highlighted that if it does not integrate non-security through a combination of successive deviations from safety requirements. In returning to the important dimension of this aspect in practical terms, it will be necessary to design an enriched model of the OEE taking account of devi-ations from safety standards.
5 CONCLUSION
3449 aspect to the achievement of objectives, because the OEE makes it possible to identify the efficiency gap of maintenance between the present situation and the projected situation. The second questioning raised during the introduc-tion. The article highlights the possibility of inte-grating reliability, availability and security when improving the performance of a production system. In the "define" phase of the Six Sigma approach and using the CTQ (Critical To Quality) diagram, it will be wise to integrate the parameters of the opera-tional safety and decide on the parameter (s) that should be optimized for each Equipment, using the statistical tools of the six sigma approach, in partic-ular the tools specific to the "analysis" phase, as well as the tools of the theory of constraints for the increase of the real capacity of the machines. This is a tangible response to the "TFS" roadmap for im-proving the overall performance of the means of production by increasing production capacity, im-proving plant safety and reducing variability and taking into account the human aspect.
REFERENCES
[1] [2]
[3]
W. Dettmer, Goldratt’s Theory of Constraints: A Systems Approach to Continuous Improvement, ASQ Quality Press Publications Catalog, 1997, Page 8.
G. Zwingelstein, Reliability-Based Maintenance: A Practical Guide to MCR Application, Hermes Science Publications, 1996.
[4] J. Bufferne, The TPM Guide, Editions Organization,2006, Page 57
[5] F. Monchy, and J. Vernier, Maintenance, Meth-ods and Organizations, New factory Dunod, 2010, Page 476.
[6] T. Kombé, "Modeling the Propagation of Faults in Production Systems. » PhD
The-sis, INSA Lyon, 2011.
[7] P. O.Chelson, and R.E. Eckstein, Reliability Computtion from Reliability Block
Dia-grams, National Aeronautics and space ad-ministration, 1971, Page 2
[8] R. Hansen, Global Equipment Efficiency a Powerful Production / Maintenance Tool for Increasing Profits, Bookman Com-pany, Porto Alegre, 2006.
[9] P. Marris, Management by Constraints, Or-ganization Editions
[10] T. Lang, and Al, Interim Report Follow-up,
Epidemiological consequences of the health, the Explosion of the AZF Factory, Page 6
[11] A. Despujols., Strategic Function of Maintenance, Engineering Techniques, 2004, page12.
[12] J. Vautier, the Complex Systems, Sciences of Engineers, 2001, Page 1.
[13] D. Lelièvre, reliability, it can bring big, measure, 2004, Page 46.
![Figure 1: Decomposition of OEE [4]](https://thumb-us.123doks.com/thumbv2/123dok_us/8906361.957025/3.612.91.305.404.510/figure-decomposition-of-oee.webp)