BIROn - Birkbeck Institutional Research Online
Crawford, Ian and Lallement, R. and Welsh, B.Y. (1998) Additional
ultra-high-resolution observations of Ca+ ions in the local interstellar medium. Monthly
Notices of the Royal Astronomical Society 300 (4), pp. 1181-1188. ISSN
0035-8711.
Downloaded from:
Usage Guidelines:
Please refer to usage guidelines at
or alternatively
Additional ultra-high-resolution observations of Ca
þ
ions in the local
interstellar medium
I. A. Crawford,
1R. Lallement
2and B. Y. Welsh
31Department of Physics and Astronomy, University College London, Gower Street, London WC1E 6BT
2Service d’Ae´ronomie du CNRS, BP 3, 91371 Verrieres-le-Buisson, France
3Space Sciences Laboratory, University of California, Berkeley, CA 94720, USA
Accepted 1998 July 10. Received 1998 July 3; in original form 1998 June 4
A B S T R A C T
We present ultra-high-resolution (0.35 km s¹1FWHM) observations of the interstellar Ca K line towards seven nearby stars. The spectral resolution was sufficient to resolve the line profiles fully, thereby enabling us to detect hitherto unresolved velocity components, and to obtain accurate measurements of the velocity dispersions (b values). Absorption components with velocities similar to those expected for the Local Interstellar Cloud (LIC) and the closely associated ‘G cloud’ were identified towards six of the seven stars. However, in most cases the
b values deduced for these components were significantly larger than the b<2:2 km s¹1(i.e.
Tk<7000 K, vt<1 km s
¹1
) expected for the LIC, and it is argued that this results from the presence of additional, spectrally unresolved, components having similar velocities and physical conditions.
For two stars (dVel anda Pav) we detect interstellar components with much smaller b values (1:160:3 and 0:860:1 km s¹1, respectively) than are expected for low-density clouds within the Local Bubble. In the case of the narrow a Pav component, we also find an anomalously large Nai/Caii column density ratio, which is indicative of a relatively high
density. Thus it is possible that, in addition to LIC-type clouds, the local interstellar medium contains a population of previously undetected cooler and denser interstellar clouds.
Key words:line: profiles – ISM: atoms – ISM: structure.
1 I N T R O D U C T I O N
This paper reports continuing observational work on the structure of the local interstellar medium, performed using the Ultra-High-Resolution Facility (UHRF) at the Anglo-Australian Telescope. Earlier results of this programme have been presented by Crawford & Dunkin (1995, hereafter Paper I) and Crawford, Craig & Welsh (1997; hereafter Paper II). The UHRF is currently the world’s highest resolution astronomical spectrograph (R;l=Dl<10
6
), and has been described in detail by Diego et al. (1995). The uniquely high resolving power achievable with this instrument allows us to resolve the intrinsic profiles of interstellar absorption lines fully, and thereby obtain well-defined measurements of the line velocity dispersions (b values). These in turn can be used to place strict limits on the temperature and turbulence of the local interstellar gas.
Our current understanding of the structure of the local interstellar medium (LISM) was reviewed in Paper II, and readers requiring a short introduction to the subject, in order to put the present results into perspective, are referred to that discussion. Very briefly, the Sun is thought to lie within a warm (Tk,7000 K), low-density
(nH,0:1 cm
¹3
) interstellar cloud, and this Local Interstellar
Cloud (LIC) is itself located within the hot (Tk,10 6
K) and empty (nH,0:005 cm
¹3
) Local Bubble in the interstellar medium (e.g. Cox & Reynolds 1987; Frisch 1995). A more detailed discussion of the structure of the local interstellar medium, and the Sun’s place within it, can be found in the recent book edited by von Steiger, Lallement & Lee (1996).
The rms turbulent velocity, vt, of the LIC has been determined to
be<1 km s¹1by Linsky et al. (1995), so combining Tkand vtin the
usual way (cf. equation 1 of Paper II) we expect Caþions in the LIC to have a velocity dispersion parameter b<2:2 km s
¹1
. Only very high resolution spectroscopy is capable of measuring linewidths sufficiently accurately to determine whether or not the observed b values are in agreement with this expectation.
Another issue that can only be addressed using high-resolution spectroscopy is the extent to which apparently single LISM com-ponents observed at lower resolution are actually unresolved blends. This is important because it allows us to estimate the number of discrete low-density clouds that are present in the Local Bubble. The relationship between the LIC and the closely associated ‘G cloud’ identified by Lallement & Bertin (1992) is of particular interest. The G cloud, which is thought to occupy the longitude range 2408 &l& 458, has a very similar velocity vector
to the LIC (see Lallement et al. 1995 for details), and the absorption features arising from both clouds will generally be blended unless the spectral resolution exceeds R<3×10⁵.
2 O B S E R VAT I O N S
The UHRF observations reported here were obtained in 1996 November and 1997 June, and details of individual exposures are given in Table 1. The detector was a Tektronix CCD (1024×1024 24-mm pixels). The spectrograph was used in conjunction with an image-slicer (Diego 1993), and the output was binned by a factor of eight perpendicular to the dispersion direction in order to reduce the readout noise associated with the broad spectrum that results. At the wavelength of the Ca K line (3933.663 A˚ ), the dispersion was 0.086 A˚ mm¹1, giving a spectral coverage of 2.1 A˚ . The resolution, measured with a stabilized He–Ne laser, was 0:3560:01 km s
¹1
(FWHM), corresponding to a resolving power of R¼860 000. The CCD images were divided by a flat-field, and background light was measured from the interorder region and subtracted. Wavelength calibration was performed using a Th–Ar comparison lamp, and the wavelength-calibrated spectra were converted to the heliocentric velocity frame. Multiple exposures (Table 1) were then
co-added, and the resulting spectra are shown in Fig. 1. All of these stars exhibit strong photospheric Ca K lines, the cores of which act as the local continua for the interstellar lines.
In addition, in an attempt to confirm the reality of a feature in the UHRF spectrum of one star (aPav; see Section 3.5 below), follow-up observations of the interstellar Nai D2 line were
obtained using the European Southern Observatory’s 1.4-m Coude´ Auxiliary Telescope and CES spectrograph. The resolution used for this observation was R¼80 000, and the integration time was 400 s.
3 R E S U LT S
The interstellar line profiles obtained with the UHRF were fitted using a least-squares minimization (Levenberg–Marquardt) algo-rithm, developed within the igor-pro software environment (a WaveMetrics Inc. product). The wavelength (3933.663 A˚ ) and oscillator strength (0.6346) of the Caii K line were taken from Morton (1991).
The fitting procedure yielded heliocentric velocities, velocity dispersions and column densities for each identified absorption component, and these results are summarized in Table 2. In this
1182
I. A. Crawford, R. Lallement and B. Y. Welsh
[image:3.596.65.541.95.199.2]q1998 RAS, MNRAS 300, 1181–1188
Table 1.List of nearby stars observed for the interstellar Ca K line using the UHRF. The distances are from the Hipparcos Catalogue (ESA 1997); vLICand vG are the projected heliocentric velocities of the Local Interstellar and G clouds towards each of these stars (Lallement et al. 1995; parentheses around a G cloud velocity indicate that the star lies outside the expected G-cloud longitude range).
Star V Sp. l b Dist vLIC vG Date Exposures
Type (pc) (km s¹1) (km s¹1) (n×s)
aAnd 2.1 B8 IV 111.7 ¹32:8 29:860:6 þ9:6 (þ12.3) Nov 96 2×1200
gCet 3.5 A3 V 168.9 ¹49:4 25:160:6 þ21:0 (þ24.7) Nov 96 8×1200
dVel 2.0 A1 V 272.1 ¹7:4 24:460:2 þ2:6 þ2:4 Nov 96 5×1200
HR 4023 3.9 A2 V 274.3 þ11:9 31:560:5 ¹0:8 ¹2:0 Jun 97 3×1200
aPav 1.9 B2 IV 340.9 ¹32:5 56:262:2 ¹15:2 ¹15:5 Nov 96 2×1200
aAql 0.8 A7 V 47.7 ¹8:9 5:1460:02 ¹17:3 ¹18:0 Jun 97 3×1200
vPeg 3.5 A2 V 67.4 ¹38:7 29:660:7 ¹4:9 ð¹3:3Þ Jun 97 3×1200
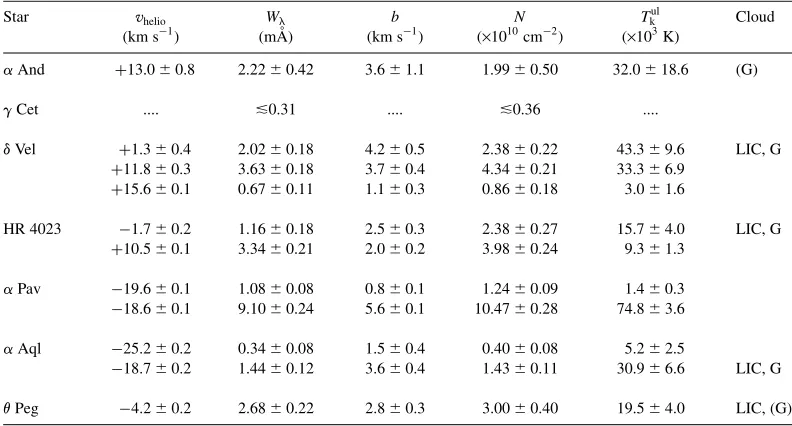
Table 2.Line profile parameters for the interstellar Ca K lines shown in Fig. 1. Wlis the equivalent width; b is the velocity
dispersion; N is the column density; and Tkulis the upper limit to the kinetic temperature determined from the b value (i.e.
assuming zero turbulent contribution to the observed line profile). The last column indicates whether a component falls within 61:5 km s
¹1of the predicted LIC or G cloud velocity for a given star (cf. Table 1; as for Table 1, parentheses indicate that the G
cloud is not expected towards a given star, even though there is close agreement in velocity). All errors are 1jvalues.
Star vhelio Wl b N Tkul Cloud
(km s¹1) (mA˚ ) (km s¹1) (×1010cm¹2) (×103K)
aAnd þ13:060:8 2:2260:42 3:661:1 1:9960:50 32:0618:6 (G)
gCet .... &0:31 .... &0:36 ....
dVel þ1:360:4 2:0260:18 4:260:5 2:3860:22 43:369:6 LIC, G
þ11:860:3 3:6360:18 3:760:4 4:3460:21 33:366:9 þ15:660:1 0:6760:11 1:160:3 0:8660:18 3:061:6
HR 4023 ¹1:760:2 1:1660:18 2:560:3 2:3860:27 15:764:0 LIC, G
þ10:560:1 3:3460:21 2:060:2 3:9860:24 9:361:3
aPav ¹19:660:1 1:0860:08 0:860:1 1:2460:09 1:460:3 ¹18:660:1 9:1060:24 5:660:1 10:4760:28 74:863:6
aAql ¹25:260:2 0:3460:08 1:560:4 0:4060:08 5:262:5
¹18:760:2 1:4460:12 3:660:4 1:4360:11 30:966:6 LIC, G
vPeg ¹4:260:2 2:6860:22 2:860:3 3:0060:40 19:564:0 LIC, (G)
[image:3.596.100.496.268.481.2]section we briefly discuss the results obtained for each of the observed stars.
3.1 aAnd
A weak interstellar Ca K line was first reported towardsaAnd by Vallerga et al. (1993), and we re-observed it, at much higher resolution, primarily in order to determine the velocity structure and velocity dispersion. Our analysis of this line was complicated somewhat by the presence of a broad ‘bump’ in the core of the
photospheric line, which we attribute to chromospheric emission. The weak interstellar line occurs in the red wing of this feature (Fig. 1a), which made it difficult to define the appropriate local continuum. Nevertheless, we note that our equivalent width (2:260:4 mA˚ , Table 2) is essentially identical to the value of
2:160:1 mA˚ obtained by Vallerga et al. (1993).
As will be seen from Tables 1 and 2, the velocity of this line (þ13.0 km s¹1) does not correspond closely to the projected LIC velocity, and although it is close to the expected G-cloud velocity, the latter cloud is not expected to be present at this galactic
[image:4.596.94.508.51.568.2]Ca
ions in the local interstellar medium
1183
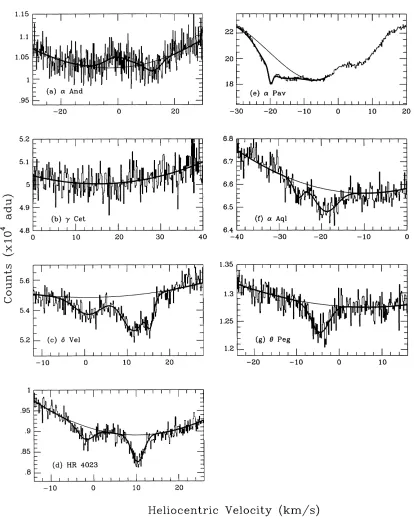
Figure 1.The interstellar Ca K lines observed with the UHRF. The observed data are plotted as histograms, and the best-fitting theoretical line profiles (Table 2)
are shown superimposed. The smooth curves indicate the adopted fits to the broad stellar photospheric lines. The shallow peak in the centre of theaAnd stellar
line (a) is interpreted as chromospheric emission, and the complicated stellar profile foraPav (e) arises from the fact that this star is a double-lined spectroscopic binary.
longitude. Moreover, we obtain a very large b value for this line (3:661:1 km s
¹1
), which, in the absence of significant turbulence, corresponds to an implausibly high temperature of 32:06
18:6×10
3
K. However, we point out that the signal-to-noise (S/N) ratio of our present observations is such that we cannot exclude the possibility that the apparently single interstellar com-ponent towards a And is in fact an unresolved blend. Indeed, additional line profile modelling (Fig. 2a) indicates that the observed absorption feature is consistent with a component at the LIC velocity (b<2:0 km s
¹1
; N<6×109cm¹2) blended with a similar, but somewhat broader (b<3:0 km s
¹1
) and stronger (N<1:5×10
10
cm¹2) component at vhelio<þ14 km s¹ 1
. The b value and column density of the presumed LIC component would then be consistent with values derived for the LIC towards other stars. Of course, this argument would imply the presence of at least one additional local cloud along the 30-pc line of sight to
aAnd.
3.2 gCet
gCet was observed because, likeaAnd andvPeg (see below), it lies in a direction where only LIC absorption is expected (Table 1).
In the event, no Caiiabsorption was detected, either at the LIC or
any other velocity within our wavelength coverage (Fig. 1b; Table 2). However, we note that the limit placed on the LIC Caii
column density in this direction (N&3:6×10
9
cm¹2) is consistent with similar upper limits obtained for a number of other low column density LIC sightlines [e.g.aCen (N&5×109cm¹2, Crawford 1994); a Eri (N&3×109 cm¹2, Paper I);g Oph (N&8×109 cm¹2, Paper II), andgAqr (N¼8þ¹23×10
9
cm¹2, Paper II).
3.3 dVel
Interstellar Ca K lines towards d Vel were first reported by Lallement, Vidal-Madjar & Ferlet (1986), who employed a resolv-ing power of R¼105 (3 km s¹1 FWHM) and detected three components with heliocentric velocities of +2.5, +7.7 and +13.3 km s¹1(their fig. 1b and table 3). By comparing their spectrum with the new UHRF data, it is clear that we have here resolved Lallement et al.’s +13.3 km s¹1component into two components (at +11.8 and +15.6 km s¹1; Table 2 and Fig. 1c). Lallement et al.’s +2.5 km s¹1 component clearly corresponds to the one we detect at +1.3 km s¹1 (Table 2). However, we find no convincing evidence in our data for the component identified at +7.7 km s¹1by Lallement et al.; in our
1184
I. A. Crawford, R. Lallement and B. Y. Welsh
[image:5.596.92.507.54.461.2]q1998 RAS, MNRAS 300, 1181–1188
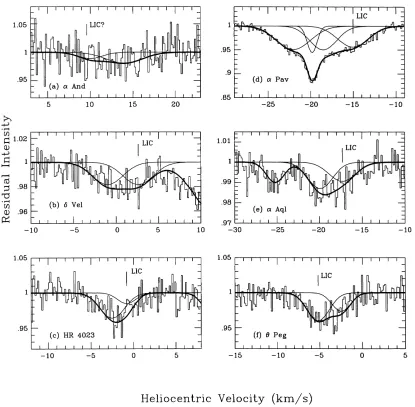
Figure 2.Additional line profile models to illustrate that, for all stars where broad interstellar Ca K components were detected (Table 2), the observed line profiles are consistent with an LIC-like component blended with one or more similar components. See text for details.
spectrum, absorption at this velocity is well-modelled by the blue wing of the +11.8 km s¹1component (cf. Fig. 1c).
In this context it may be relevant thatdVel was identified as a ‘Vega-like’ star (i.e. a main-sequence star with an infrared excess resulting from circumstellar dust) by both Cote´ (1987) and Walker & Wolstencroft (1988). Other Vega-like stars, most notably b
Pictoris (e.g. Lagrange-Henri et al. 1992), are known to exhibit variable circumstellar absorption lines. Thus it may be that the +7.7 km s¹1 component identified by Lallement et al. (1986) was a transient circumstellar absorption event. Additional observations will be required to explore this possibility further.
The +1.3 km s¹1component can plausibly be identified with the LIC on velocity grounds (Table 1). However, the b value (4:260:5
km s¹1) is probably unrealistically large for a single cloud in the local interstellar medium, and it is likely that unresolved blends are still present. One possibility is that the LIC is blended with the G cloud, although, as these are expected to have very similar projected velocities (Table 1), this is unlikely to account fully for the observed width of this component. It is easy to show (Fig. 2b) that the observed profile of the +1.3 km s¹1 feature towards d Vel is consistent with an LIC component [vhelio<þ2:6 km s
¹1
; b<2:5
km s¹1; log Nðcm¹2Þ<10:10] blended with a very similar
com-ponent (having essentially identical b and N values) at vhelio<¹1:0
km s¹1. If this interpretation is correct it further illustrates the complexity of the LISM, with no less than four discrete clouds (including the LIC) present over the 24-pc path length todVel.
Perhaps the most interesting of the present results fordVel is the detection of a narrow (b¼1:160:3 km s
¹1
) component at
vhelio¼ þ15:6 km s
¹1
. The corresponding temperature upper limit of 300061600 K (Table 2) is significantly less than is generally found in the local interstellar medium (Tk<7000 K).
As we show below (Section 3.5),aPav also exhibits an anoma-lously narrow interstellar Ca K line, and we discuss the implications of these observations in Section 4.2.
3.4 HR 4023
Interstellar Ca K lines towards HR 4023 were observed by Bertin et al. (1993) at a resolving power of R¼105. They detected two discrete absorption components, at vhelio¼ ¹4:561:5 and
þ9:361:5 km s
¹1
(cf. their fig. 3 and table 1), which clearly correspond to the¹1:7 and +10.5 km s
¹1
components detected here (Fig. 1d; Table 2). HR 4023 lies in a direction where both the LIC and G clouds might be expected, and it is interesting that the
¹1:7 km s
¹1
component falls between the projected velocities of both clouds (Table 1). Although the velocity dispersion of the
¹1:7 km s
¹1
component (b¼2:560:3 km s
¹1
) is only marginally higher than would be expected for the LIC (b<2:2 km s
¹1
; Section 1), it is nevertheless of interest to determine whether the observed profile of this component is consistent with an LIC/G cloud blend.
Additional line profile modelling (Fig. 2c) was performed to test this possibility. It was found that, within the limits imposed by the S/N ratio of the data, it is possible to model the¹1:7 km s
¹1
component with an LIC-like component [vhelio<¹0:8 km s
¹1
; b< 1:5 km s
¹1
; log Nðcm¹2Þ<9:80] and a second component
described by vhelio<¹2:5 km s
¹1
; b<2:0 km s
¹1
; log Nðcm¹2Þ<10:30. This latter component lies within
0.5 km s¹1of the expected G cloud velocity, and may plausibly be identified with it. Thus this component is a possible example of an LIC/G cloud blend, although as two discrete components have not been resolved this interpretation is not unique (the profile would
be equally consistent with the presence of a velocity gradient through the LIC towards HR 4023).
3.5 aPav
Welsh et al. (1997) searched for interstellar CaiitowardsaPav at a resolving power of 67 000, but only recorded an equivalent width upper limit of 2.3 mA˚ . Given the relatively large distance of 56 pc (Table 1), this non-detection was rather surprising, and the star was included in our list of UHRF targets in the hope of detecting weak LISM components that had been missed in previous work owing to a lack of spectral resolution. The star is a double-lined spectro-scopic binary, and the complex stellar line profiles that result makes defining the local continuum for interstellar lines particularly difficult. The UHRF spectrum is shown in Fig. 1(e), where we interpret most of the broad structure as resulting from the blending of the two stellar Ca K lines. Nevertheless, relative to our best estimate of the blue wing of the stellar line profile (smooth curve in Fig. 1e), additional absorption is present, which we attribute to interstellar material. It seems clear that there are at least two discrete interstellar components present towardsaPav, one very broad (b<5:6 km s
¹1
) and the other very narrow (b<0:8 km s
¹1
; Table 2). We will discuss these two components separately below.
3.5.1 The narrow component
The detection of such a narrow component in the LISM is particu-larly surprising. The kinetic temperature upper limit, Tkul,
corre-sponding to b¼0:860:1 km s
¹1
is only 14006300 K (Table 2), which is far below the temperature of Tk<7000 K expected for
clouds within the LISM. Moreover, this cloud must be significantly less turbulent than the LIC, as the upper limit to vt(obtained by
assuming Tk¼0) is only 0:660:1 km s
¹1
. Given that turbulence must be present to some extent, the actual values of both Tkand vt
must lie somewhere below these rigorous upper limits.
In an attempt to constrain the properties of this cloud further, observations of the NaiD lines were performed at the European
Southern Observatory (Section 2). The region of the Na D2line is
shown in Fig. 3. It is apparent that a narrow interstellar Nailine is
clearly present, superimposed on the stellar Ciil5889.78 line (note that this line is much stronger than the stellar Na D2line in early B
stars; e.g. Crawford 1990). In order to define the local continuum for the weak interstellar D2line, the stellar Ciilines were fitted by two
Gaussians (smooth curves in Fig. 3). Relative to this local
[image:6.596.321.537.552.676.2]Ca
ions in the local interstellar medium
1185
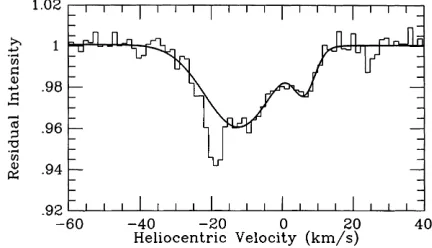
Figure 3.The interstellar NaiD2line towardsaPav observed from ESO
(R¼80 000). Note the narrow interstellar D2 line superimposed on the
photospheric Ciil5889.79 line. The smooth curve is a two-component
Gaussian fit to the stellar lines, and defines the local continuum for the interstellar line.
continuum, the interstellar D2 line has an equivalent width of
Wl¼2:860:2 mA˚ , and a heliocentric radial velocity of
vhelio¼ ¹19:460:2 km s
¹1
(all 1jerrors). We note that, within the errors, the velocity of the interstellar D2line agrees exactly with
that of the narrow Ca K line (Fig. 1e; Table 2).
The D2equivalent width corresponds to a Naicolumn density of
1:4660:23×10
10
cm¹2. When combined with the Caiicolumn
density of this component (Table 2), this yields a Nai/Caiicolumn density ratio of 1:260:2. This is a large ratio for the low-density
clouds within the Local Bubble, for which Bertin et al. (1993) found an average value of 0.22 (with an upper limit of 0.2 for the LIC itself). It is well known that the Nai/Caiiratio is a good indicator of
cloud density, owing to the strong density dependence of Ca depletion (e.g. Barlow 1978; Phillips, Pettini & Gondhalekar 1984; Crawford 1992, and references therein). The relatively large Nai/Caii ratio of this component therefore implies an
origin in significantly denser gas than is typical for the LISM, which is consistent with the anomalously narrow linewidth, and correspondingly low temperature, noted above.
3.5.2 The broad component
The width of the broad (b<5:6 km s
¹1
) component present in the spectrum ofaPav corresponds to an implausibly high temperature for the LISM (Tkul¼75 000 K; Table 2). Thus, as for most of the
other sightlines discussed in this paper, it appears most likely that this large b value results from a number of unresolved components blended together. As we expect the LIC to be present towards this star (Table 1), it is of interest to determine whether or not the broad feature is consistent with a LIC component blended with others.
Additional line profile modelling was therefore performed (Fig. 2d). It was found that the observed profile will accommodate an LIC-like component [vhelio<¹15:0 km s
¹1
; b<2:5 km s
¹1
; log Nðcm¹2Þ<10:48], but that two other similar components
[vhelio<¹22:0 km s
¹1
; b<2:8 km s
¹1
; log Nðcm¹2Þ<10:58
and vhelio<¹18:5:0 km s
¹1
; b<2:2km s
¹1
; log Nðcm¹2Þ<
10:48] are required in addition to the narrow component discussed
above. Note that although the G cloud is also expected to be present towards this star, the velocities of the LIC and G clouds differ by only 0.3 km s¹1 (Table 1), making it impossible to determine whether both clouds are in fact present within the feature labelled ‘LIC’ in Fig. 2(d). We merely note that, if we assume the LIC to be present, then at least two other clouds with similar properties are present along the 56-pc line of sight toaPav, in addition to the much cooler cloud discussed in Section 3.5.1.
3.6 aAql
A high-resolution (R¼105), high S/N ratio, spectrum of the interstellar Ca K line lowards a Aql was obtained by Ferlet, Lallement & Vidal-Madjar (1986; see also Lallement et al. 1986). The total equivalent width obtained by Lallement et al. (1986) was 1.7 mA˚ (cf. their table 1), which is essentially identical to the value of 1:7860:14 mA˚ obtained here (Table 1).
The earlier observations clearly showed evidence of at least two velocity components towards a Aql (at vhelio<¹26 and ¹20
km s¹1). Moreover, based on a careful analysis of the line profile, Ferlet et al. (1986) argued convincingly that the stronger of these components (at¹20 km s¹1) is probably an unresolved blend. Thus, they argued for a minimum of three discrete velocity components along the very short (5-pc) line of sight to the star. This conclusion is supported by HST–GHRS observations of interstellar Feii and
Mgii(Lallement et al. 1995) which are also most easily interpreted
in terms of three discrete velocity components.
Given this evidence for three velocity components towards a
Aql, we had expected that the higher resolution UHRF data would have resolved these directly. However, as is clear from Fig. 1(f), within the limits of the S/N ratio of the present data, we have not resolved the main (¹18:7 km s
¹1
) component into the two sub-components inferred from the earlier observations. However, it is true that the very large b value (3.6 km s¹1) obtained for this component implies an implausibly high kinetic temperature for the absorbing material (Table 2), and the most straightforward explana-tion is that unresolved velocity structure is present.
Additional line profile modelling (Fig. 2e) indicates that the observed¹18:7 km s
¹1
component is indeed consistent with the presence of two subcomponents, one of which lies at the anticipated LIC velocity of¹17:3 km s
¹1
. We note that the fact that these two hypothesised components are blended, even at a resolving power of
R<9×10⁵, places a lower limit of b*1:5 km s
¹1
(Tkul*5400 K)
on the velocity dispersions, because otherwise we would have resolved them easily. The fit shown in Fig. 2(e) consists of components having the following parameters: vhelio¼ ¹19:9
km s¹1, b¼2:060:4 km s
¹1
, log Nðcm¹2Þ ¼9:85 and vhelio¼
¹17:3 km s
¹1
, b¼2:260:4 km s
¹1
, log Nðcm¹2Þ ¼9:75. We note
that both of these components have b values (<2 km s¹1) consistent with the temperature and turbulence expected for the local inter-stellar clouds (cf. Section 1).
3.7 vPeg
A search was made for the interstellar Na D lines towardsvPeg by Welsh et al. (1994), but they only recorded an upper limit of 1 mA˚ for the D1line. Here we have clearly detected an interstellar Ca K
component with a heliocentric velocity (¹4:2 km s
¹1
), within 1 km s¹1of that expected for the LIC along this line of sight (cf. Table 1). However, as for the other stars discussed in this paper, the observed velocity dispersion (b¼2:8360:29 km s
¹1
) is some-what broader than would be expected for a cloud with the physical conditions expected for the LIC. Therefore, for this star also, there remains the possibility that the LIC component is blended with that of another nearby cloud to produce the observed absorption line.
Additional line profile modelling (Fig. 2f) indicates that it is possible to explain the observed profile in terms of an unresolved blend of two clouds, of which one is at (or very near) the expected LIC velocity. Specifically, we find that the profile can be well fitted by an LIC component [vhelio<¹5:2 km s
¹1
; b<1:8 km s
¹1
; log Nðcm¹2Þ<10:30] with a second component described by
similar parameters [vhelio<¹2:5 km s
¹1
; b<1:5 km s
¹1
; log Nðcm¹2Þ<10:04].
4 D I S C U S S I O N
In this section we elaborate on two aspects of the present results which have a bearing on the structure of the local interstellar medium: the nature of the broad (b*3 km s¹1) components and their relation to the LIC and G clouds, and the implications of the very narrow (b&1 km s¹1) components detected towards two stars.
4.1 The broad LISM components
Most of the stars observed here were found to exhibit fairly broad (b*3 km s¹1) components (Table 2). The detection of so many broad components was surprising, as the observed b values imply
1186
I. A. Crawford, R. Lallement and B. Y. Welsh
q1998 RAS, MNRAS 300, 1181–1188
implausibly high kinetic temperatures and turbulent velocities. However, in every case we have been able to show that the line profiles of these components are consistent with an LIC component blended with one or more clouds having similar physical conditions (Fig. 2). Of course, this interpretation would significantly increase the number of individual discrete clouds present within the Local Bubble.
Rather disappointingly, in spite of the very high spectral resolu-tion at our disposal, we have not been able to discriminate uniquely between the LIC and G clouds for those sightlines (in the general direction of the Galactic Centre) where both clouds might be expected. This is because the small velocity difference (generally
&1 km s¹1; Table 2) and the relatively broad linewidths (b<2 km s¹1) expected for both clouds make blending of the line profiles inevitable. Thus, although in most cases we have been able to show that the observed line profiles are consistent with the presence of a G cloud component blended with that of the LIC, we have not been able demonstrate the separate existence of the latter cloud as a discrete entity.
4.2 The narrow LISM components
In the present work we have identified two stars,dVel andaPav, with interstellar components having much smaller b values (1:160:3 and 0:860:1 km s
¹1
, respectively) than expected for low-density clouds within the Local Bubble. In the case of theaPav component (Section 3.5.1) we also find an anomalously large Nai/ Caii column density ratio, which we take to be indicative of a
relatively high spatial density.
Only very high resolution spectroscopy, such as is achievable with the UHRF, is able to detect lines that are simultaneously very weak (Wl&1 mA˚ ) and very narrow (b&1 km s¹1). Thus, there is a
possibility that earlier, lower resolution surveys may have missed a population of cool, relatively dense, but low column density, clouds (or cloud cores) within the Local Bubble. However, as such cool clouds are not expected to be stable within this environment, it is important to determine whether they actually lie within the confines of the Local Bubble itself, or are associated with denser gas at its boundary. In fact,aPav (l¼3418, D¼56 pc) lies in a direction, and at a distance, such that the line of sight may have traversed the Local Bubble and crossed the boundary of the neighbouring Sco– Cen Bubble. The Sco–Cen Bubble is known to be surrounded by an Hishell which may approach to within 50 pc of the Sun in this direction, and is known to be thicker at negative galactic latitudes (e.g. Cox & Reynolds 1987; de Geus 1991, and references therein). Thus it is possible that the narrow absorption component towardsa
Pav is associated with this structure, and does not arise within the Local Bubble. However, we note that as the column density of this component is much smaller than usually found for stars beyond the Local Bubble, this interpretation may require the star to be actually located within the Sco–Cen shell. Observations of stars close toa
Pav on the sky, but at a range of distances, will be required to test this possibility.
It is more difficult to explain the anomalously narrow component towardsdVel (l¼2728, D¼24 pc), as this star lies well within the confines of the Local Bubble. Indeed, it is difficult to avoid the conclusion that the present observations imply the presence of a relatively cool (Tk<4600 K) and quiescent (vt<0:8 km s
¹1
) cloud within the Local Bubble (although, for the reasons discussed in Section 3.3, we cannot completely rule out the possibility that this component is circumstellar). It would be of considerable interest to obtain a Naispectrum of this component, in order to determine
whether, like the narrowaPav component, it too has a large Nai/
Caiiratio. Clearly, if the presence of a cool, relatively dense, cloud
towardsdVel can be demonstrated, it would re-open the question of the physical location of the narrowaPav component, and thus the possibility that a significant population of such clouds exists within the Local Bubble.
5 C O N C L U S I O N S
We have used the Ultra-High-Resolution Facility (UHRF) to study the interstellar Ca K lines towards seven nearby stars. The spectral resolution (0.35 km s¹1 FWHM) has enabled us to resolve the intrinsic line profiles fully. This has allowed us to detect previously unresolved velocity components, and to obtain accurate measure-ments of the velocity dispersions (b values) of clouds within the LISM. Our main conclusions are as follows.
(i) Weak interstellar Ca K lines were detected towards all but one star (gCet). However, the column density upper limit obtained forg
Cet (3:6×10
9
cm¹2) is probably still consistent with the presence of the LIC in this direction, although it is noteworthy that there appear to be no other clouds along the 24-pc line of sight.
(ii) Most of the stars were found to exhibit fairly broad (b*3 km s¹1) components, which at first sight seem to imply implausibly high kinetic temperatures and turbulent velocities. However, in every case we have been able to show that the line profiles of these components are consistent with a LIC-like component, blended with one or more other components having similar physical condi-tions (Fig. 2).
(iii) We have not been able to discriminate uniquely between the LIC and G clouds for those sightlines where both clouds might have been expected. Thus, although in general the observed line profiles are consistent with the presence of both clouds, we have not been able to demonstrate the existence of the G cloud as a separate entity. (iv) Two stars (dVel andaPav) were found to exhibit compo-nents with much smaller b values (1:160:3 and 0:860:1 km s
¹1
, respectively) than is expected for low-density clouds within the Local Bubble. In the case of the narrowaPav component we also find an anomalously large Nai/Caiicolumn density ratio, which we
take to be indicative of a relatively high density. It is important to constrain the physical locations of these clouds further in order to determine whether the Local Bubble contains a population of cooler and denser clouds that have been missed by lower resolution surveys.
A C K N O W L E D G M E N T S
We are grateful to PATT for the award of telescope time. IAC thanks PPARC for financial support.
R E F E R E N C E S
Barlow M. J., 1978, MNRAS, 183, 417
Bertin P., Lallement R., Ferlet R., Vidal-Madjar A., 1993, A&A, 278, 549 Cote´ J., 1987, A&A, 181, 77
Cox D. P., Reynolds R. J., 1987, ARA&A, 25, 303 Crawford I. A., 1990, Observatory, 110, 145 Crawford I. A., 1992, MNRAS, 259, 47 Crawford I. A., 1994, Observatory, 114, 288
Crawford I. A., Dunkin S. K., 1995, MNRAS, 273, 219 (Paper I) Crawford I. A., Craig N., Welsh B. Y., 1997, A&A, 317, 889 (Paper II) de Geus E. J., 1991, A&A, 262, 258
Diego F., 1993, Appl. Opt., 32, 6284
Ca
ions in the local interstellar medium
1187
Diego F. et al., 1995, MNRAS, 272, 323
ESA, 1997, The Hipparcos and Tycho Catalogues, ESA SP-1200 Ferlet R., Lallement R., Vidal-Madjar A., 1986, A&A, 163, 204 Frisch P. C., 1995, Space Sci. Rev., 72, 499
Lagrange-Henri A. M., Gosset E., Beust H., Ferlet R., Vidal-Madjar A., 1992, A&A, 264, 637
Lallement R., Bertin P., 1992, A&A, 266, 479
Lallement R., Vidal-Madjar A., Ferlet R., 1986, A&A, 168, 225
Lallement R., Ferlet R., Lagrange A. M., Lemoine M., Vidal-Madjar A., 1995, A&A, 304, 461
Linsky J. L., Diplas A., Wood B. E., Brown A., Ayres T. R., Savage B. D., 1995, ApJ, 451, 335
Morton D. C., 1991, ApJS, 77, 119
Phillips A. P., Pettini M., Gondhalekar P. M., 1984, MNRAS, 206, 337 Vallerga J. V., Vedder P. W., Craig N., Welsh B. Y., 1993, ApJ, 411, 729 von Steiger R., Lallement R., Lee M. A., eds, 1996, The Heliosphere in the
Local Interstellar Medium. Kluwer, Dordrecht Walker H. J., Wolstencroft R. D., 1988, PASP, 100, 1509
Welsh B. Y., Craig N., Vedder P. W., Vallerga J. V., 1994, ApJ, 437, 638 Welsh B. Y., Sasseen T., Craig N., Jelinsky S., Albert C. E., 1997, ApJS, 112,
507
This paper has been typeset from a TEX=L
A
TEX file prepared by the author.
1188
I. A. Crawford, R. Lallement and B. Y. Welsh
q1998 RAS, MNRAS 300, 1181–1188