IJPSR (2014), Vol. 5, Issue 12 (Research Article)
Received on 05 May, 2014; received in revised form, 27 June, 2014; accepted, 14 August, 2014; published 01 December, 2014
DEVELOPMENT AND EVALUATION OF BILAYER FLOATING DOSAGE FORM OF CARBIDOPA AND LEVODOPA FOR TREATMENT OF PARKINSON’S DISEASE
Dasharath M. Patel* and Pratik R. Gajjar
Department of Pharmaceutics and Pharmaceutical Technology, Shri Sarvajanik Pharmacy College, Mehsana-384001, Gujarat,India.
ABSTRACT: The combination of Levodopa and Carbidopa is widely prescribed for Parkinson's disease. Levodopa easily crosses the blood-brain barrier and presumably converted to dopamine in the brain. Carbidopa inhibits decarboxylation of peripheral Levodopa but not of Levodopa within the central nervous system as it does not cross the blood-brain barrier. The purpose of present work was to develop bilayer floating dosage form of Carbidopa and Levodopa to improve the delivery of the drug at optimal absorption site and to reduce the frequency of administration with improved patient compliance. Bilayer floating tablet were prepared by using Kollidon SR and hydroxypropyl methylcellulose (HPMC K15M) as matrixing agents and sodium bicarbonate as gas generating agent. The IR spectral studies and DSC thermogram showed no interaction between drug and other additives. Experimental design was used for optimizing the ratio of Kollidon SR: HPMC K15 (X1) and concentration of binder (X2). The optimized formulation (batch F3) showed zero order drug release with Non-Fickian or anomalous diffusion. The optimized formulation showed similarity in dissolution with theoretical profile (f2 value for Levodopa is 85.01 and for Carbidopa is 81.94). The floating lag time was 42 second and the tablet remained floatable for more than 24 h. The stability study of optimized formulation for 1 month showed no appreciable change in drug content, in vitro drug release and floating lag time.
INTRODUCTION: Parkinson’s disease, being the
second most common progressive neurodegenerative disorder affecting more than 4 million people worldwide is a leading cause of neurologic disability. Its prevalence reaches 1–2% in people over the age of 50 and about 60,000 new cases are reported annually, because the average age of the population continues to increase, it is estimated that the frequency of PD will have increased 4-fold by 2040. It has a world-wide distribution and has no gender preference.1
QUICK RESPONSE CODE
DOI:
10.13040/IJPSR.0975-8232.5(12).5301-14
Article can be accessed online on:
www.ijpsr.com
DOI link: http://dx.doi.org/10.13040/IJPSR.0975-8232.5(12).5301-14
Parkinson’s disease is characterized by a variety of basic symptoms including, for example, tremor, muscle rigidity, bradykinesia (and in extreme cases akinesia), and postural instability. The most apparent and well-known symptom, Parkinson’s tremor, is a dyskinetic condition typically presenting as an impaired ability to control movement, The reduced dopamine content in the brain of patients with Parkinson’s disease is considered a primary clinical cause of Parkinson’s symptoms.2
According to National Parkinson Foundation forty years after it was first introduced, Levodopa is still the most effective medication available for the treatment of the motor symptoms.3 Levodopa crosses the blood brain barrier and is rapidly converted to dopamine, thereby alleviating the symptoms of Parkinson's disease caused by reduced Keywords:
Bilayer floating tablet, Levodopa, Carbidopa, Experimental design,
Parkinson’s
Correspondence to Author: Dasharath M. Patel
Professor & Head, Department of Pharmaceutics and Pharmaceutical Technology, Shri Sarvajanik
Pharmacy College, Mehsana-384001, Gujarat, India.
levels of dopamine. However, treatment with levodopa is problematic because of its rapid decarboxylation by tissues other than the brain. Carbidopa inhibits the decarboxylation of levodopa by a patient's body tissues outside of the brain. Small doses of Carbidopa administered in conjunction with levodopa allow larger, effective amounts of levodopa to reach the brain and be converted to dopamine. A combination therapy of Carbidopa and Levodopa facilitates the administration of smaller doses of Levodopa, which can provide a concominant reduction of any side effects.4
The use of conventional tablets alone is problematic as it requires more frequent dosing and associated with more fluctuating plasma levodopa concentrations. However, the use of controlled release dosage forms are problematic in that many patients with Parkinson’s disease wake up in the morning having little or no mobility because the previous dose taken the day or evening before has worn off. Once the previous dose has worn off, such patients are usually unwilling or unable to wait for the extended period of time required for a controlled release dosage form to deliver the appropriate plasma levels of levodopa.4 Levodopa and Carbidopa is available as conventional tablets (Sinemet) as well as control release tablets (Sinemet CR).The control release product in market i.e. Sinemet CR shows delayed onset of effect for upto 1 hour.5 Major limitation of control release dosage form is non site specific delivery. Therefore, it is necessary to enhance the effect of Levodopa and Carbidopa to obtain faster onset of action, to reduce the dose frequency, to minimize the variability in absorption and to reduce the side effects.
Thus a novel approach is required to design and develop a bilayer floating tablet comprising of immediate release and sustain release floating layer containing Carbidopa and Levodopa. With the immediate release the problem of delayed onset of action will overcome and with the sustain release floating layer will prolong controlled delivery of Levodopa to upper small intestine which is the optimal site for absorption will ultimately increase the bioavailability. About 50% of patients will develop fluctuations in responses (dyskinesia) in first five years of Levodopa therapy associated with
the end of dose effect and on-off phenomenon.6 This problem can be managed by making a provision of sustain release form in tablet and by making a sustain release form the variation observed in plasma Levodopa level is less than that of observed with conventional formulations. These dosage devices offer many advantages like rapid release profile along with the sustain effect, reduce the frequency of administration, improve the site specific delivery and improved patient compliance and convenience.
In the present research work an attempt was made to formulate and evaluate bilayer floating tablet of Levodopa and Carbidopa using different ratio of polymers and design of experiment (DOE) approach for optimization.
MATERIALS AND METHODS: Materials
Carbidopa and Levodopa were purchased from Divi’s Laboratories Ltd, Hyderabad, India. Different grades of Hydroxypropyl methylcellulose (HPMC) like HPMC K15M, HPMC K4M, MCC, PVP K-30, Cross Povidone, Talc, Magnesium stearate and sodium 1-decane sulphonate were supplied by Yarrow Chem. Products, Mumbai, India. Different HPLC grades of O-Phosphoric acid, Methanol, Acetonitrile and Water were procured from RFCL Ltd, New Delhi, India. All other materials used were of pharmaceutical or analytical grade.
Drug-Excipients Compatibility Study
Analytical Method Development
Chromatographic separation of Levodopa and Carbidopa was performed on a Shimadzu HPLC System (Japan) equipped with UV-Visible detector using C18 column (ACE 150 x 4.6mmm I.D., 5μ particle size). The mobile phase used was 11.04 g Monobasic Sodium phosphate+1.3ml Sodium 1-decane sulphonate solution in 1000 ml water adjust to pH 2.8 with o-phosphoric acid. Standard solution and dissolution samples were analyzed at 280 nm using a UV detector. The mobile phase was pumped at a flow rate of 1.0 ml/min with an injector valve fitted to a 20 μl volume sample loop. Record the chromatograms and measure the peaks responses. For the assay same conditions are followed as like dissolution.
Preparation of Sustain Release Floating Tablets
Tablets of Carbidopa and Levodopa with other excipients were prepared by direct compression. To make powder mixtures, the drug and polymer were thoroughly passed through 80# sieve. This powder mixture was then lubricated with magnesium stearate and talc then compressed into tablets in 12 mm rotary tablet punching machine. The force of compression was adjusted so that hardness of all the prepared tablets ranges from 3-4.5 kg/cm2. These tablets were further subjected to various evaluation tests.
Preliminary Screening
For the selection of polymer type and its quantity, preliminary batches were formulated using Kollidon SR as a polymer shown in Table 1. TABLE 1: COMPOSITION OF BATCHES FOR POLYMER SCREENING
Ingredients Quantity in mg/tablet
A1 A2 A3
Levodopa 200 200 200
Carbidopa 50 50 50
Kollidon SR 150 200 250
Talc 10 10 10
Magnesium stearate 5 5 5
Total 415 465 515
All formulations containing different concentration of Kollidon SR polymer gave floating lag time more than 3 hours which is not useful for the present study. So, HPMC K4M and HPMC K15M along with Kollidon SR was selected with the provision of Effervescent approach for further studies.
TABLE 2: COMPOSITION OF BATCHES FOR SELECTION OF CONCENTRATION OF HPMC K15M WITH KOLLIDON SR
Ingredients Quantity in mg/tablet
B1 B2
Levodopa 200 200
Carbidopa 50 50
HPMC K-15M 100 150
Kollidon SR 100 50
Sodium Bicarbonate 45(10%) 45(10%)
Talc 10 10
Magnesium stearate 5 5
Total 510 510
TABLE 3: EVALUATION RESULTS FOR SELECTION OF CONCENTRATION OF HPMC K15M WITH KOLLIDON SR
Batch Floating Lag time Total floating time
B1 12min <12 hr and tablets were broken
B2 20 Sec
>12hr and tablets were intact and floating
TABLE 4: COMPOSITION OF BATCHES FOR
OPTIMIZATION OF GRADES AND
CONCENTRATION OF HPMC WITH KOLLIDON SR
Ingredients Quantity in mg/tablet
C1 C2 C3 C4
Levodopa 200 200 200 200
Carbidopa 50 50 50 50
HPMC K-15M
150
(75%) 140 (70%) - -
HPMC K-4M - - 150
(75%)
140 (70%)
Kollidon SR 50 (25%) 60 (30%) 50 (25%) 60 (30%)
Sodium
Bicarbonate 45(10%) 45(10%) 45(10%) 45(10%)
Talc 10 10 10 10
Magnesium
stearate 5 5 5 5
Total 510 510 510 510
TABLE 5: EVALUATION RESULTS FOR OPTIMIZATION OF GRADES AND CONCENTRATION OF HPMC WITH KOLLIDON SR
Batch Code
Floating Lag time(sec)
Hardness (kg/cm2) n=3
Thickness (mm) n=3
Friability (%)n=20
Avg. Wt. (mg) n=20
Drug
content(%)n=3
C1 8 4 ±0.07 3.5±0.07 0.52 506.43±0.4 96.50 ±1.21
C2 9.8 3.8 ±0.26 3.6±0.01 0.48 509.74±0.7 98.01 ±0.64
C3 18 4.3 ±0.96 3.52±0.08 0.43 506.32±0.2 98.8 ±0.34
C4 15 4.1 ±0.40 3.55±0.02 0.54 510.45±0.5 97.55 ±1.02
[image:3.612.55.556.669.734.2]TABLE 6: IN VITRO DISSOLUTION STUDY OF BATCHES C1 TO C4
Time (hr)
CPR (%)
C1 C2 C3 C4
LD CD LD CD LD CD LD CD
0 0 0 0 0 0 0 0 0
0.25 4.7 3.34 8.35 5.79 5.9 4.81 7.46 5.82
0.5 7.3 6.52 10.26 8.3 7.8 6 10.74 9.4
1 11.39 10.13 14.75 11.19 12 10.14 13.27 11.25 2 21.71 17.12 22.22 18.73 23.13 19.08 22.68 20.54
3 30 25 33.09 35.69 31.45 28.2 37.03 34.8
4 41.11 37.71 40 34.76 38.6 35.81 44.41 41.76
5 45.22 42.29 47.44 49.42 44.04 40.17 51.68 49.31
6 52.54 48.62 53.55 57 58 55.87 56.78 59.6
LD: Levodopa, CD: Carbidopa
Optimization of Sustain Release Floating Tablets Using 32 Full Factorial Design
From the results of preliminary screening studies, the optimization was carried out using design of expert (DOE) approach. To study the effect of 2 independent variables i.e. ratio of Kollidon SR: HPMC K15 (X1) and concentration of binder (X2) on responses 32 full factorial design was used. In this design drug release at 15 min (Q15) Levodopa, drug release at 15 min (Q15) Carbidopa and
floating lag time were selected as response variables. Trials were taken at all possible combinations. The detailed layout of factorial batches is shown in Table 7. The equations relating independent variables and responses were obtained by subjecting the results to statistical evaluation. Design Expert 9.0.0.7 was used to perform multiple linear regressions to determine the control factors that significantly affect the responses.
TABLE 7: DETAILED LAYOUT OF DIFFERENT FACTORIAL BATCHES
Ingredients
(mg/tablet) F1 F2 F3 F4 F5 F6 F7 F8 F9
Levodopa 200 200 200 200 200 200 200 200 200
Carbidopa 50 50 50 50 50 50 50 50 50
Kollidon SR 30 30 30 40 40 40 50 50 50
HPMC K15M 170 170 170 160 160 160 150 150 150
NaHCO3 45 45 45 45 45 45 45 45 45
PVP K30 - 12 25 - 12 25 - 12 25
MCC Q.s 25 13 - 25 13 - 25 13 -
Talc 10 10 10 10 10 10 10 10 10
Mg Stearate 5 5 5 5 5 5 5 5 5
Total Wt. 535 535 535 535 535 535 535 535 535
Independent Variable Coded Value Actual Value
Ratio of Kollidon SR:HPMC
K15M -1 0 +1
0.18 (85:15)
0.25 (80:20)
0.33 (75:25) Concentration of Binder PVP K30
(%) -1 0 +1 0 2.5 5
Polynomial equation for 32 full factorial design: Y = b0+ b1X1+ b2X2+ b11X12+ b22X22+ b12X1X2 was used. In this equation, Y is the dependent variable, b0 is the arithmetic mean response of the 9 runs, and bi is the estimated coefficient for the factor Xi. The significant factors in the equations were selected using a stepwise forward and backward elimination for the calculation of regression analysis. The terms of full model having non- significant p value (p > 0.05) has negligible contribution hence they were neglected.
Evaluation of Sustain Release Floating Tablets
sample (20 tablets) was placed in the Roche friabilator (Electro lab, Mumbai, India) which is then operated for 100 revolutions. The tablets were dedusted and reweighed. Conventional compressed tablets that loose less than 0.5 to 1% of their weight are considered acceptable.
Hardness of tablet was determined using Pfizer hardness tester (Janki, India). In Content uniformity twenty tablets were weighed and powdered in a glass mortar. Quantity of powder equivalent to 50 mg of Levodopa was accurately weighed and transferred in a 100 ml volumetric flask, Adjust the final volume with 0.1 N HCL up to 100 ml. The solution was filtered through a 0.45 μm Millipore filter and the drug content was determined at 280 nm by HPLC. Floating Lag Time is the time interval taken by the tablets to start floating. The tablet was place in a 100 ml beaker containing 0.1N HCL. The time requires for the tablet to rise to the surface and float is determined as floating lag time.
Total Floating Time is the time for which the tablets remain floating in the media.8 In Swelling studythe floating tablets were weighed individually (designated as Wo) and placed separately in glass beaker containing 200 ml of 0.1 N HCL and incubated at 37 ± 1 °C. At regular 1 hr time intervals until 8 hr, the floating tablets were removed from beaker, and the excess surface liquid was removed carefully using the tissue paper.
The swollen floating tablets were then re-weighed (Wt), and % swelling index (SI) was calculated using the following formula SI (%) = (Wt – Wo/ Wo)*100. In vitro dissolution of Levodopa and Carbidopa from floating tablets was determined using USP dissolution testing apparatus II (paddle type) at 50 rpm. The dissolution test was performed using 900 ml of 0.1 N HCL (pH 1.2) for 12 hr at 37 ± 0.5 °C. Five ml of the sample was withdrawn at regular intervals and replaced with the same volume pre-warmed with fresh dissolution medium, filtered through a 0.45μm membrane filter and analyzed by HPLC.
Release kinetics7 was ascertained using different kinetic equations (zero-order, first-order, and Higuchi’s equation) to interpret the release rate of the drug from matrix systems. Therefore, the dissolution data were also fitted according to the
well-known exponential Korsmeyer-Peppas8
equation, which is often used to describe drug release behaviour from polymeric systems: Mt/ M8 = ktn. Mt/ M8 is the fraction of drug release at time t, and k is the kinetic constant; n is the release exponent (indicating the general operating release mechanism). n value between 0.43 and 0.5 indicates Fickian (case I) diffusion-mediated release.9 Non-Fickian (anomalous) release, coupled diffusion, and polymer matrix relaxation occurs if
0.5 < n < 0.89, purely matrix relaxation or
erosion-mediated release occurs for n= 1 (zero-order kinetics), and super case II type of release occurs for n > 0.89.10 The similarity factor (f2) given by SUPAC guidelines for a modified release dosage form was used as a basis to compare dissolution profiles. The dissolution profiles are considered to be similar when f2 is between 50 and 100.11
Preparation of Bilayer Floating Tablets
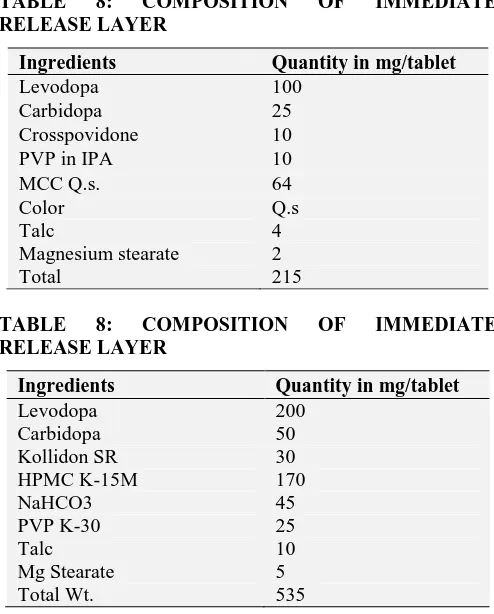
Bilayer tablets were prepared as per formulations given in Table 8 and Table 9.
TABLE 8: COMPOSITION OF IMMEDIATE RELEASE LAYER
Ingredients Quantity in mg/tablet
Levodopa 100
Carbidopa 25
Crosspovidone 10
PVP in IPA 10
MCC Q.s. 64
Color Q.s
Talc 4
Magnesium stearate 2
Total 215
TABLE 8: COMPOSITION OF IMMEDIATE RELEASE LAYER
Ingredients Quantity in mg/tablet
Levodopa 200
Carbidopa 50
Kollidon SR 30
HPMC K-15M 170
NaHCO3 45
PVP K-30 25
Talc 10
Mg Stearate 5
Total Wt. 535
For the Preparation of bilayer floating tablet the optimized F3 Formulation Batch was selected for sustain release layer.
[image:5.612.315.562.357.664.2]Isopropyl Alcohol; color quantity sufficient was added in the solution of binder. The binder was then slowly incorporated by spreading all over the powder and mixed well for 20 minutes to obtain a dough mass. The dough mass was passed through sieve No. 40 and dried in hot air oven at 600C for 15 min. The dried material was then passed through sieve No. 60. The prepared granules were then evaluated for preformulation parameters. All the granules were lubricated with talc and magnesium stearate and add cross povidone as superdisintegrant. This powder mixture was then mixes for 15 min. then die of the tableting machine was filled manually with the weighed amounts of the fast release component. Then the prepared SR tablet was put into the die then compressed to form a bilayer tablet by direct compression with flat-tip punches and dies with a 12 mm diameter.
Evaluation of Bilayer Floating Tablets
Prepared bilayer tablets were evaluated for weight variation test, drug content, hardness, thickness, in
vitro dissolution study and comparison of dissolution profiles were carried out. Stability study was conducted at accelerated condition of 75 ± 5% relative humidity and 40 ± 2 ºC temperature in the stability chamber for 1 month. After 1 month, tablets were evaluated for the drug content, hardness, friability, floating lag time and physical appearance as well as change in vitro drug release pattern.12
RESULTS AND DISCUSSION: Drug- Excipients Compatibility Study
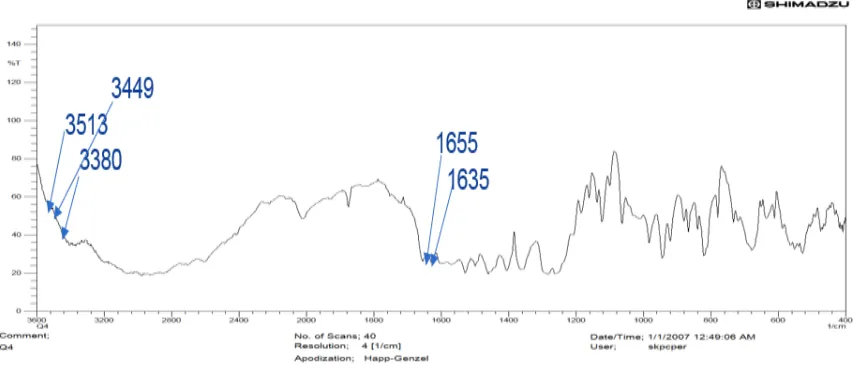
FTIR spectrums of Carbidopa, Levodopa and drugs in combination with excipients are shown in
Figure 1, Figure 2 and Figure 3 respectively. It was observed that there were no changes in main peaks in the FTIR spectra of a mixture of drugs and excipients. The FTIR study demonstrate that no physical or chemical interactions of Carbidopa and Levodopa with polymeric system.
FIGURE 1: FT-IR SPECTRA OF CARBIDOPA
FIGURE 3: FT-IR SPECTRA OF DRUGS AND EXCIPIENTS
DSC thermogram of Carbidopa, Levodopa and drug excipients mixture are shown in Figure 4, Figure 5 and Figure 6, respectively. It is evident from DSC thermograms that sharp exothermic peak of Carbidopa and sharp endothermic peak of Levodopa obtained was retained without any measure shift in composite mixture, indicating absence of any physical incompatibility of drug with excipients used in the formulation.
FIGURE 4: DSC OF CARBIDOPA
[image:7.612.103.532.57.245.2]FIGURE 5: DSC OF LEVODOPA
FIGURE 6: DSC OF DRUG AND EXCIPIENTS
Analytical Method Development
Pure drugs chromatogram was run in mobile phase,
Finally ACE C18 (150 mm 4.6 mm, 5 μm
particle size) column and 11.04 g Monobasic Sodium phosphate+1.3ml Sodium 1-decane sulphonate solution in 1000 ml water adjust to pH 2.8 with o-phosphoric acid was selected which gave a sharp and symmetrical peak with minimum
[image:7.612.314.571.268.428.2]tailing at 280 nm was shown in Figure 7.
[image:7.612.49.569.410.750.2]Preliminary Trials
Various preliminary trials were carried out to choose a suitable polymer, the percentage drug release of C1 batch after 15min was 4.7% for Levodopa and 3.34% for Carbidopa, while in C2 burst effect has been observed which contain high concentration of Kollidon SR. C3 batch containing HPMC K4M and Kollidon SR, the burst effect was higher as compared to C1 batch. Initial Burst release was decreased by decreasing amount of Kollidon SR. From the above study, it was
concluded that HPMC K15M is suitable for sustain release floating tablet of Levodopa and Carbidopa. So, HPMC K15M with Kollidon SR was selected in different ratios for further optimization using factorial design.
Evaluation of Factorial Batches F1 to F9
[image:8.612.59.552.224.342.2]The factorial batches were evaluated for various parameters by the methods described in methodology section. The evaluation results are shown in Table 10, 11 and 12.
TABLE 10: RESULTS FOR POWDER MIXTURE OF BATCH F1 TO F9
Batch Angle of repose(o) n=3
Bulk
density(g/ml) n=3
Tap density (g/ml) n=3
Hausner’s Ratio n=3
Carr’s Index (%)n=3
F1 28.55±0.6 0.416±0.012 0.465±0.08 1.11±0.01 10.53±0.12
F2 25.15±0.9 0.500±0.011 0.588±0.078 1.17±0.05 14.96±0.42
F3 21.45±1.8 0.434±0.019 0.476±0.089 1.09 ±0.08 8.82±0.89
F4 27.55±0.6 0.476±0.078 0.555±0.06 1.16±0.05 14.23±0.90
F5 22.15±0.98 0.454±0.08 0.526±0.06 1.15±0.09 6.67±0.56
F6 24.03±0.19 0.400±0.067 0.444±0.045 1.11±0.07 9.90±1.89
F7 30.57±0.16 0.434±0.08 0.526±0.087 1.14±0.08 17.49±1.78
F8 26.44±0.11 0.416±0.06 0.476±0.078 1.13±0.07 12.60±1.09
F9 21.42±0.99 0.476±0.97 0.540±0.014 1.21±0.06 11.85±0.69
[image:8.612.58.558.375.526.2]Values are mean ± S.D for 3 determinations
TABLE 11: EVALUATION PARAMETER FOR TABLETS OF BATCH F1 TO F9
Batch
Weight Variation (%)n=20
Friability (%)n=20
Hardness (kg/cm2) n=3
Drug Content (%)n=3
Floating Lag
Time(sec) n=3
LD CD
F1 530.9± 1.20 0.50 4.2± 0.27 98.67±0.21 99.21±0.43 7±2
F2 538.9± 2.62 0.43 4.1± 0.78 96.24±0.32 98.33±0.15 8.9±3
F3 539.2± 1.08 0.35 4.3± 0.59 98.65±0.43 97.23±1.2 10.06±5
F4 536.5± 2.81 0.46 4.0± 0.32 96.42±0.12 95.87±0.65 7.5±4
F5 532.1± 2.78 0.43 3.8± 0.54 96.13±0.34 95.78±0.32 9.3±2
F6 530.5± 2.41 0.48 4.3± 0.63 95.36±0.54 95.28±0.50 10.08±1
F7 539.9± 2.30 0.35 4.3± 0.95 96.07±0.21 96.56±0.56 8.5±2
F8 535.1± 2.05 0.42 4.2± 0.20 96.56±0.31 95.25±0.76 9.3±4
F9 538.9± 1.15 0.51 3.8± 0.76 96.31±0.74 95.10±0.65 11±4
[image:8.612.48.564.560.664.2]LD: Levodopa, CD: Carbidopa
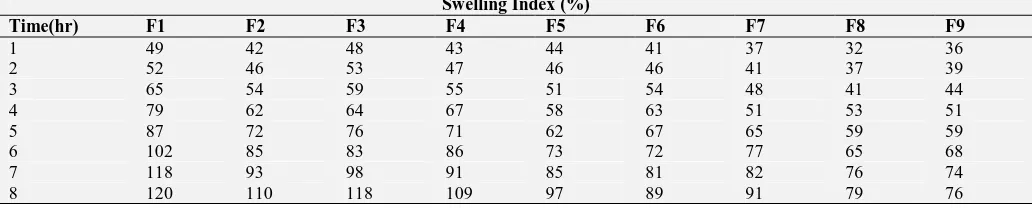
TABLE 12: SWELLING INDEX (%) FOR TABLETS OF BATCH F1 TO F9 Swelling Index (%)
Time(hr) F1 F2 F3 F4 F5 F6 F7 F8 F9
1 49 42 48 43 44 41 37 32 36
2 52 46 53 47 46 46 41 37 39
3 65 54 59 55 51 54 48 41 44
4 79 62 64 67 58 63 51 53 51
5 87 72 76 71 62 67 65 59 59
6 102 85 83 86 73 72 77 65 68
7 118 93 98 91 85 81 82 76 74
8 120 110 118 109 97 89 91 79 76
Bulk density, tapped density, Carr’s index, hausner’s ratio and angle of repose were determined. Precompression parameter shows satisfactory flow property. The average weight of the tablet was found to be between 530.5 to 539.9
formulations was found to be between 3.8 to 4.3 kg/cm2 with an average of 4.05 kg/cm2. The percentage deviation in hardness was 0.20 to 0.78. Percentage drug content for all formulations was found to be between 95.10% and 99.21 %. The floating lag time increases as the concentration of
[image:9.612.58.554.139.738.2]binder and Ratio of Kollidon SR: HPMC K15M increases. Total floating time was >12 hr and tablets were intact and floating. Swelling Index was found to be more in F1, F2 and F3 Batch as compared to other batches.
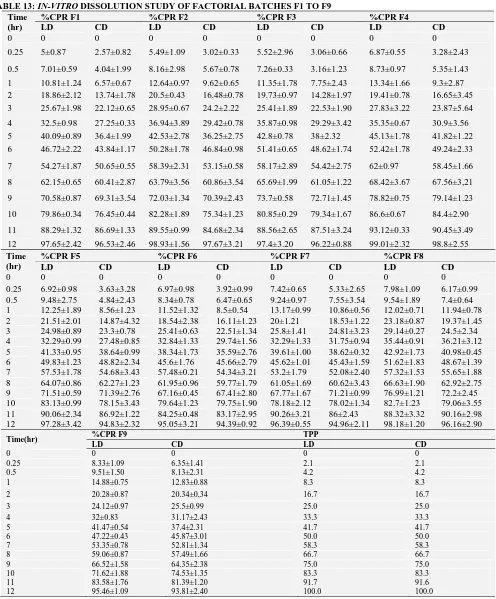
TABLE 13: IN-VITRO DISSOLUTION STUDY OF FACTORIAL BATCHES F1 TO F9 Time
(hr)
%CPR F1 %CPR F2 %CPR F3 %CPR F4
LD CD LD CD LD CD LD CD
0 0 0 0 0 0 0 0 0
0.25 5±0.87 2.57±0.82 5.49±1.09 3.02±0.33 5.52±2.96 3.06±0.66 6.87±0.55 3.28±2.43
0.5 7.01±0.59 4.04±1.99 8.16±2.98 5.67±0.78 7.26±0.33 3.16±1.23 8.73±0.97 5.35±1.43
1 10.81±1.24 6.57±0.67 12.64±0.97 9.62±0.65 11.35±1.78 7.75±2.43 13.34±1.66 9.3±2.87
2 18.86±2.12 13.74±1.78 20.5±0.43 16.48±0.78 19.73±0.97 14.28±1.97 19.41±0.78 16.65±3.45
3 25.67±1.98 22.12±0.65 28.95±0.67 24.2±2.22 25.41±1.89 22.53±1.90 27.83±3.22 23.87±5.64
4 32.5±0.98 27.25±0.33 36.94±3.89 29.42±0.78 35.87±0.98 29.29±3.42 35.35±0.67 30.9±3.56
5 40.09±0.89 36.4±1.99 42.53±2.78 36.25±2.75 42.8±0.78 38±2.32 45.13±1.78 41.82±1.22
6 46.72±2.22 43.84±1.17 50.28±1.78 46.84±0.98 51.41±0.65 48.62±1.74 52.42±1.78 49.24±2.33
7 54.27±1.87 50.65±0.55 58.39±2.31 53.15±0.58 58.17±2.89 54.42±2.75 62±0.97 58.45±1.66
8 62.15±0.65 60.41±2.87 63.79±3.56 60.86±3.54 65.69±1.99 61.05±1.22 68.42±3.67 67.56±3,21
9 70.58±0.87 69.31±3.54 72.03±1.34 70.39±2.43 73.7±0.58 72.71±1.45 78.82±0.75 79.14±1.23
10 79.86±0.34 76.45±0.44 82.28±1.89 75.34±1.23 80.85±0.29 79.34±1.67 86.6±0.67 84.4±2.90
11 88.29±1.32 86.69±1.33 89.55±0.99 84.68±2.34 88.56±2.65 87.51±3.24 93.12±0.33 90.45±3.49
12 97.65±2.42 96.53±2.46 98.93±1.56 97.67±3.21 97.4±3.20 96.22±0.88 99.01±2.32 98.8±2.55
Time (hr)
%CPR F5 %CPR F6 %CPR F7 %CPR F8
LD CD LD CD LD CD LD CD
0 0 0 0 0 0 0 0 0
0.25 6.92±0.98 3.63±3.28 6.97±0.98 3.92±0.99 7.42±0.65 5.33±2.65 7.98±1.09 6.17±0.99
0.5 9.48±2.75 4.84±2.43 8.34±0.78 6.47±0.65 9.24±0.97 7.55±3.54 9.54±1.89 7.4±0.64
1 12.25±1.89 8.56±1.23 11.52±1.32 8.5±0.54 13.17±0.99 10.86±0.56 12.02±0.71 11.94±0.78
2 21.51±2.01 14.87±4.32 18.54±2.38 16.11±1.23 20±1.21 18.53±1.22 23.18±0.87 19.37±1.45
3 24.98±0.89 23.3±0.78 25.41±0.63 22.51±1.34 25.8±1.41 24.81±3.23 29.14±0.27 24.5±2.34
4 32.29±0.99 27.48±0.85 32.84±1.33 29.74±1.56 32.29±1.33 31.75±0.94 35.44±0.91 36.21±3.12
5 41.33±0.95 38.64±0.99 38.34±1.73 35.59±2.76 39.61±1.00 38.62±0.32 42.92±1.73 40.98±0.45
6 49.83±1.23 48.82±2.34 45.6±1.76 45.66±2.79 45.62±1.01 45.43±1.59 51.62±1.83 48.67±1.39
7 57.53±1.78 54.68±3.43 57.48±0.21 54.34±3.21 53.2±1.79 52.08±2.40 57.32±1.53 55.65±1.88
8 64.07±0.86 62.27±1.23 61.95±0.96 59.77±1.79 61.05±1.69 60.62±3.43 66.63±1.90 62.92±2.75
9 71.51±0.59 71.39±2.76 67.16±0.45 67.41±2.80 67.77±1.67 71.21±0.99 76.99±1.21 72.2±2.45
10 83.13±0.99 78.15±3.43 79.64±1.23 79.75±1.90 78.18±2.12 78.02±1.34 82.7±1.23 79.06±3.55
11 90.06±2.34 86.92±1.22 84.25±0.48 83.17±2.95 90.26±3.21 86±2.43 88.32±3.32 90.16±2.98
12 97.28±3.42 94.83±2.32 95.05±3.21 94.39±0.92 96.39±0.55 94.96±2.11 98.18±1.20 96.16±2.90
Time(hr) %CPR F9 TPP
LD CD LD CD
0 0 0 0 0
0.25 8.33±1.09 6.35±1.41 2.1 2.1
0.5 9.51±1.50 8.13±2.31 4.2 4.2
1 14.88±0.75 12.83±0.88 8.3 8.3
2 20.28±0.87 20.34±0,34 16.7 16.7
3 24.12±0.97 25.5±0.99 25.0 25.0
4 32±0.83 31.17±2.43 33.3 33.3
5 41.47±0.54 37.4±2.31 41.7 41.7
6 47.22±0.43 45.87±3.01 50.0 50.0
7 53.35±0.78 52.81±1.34 58.3 58.3
8 59.06±0.87 57.49±1.66 66.7 66.7
9 66.52±1.58 64.35±2.38 75.0 75.0
10 71.62±1.88 74.53±1.35 83.3 83.3
11 83.58±1.76 81.39±1.20 91.7 91.6
12 95.46±1.09 93.81±2.40 100.0 100.0
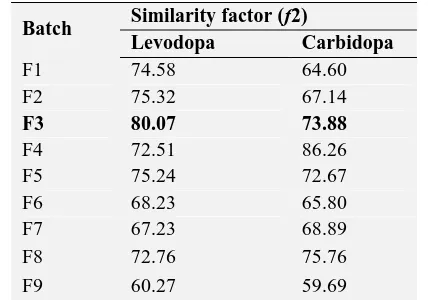
TABLE 14: COMPARISON OF SIMILARITY FACTOR
Batch Similarity factor (f2)
Levodopa Carbidopa
F1 74.58 64.60
F2 75.32 67.14
F3 80.07 73.88
F4 72.51 86.26
F5 75.24 72.67
F6 68.23 65.80
F7 67.23 68.89
F8 72.76 75.76
F9 60.27 59.69
All the factorial batches showed drug release up to 12 hr depending concentration ratio of Kollidon SR: HPMC K15M and concentration of binder. The percentage drug release at 12 hr was 97.4% for Levodopa and 96.22% for Carbidopa for formulations F3 which showed good release profile compared to theoretical drug release profile. The data for in-vitro release are shown in Table 13. F3 batch showed maximum similarity (80.07 for Levodopa and 73.88 for Carbidopa) as compared to other batches. Hence formulation F3 was optimized based on highest f2 similarity. Comparison of dissolution profile of F3 and theoretical profile was shown in Figure 8.
The value of diffusion exponent n for all factorial formulations was between 0.45- 0.89 indicating drug release from the formulations showed Non-Fickian or anomalous diffusion. The correlation coefficient of the optimized formulation F3 is follows the all kinetic models and shows the highest correlation (0.999 for LD and 0.999 for CD) with Zero order kinetic.
FIGURE 8: COMPARISON OF DISSOLUTION PROFILE OF F3 AND THEORETICAL PROFILE
Statistical Analysis of Factorial Design Batches Full and reduced model for Q15 Levodopa
The summary of regression analysis and ANOVA for Q15 Levodopa is shown in Table 15. The contour plot and 3D surface plot are shown in
Figure 9 and Figure 10, respectively. From the equation of full model, reduced model is drawn by rejecting insignificant factors on the basis of p value. From the model, it was found that Ratio of Kollidon SR: HPMC K15M showed positive effect on the CPR at 15 min (Levodopa). As its ratio increases, release rate of drug increases. Concentration of Binder also did not show effect on the CPR at 15 min. (Levodopa). It was concluded that X1 had significant effect on the CPR at 15 min. (Levodopa).
TABLE 15: SUMMARY OUTPUT OF REGRESSION ANALYSIS AND ANOVA FOR CPR AT 15MIN. (LEVODOPA)
DF SS MS F P-value
Prob > F
Regression 5 10.56 2.11 44.08 0.0052
Residual 3 0.14 0.048
Total 8 10.71 Significant
Coefficient b0 b1 b2 b11 b22 b12
Coefficient value 6.99 1.29 0.25 -0.30 -0.11 0.098
P-value 0.0052 0.0007 0.0649 0.1511 0.5228 0.4387
Full Model: Y1 = 6.99 + 1.29 X1 + 0.25 X2 -0.30 X12 -0.11X22 + 0.098X 1X2
[image:10.612.66.280.61.211.2] [image:10.612.64.548.565.739.2]Design-Expert® Software Factor Coding: Actual CPR 15min.(CARBIDOPA) (%)
Design Points
6.35
2.57
X1 = A: Ratio of KOLLIDON SR :HPMCK15M X2 = B: BINDER
0.18 0.22 0.25 0.29 0.33
0.00 1.00 2.00 3.00 4.00 5.00
CPR 15min.(CARBIDOPA) (%)
A: Ratio of KOLLIDON SR :HPMCK15M
B
:
B
IN
D
E
R
3
4 5
[image:11.612.114.497.48.445.2]6
FIGURE 11: CONTOUR PLOT OF CPR AT 15MIN. (CARBIDOPA)
Design-Expert® Software Factor Coding: Actual CPR 15min.(CARBIDOPA) (%)
Design points above predicted value
Design points below predicted value
6.35
2.57
X1 = A: Ratio of KOLLIDON SR :HPMCK15M X2 = B: BINDER
0.00 1.00 2.00 3.00 4.00 5.00
0.18 0.22
0.25 0.29
0.33 2
3 4 5 6 7
C
P
R
1
5
m
in
.(
C
A
R
B
ID
O
P
A
)
(
%
)
A: Ratio of KOLLIDON SR :HPMCK15M B: BINDER
FIGURE 12: 3D SURFACE PLOT OF CPR AT 15MIN. (CARBIDOPA)
Full and reduced model for Floating Lag Time
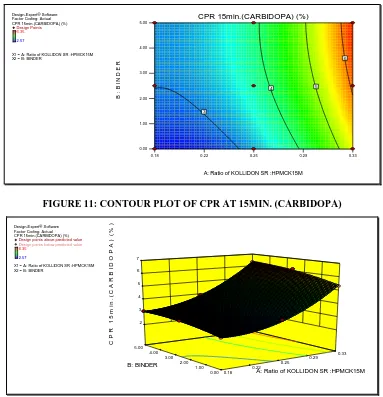
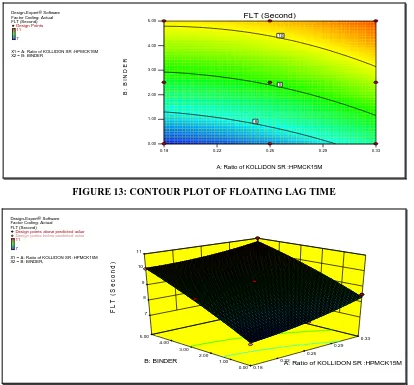
The summary of regression analysis and ANOVA for floating lag time is shown in Table 17. The contour plot and 3D surface plot are shown in
Figure 13 and Figure 14, respectively. From the equation of full model, reduced model is drawn by rejecting insignificant factors on the basis of p
value. From the model, it was found that Ratio of Kollidon SR: HPMC K15M showed positive effect on the Floating Lag Time. As its ratio increases floating lag time also increases. Concentration of Binder also showed positive effect on the floating lag time. It was concluded that X1 and X2 had significant effect on the floating lag time.
TABLE 17: SUMMARY OUTPUT OF REGRESSION ANALYSIS AND ANOVA FOR FLOATING LAG TIME
DF SS MS F P-value
Prob > F
Regression 5 12.56 2.51 20.27 0.0161
Residual 3 0.37 0.012
Total 8 12.93 Significant
Coefficient b0 b1 b2 b11 b22 b12
Coefficient value 9.06 0.47 1.36 0.17 -0.14 0.14
P-value 0.0161 0.0460 0.0025 0.5511 0.6052 0.4846
Full Model: Y1 = 9.06 + 0.47 X1 + 1.36 X2 +0.17 X1 2
-0.14X2 2
[image:11.612.118.498.55.230.2] [image:11.612.53.557.595.748.2]Design-Expert® Software Factor Coding: Actual FLT (Second)
Design Points
11
7
X1 = A: Ratio of KOLLIDON SR :HPMCK15M X2 = B: BINDER
0.18 0.22 0.25 0.29 0.33
0.00 1.00 2.00 3.00 4.00 5.00
FLT (Second)
A: Ratio of KOLLIDON SR :HPMCK15M
B
:
B
IN
D
E
R
[image:12.612.102.516.49.434.2]8 9 10
FIGURE 13: CONTOUR PLOT OF FLOATING LAG TIME
Design-Expert® Software Factor Coding: Actual FLT (Second)
Design points above predicted value
Design points below predicted value
11
7
X1 = A: Ratio of KOLLIDON SR :HPMCK15M X2 = B: BINDER
0.00 1.00 2.00 3.00 4.00 5.00
0.18 0.22
0.25 0.29
0.33 7
8 9 10 11
F
L
T
(
S
e
c
o
n
d
)
A: Ratio of KOLLIDON SR :HPMCK15M B: BINDER
FIGURE 14: 3D SURFACE PLOT OF FLOATING LAG TIME
Validation of Model by Check Point Batch
Check point batches D1 was selected from the overlay plot of responses. The ratio of Kollidon SR: HPMC K15M was selected from overlay plot and predicted responses were calculated and are given in the Table 18. Actual response of D1 was
[image:12.612.104.512.54.226.2]measured and compared with the predicted response of check point batches. All the values of responses were within the upper and lower predicted interval. Hence, this model is valid and optimized batch can be selected from the overlay plot of this model
TABLE 18: PREDICTED AND ACTUAL RESPONSES OF CHECK POINT BATCHES
Batch Predicted response Actual Response
D1
Drug release at 15 min. (Q15) Levodopa (%)
Drug release at 15 min. (Q15) Carbidopa (%)
Floating Lag Time
Drug release at 15 min. (Q15)
Levodopa (%)
Drug release at 15 min. (Q15) Carbidopa (%)
Floating Lag Time
5.168 2.636 7.232 4.84 2.56 7
Optimization of Batch from Overlay Plot
From the overlay plot it was seen that batch F1, F2 and F3 fall under the optimized area. Batch F3 shows good release profile as well as good similarity with the theoretical product profile. So from the above results F3 batch was considered to
be optimum which exactly fit in our objective.
Evaluation of Bilayer Floating Tablets
12.05±0.06 mm, 4.5±0.025 mm and 5.5±0.35 kg/cm2 respectively. The drug content of prepared bilayer tablets (n=3) was found to be 98.91± 1.07 (LD) and 99.9 ± 1.62 (CD). The Floating Lag time For Tablet was found to be average 42 seconds. TABLE 19: IN-VITRO DRUG RELEASE STUDY OF BILAYER FLOATING TABLET
Time (hr.)
%CPR (Levodopa)
%CPR (Carbidopa)
%CPR (Levodopa) TPP
%CPR (Carbidopa) TPP
0 0 0 0.0 0.0
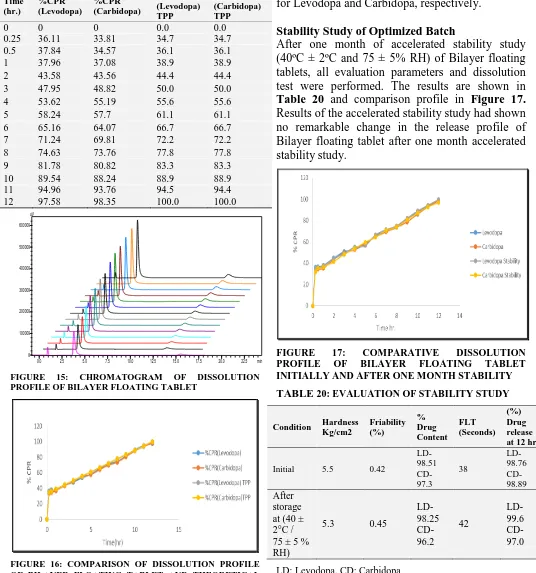
0.25 36.11 33.81 34.7 34.7 0.5 37.84 34.57 36.1 36.1 1 37.96 37.08 38.9 38.9 2 43.58 43.56 44.4 44.4 3 47.95 48.82 50.0 50.0 4 53.62 55.19 55.6 55.6
5 58.24 57.7 61.1 61.1
6 65.16 64.07 66.7 66.7 7 71.24 69.81 72.2 72.2 8 74.63 73.76 77.8 77.8 9 81.78 80.82 83.3 83.3 10 89.54 88.24 88.9 88.9 11 94.96 93.76 94.5 94.4 12 97.58 98.35 100.0 100.0
0.0 2.5 5.0 7.5 10.0 12.5 15.0 17.5 20.0 22.5 min 0
100000 200000 300000 400000 500000 600000 uV
FIGURE 15: CHROMATOGRAM OF DISSOLUTION PROFILE OF BILAYER FLOATING TABLET
FIGURE 16: COMPARISON OF DISSOLUTION PROFILE OF BILAYER FLOATING TABLET AND THEORETICAL PROFILE
In-vitro drug release profile of Levodopa and
Carbidopa of bilayer floating tablets was compared with theoretical drug release profile shown in
Table 19 and Figure 16. The f2 value, for Levodopa is 85.01 and for Carbidopa is 81.94 which indicate that the prepared bilayer floating tablet containing Levodopa and Carbidopa have good similarity with theoretical drug release profile for Levodopa and Carbidopa, respectively.
Stability Study of Optimized Batch
After one month of accelerated stability study (40ºC ± 2ºC and 75 ± 5% RH) of Bilayer floating tablets, all evaluation parameters and dissolution test were performed. The results are shown in
Table 20 and comparison profile in Figure 17.
Results of the accelerated stability study had shown no remarkable change in the release profile of Bilayer floating tablet after one month accelerated stability study.
FIGURE 17: COMPARATIVE DISSOLUTION PROFILE OF BILAYER FLOATING TABLET INITIALLY AND AFTER ONE MONTH STABILITY
TABLE 20: EVALUATION OF STABILITY STUDY
Condition Hardness Kg/cm2
Friability (%)
% Drug Content
FLT (Seconds)
(%) Drug release at 12 hr
Initial 5.5 0.42
LD-98.51 CD-97.3
38
LD-98.76 CD-98.89
After storage at (40 ± 2°C / 75 ± 5 % RH)
5.3 0.45
LD-98.25 CD-96.2
42
LD-99.6 CD-97.0
[image:13.612.38.574.165.738.2]CONCLUSIONS: From this research study, it was concluded that it is possible to formulate bilayer floating tablet containing Levodopa and Carbidopa which can provide loading dose and maintenance dose in a single dosage form. The results obtained with the dissolution test of Levodopa and Carbidopa show that the release profile is dependent on both the ratio of Kollidon SR: HPMC K 15M and Concentration of binder in tablet. The ratio of Kollidon SR: HPMC K 15M was able to modified the release of the Levodopa and Carbidopa for a prolonged time (12 hr).
In addition, these formulations reduce the need of frequent administration and enhance patient compliance. The prepared formulation was expected to give rapid onset of action than marketed available formulations which was the major drawback. The formulation was found to be stable for a period of one month at 40 ºC/ 75% RH. Bilayer floating tablet can be a potential novel drug dosage form for treatment of Parkinson’s disease.
ACKNOWLEDGEMENTS: Authors thank
Principal of Shri Sarvajanik Pharmacy College, Mehsana for extending laboratory and instrumental facilities to carry out the work.
REFERENCES:
1. Goole J and Amighi K: Levodopa delivery systems for the
treatment of Parkinson’s disease: An overview. International Journal of Pharmaceutics 2009; 380: 1–15.
2. Jonathan B, Grimshaw M, Erkoboni DF and Dickus MF.
Sustained-release composition and method of use thereof. US patent US2008/0139655 A1. Jun. 2008.
3. National Parkinson Foundation, March 2014
http://www.parkinson.org/
4. Han CH, Hsu A and Hsu L. Pharmaceutical dosage forms
having Immediate and Controlled release properties that contain an aromatic amino acid decarboxylase inhibitor and Levodopa. U. S. Patent. 10/787,417. Aug. 2004
5. Sinemet CR, July 2013,
http://www.accessdata.fda.gov/drugsatfda_docs/label/2008 /019856s025lbl.pdf
6. Momose, Denichi I, Nobuyuki K and Noboru. Gastric
Retention-type sustained-release levodopa preparation. United States Patent Application. 20100112053A1.May
2010.
7. Korsmeyer RW, Gumy R, Doelker E, Buri P and Peppas
NA: Mechanisms of solute release from porous hydrophilic polymers. International Journal Pharmaceutics 1983; 15: 25-35.
8. Patel SS, Ray S and Thakur RS: Formulation and
evaluation of floating drug delivery system containing clarithromycin for helicobacter pylori. Acta Poloniae
Pharmaceutica2006; 63(1): 53-61.
9. Siepmann J and Peppas NA: Modeling of drug release
from delivery systems based on hydroxypropyl
methylcellulose (HPMC). Advance drug delivery review 2001; 48: 139-157.
10. Ravi Kumar, Patil MB, Patil SR and Mahesh S:
Formulation and evaluation of effervescent floating tablet of famotidine. International journal of pharmaceutical
technology and research2009; 1(3): 754-763.
11. Costa P: Modeling and comparison of dissolution profile.
European Journal Pharmaceutical Science. 2001;13:
123-133.
12. Food and drug administration Federal register, “Stability
testing for new dosage forms” May 1997, 62(90), 25634-25635http://www.ich.org/products/guidelines/quality/articl e/quality-guidelines.html
All © 2014 are reserved by International Journal of Pharmaceutical Sciences and Research. This Journal licensed under a Creative Commons Attribution-NonCommercial-ShareAlike 3.0 Unported License.
This Article can be downloaded to ANDROID OS based mobile. Scan QR Code using Code/Bar Scanner from your mobile. (Scanners are
available on Google Playstore)
How to cite this article:
Patel DM and Gajjar PR: Development and Evaluation of Bilayer Floating Dosage Form of Carbidopa and Levodopa for Treatment of