4309
DATA ANALYSIS BASED ON LATANE THEORY AND
ANALYSIS OF EVENTS CHANGING IN SOCIAL
NETWORKS
1A.Zh. AKHMETOVA, 2T.V.BATURA, 1L.L. LA 2F.A.MURZIN
1 L.N.Gumilyov Eurasian National University, Department of Information Systems, Astana, Kazakhstan 2A.P. Ershov Institute of Informatics Systems SB RAS, Novosibirsk, Russia
E-mail: 1[email protected], 2[email protected], 1[email protected], 2[email protected]
ABSTRACT
The article describes the main methods and algorithms for analyzing user data from social networks. Special attention is paid to the method of measuring informational influence between users in a social network. In the process of analyzing social networks, it is advisable to consider a number of numerical and non-numerical characteristics, relations and sets that are naturally associated with network users and the messages circulating in it. The quantitative characteristics, relationships, and sets that are computable from data obtained from social networks, such as numeric single characteristics, non-numeric characteristics, sets, and numerical characteristics associated with sets, are presented. Modifications of the theory of dynamic social influence of Latane are proposed. The formulas describing the amount of social pressure directed at the individual for different situations have been modified. The method of R/S analysis, which can be applied to predict the change of events in social networks, is proposed. This method of time series analysis allows you to determine whether the time series is random or persistent, that is, having long-term memory. The article briefly describes the developed software package that allows to extract information from social networks, to process, analyze and visualize data. Testing was carried out on the data obtained from the social network vkontakte.
Keywords: Analysis Of Social Networks, The Internet, Vkontakte, Data Analysis, Latane Theory
1. INTRODUCTION
Social network is an interactive multi-user website, the content of which is filled by the participants of the network. The site is an automated social environment that allows you to communicate with a group of users United by common interests. The number of registered users of only one network can exceed the population of the whole country. Social networks open up new opportunities for solving research and business issues. This leads to an increased interest in the collection and analysis of social data by companies and research centers.
Through the past decade, social network analysis has experienced a golden age of rapid growth in participants, significant developments, and productive expansion into new substantive areas. Another such age occurred in the 1970s, and still another in the 1950s, during the broader golden age of social psychology. In fact, much of contemporary social network analysis builds on
foundations established in that golden age of social psychology. Recent academic growth in social network analysis can be attributed in part to
expanded computing and communication
technology that creates detailed network data and machines with which to process the data. Growth is also a function of contemporary participation in social networks, though conclusions vary on practical implications: People accumulate hundreds of friends and acquaintances through social media [1], but social and community engagement seems to be declining outside the ranks of affluent young white people [2], and people report fewer friends in whom they can confide than was the case even a decade earlier [3].
4310 organizations because of the abundant data and results available. Our setting is a person,ego, surrounded by a network of contacts, typically within a broader market or organization [4].
This structure was initially described by Jacob Moreno, the father of American network analysis, as the “social atom,” the smallest unit of social tructure in a community [5].
The analysis of social networks [6,7] is applied in order to study interactions between network participants, to predict their behavior, to classify, to model information flows in the networks. However, it should be noted that the social network is a tool that can be actively used by States for the formation and manipulation of public opinion. A number of countries (USA, Great Britain, China, India, France, etc.) have decided to study and use social networks for the benefit of these countries to model social, economic, political and other processes and to develop mechanisms of influence on these processes.
However, when working with social data, factors such as instability in the quality of user content (spam and false accounts), problems with ensuring the privacy of users' personal data during storage and processing, as well as frequent updates of the user model and functionality should be taken into account. All this requires continuous improvement of algorithms for solving various analytical and business problems. The processing of social data also requires the development of appropriate algorithmic and infrastructural solutions that take into account their dimensionality. For example, the Facebook social network database today contains more than 1 billion user accounts and more than 100 billion connections between them. Every day, users add over 200 million photos and leave more than 2 billion comments on various network objects. To date, most of the existing algorithms that effectively solve actual problems are not able to process data of a similar dimension in a reasonable time. In this regard, there is a need for new solutions, 441 allowing for the distributed processing and storage of data without significant loss of quality results.
The formation of people’s perspectives is not only due to their own beliefs and analysis of information, but also taking into account the views of the group, friends, etc. The authors attempted to adapt the theory of dynamic social influence of Latane [8, 9] in order to calculate the level of influence of people around them on the opinion of a particular person. Further, using the R / s analysis
method, we draw conclusions about how the user’s opinion changes over time. In order to conduct experiments in the framework of this study, a software package for the extraction, processing and analysis of user data was created. In particular, the system has a module that allows you to extract data from the social network vkontakte. In addition, this module has the ability to extend the functionality of almost any social network, depending on the API provided.
The second chapter of the article describes the quantitative characteristics, relations, and sets that are computable based on data obtained from social networks, such as numeric single characteristics, non-numeric characteristics, sets, and numerical characteristics associated with sets. Chapter 3 is devoted to the method of dynamic social influence Latane. The basic formulas, parameters for calculating the level of influence of surrounding people on the opinion of a particular user are given. A modification of the Latane formula for social networks has been proposed. And the results of calculating the level of influence based on data obtained from the social network VKONTAKTE are presented. Chapter 4 describes the R / S analysis algorithm, which is used to show the dynamics of changes in the opinions of social network users. Chapter 5 describes a software package with modules for extracting, processing, analyzing and visualizing data from social networks. The conclusion presents the tasks of future research.
In [7], it was proposed to use Latane's Theory of Social Influence, but the concurrent calculations were not given, and there are no results from the study. Therefore, it was decided to provide his version of the modification of the Latane formulas and conduct research in this area.
The method of social influence proposed by the authors Latane was not previously used in works devoted to the analysis of data of social networks other than work [7]. Also, the R / S method of analysis is widely used in the economy to track price movements for stock securities, exchange rates, etc., and is not found in the analysis of data from social networks. Therefore, we believe that the work will be interesting for researchers who are engaged in the study of data of social networks.
2. QUANTITATIVE PROPERTIES,
RELATIONS AND SETS, COMPUTABLE ON THE BASIS OF DATA OBTAINED FROM SOCIAL NETWORKS
4311 non-numerical characteristics, relationships and multitudes, naturally associated with the users of the network and the messages circulating in it. It is crucial that all of them are constructive, i.e. they can be calculated or constructed using appropriate algorithms, of course, if there is software that allows to “pump” the necessary information from the network [10,11,12].
Let us denote p as a message (“a post”) of a social network - a network user who can belong to the community, i.e. be subscribed. It can also create and forward messages.
Numerical single characteristics:
uCount
Followers_ – the number of people who
read the messages of this user (i.e. this user followers’ number);
u untFriends_Co – number of friends this user has
(the user himself enters some people in the list of friends);
u CountTimeline_ – number of posts uploaded by
the user;
pRetweets – the number of reposting;
PLikes – number of “likes” of this message, i.e. marks that this post is pleasant;
Non-numeric characteristics:
uReal_name – “real” user name, if the
corresponding position is filled (this is considered to be a non-numeric characteristic);
uBdate – user’s birth date;
uCity – user's city of residence;
uHometown – user’s hometown;
uRelation gives information about the user’s
marital status:
1 – not married; 2 – have a friend/have a girlfriend; 3 – engaged;
4 – married; 5 – all complicated; 6 – in active search; 7 – in love/in love.
uCareer – place of work, position;
uUniversity – place of study (university, college, etc.), faculty;
uSchool – the school where the user studied.
If the year of graduation from the institution is specified, sometimes it can be considered conditionally not as a numerical characteristic. For example, if the compare years only by coincidence, and the fact of coincidence or non-coincidence is reflected in the form
1
or in the form of 0.1. Typically, this type of data digitization is called indicator digitization.Varieties:
uFollowers – user’s followers;
uFriends – user’s friends;
uMentions – user names mentioned in the user's
posts;
uHashtags – hashtags that are mentioned in the user’s posts;
uUrls – external links that are found in the messages of this user.
Numerical characteristics associated with sets:
vMentions
Count_ u – number of user
u
mentions userv
;
v HashtagsCount_ u –number of user
v
hashtagmentioned by user
u
;
v UrlsCount_ u – number of references for external links of user
v
mentioned by useru
.
u1eets
Count_Retw u – number of messages
forwarded by the user
u
, received from the user1
u .
v nds CommonFrieCount_ u - number of shared
friends of users
v
andu
;The greater the number of followers, the more popular the user is. Thus, if we define in terms of the Latane’s theory of social influence [8,9], the function Followers_Count
u can be considered as“the power of influence” of the user
u
.3. LATANE'S THEORY OF SOCIAL
INFLUENCE AND ITS MODIFICATION
Social influence is a branch of social psychology that considers the characteristics of successful and unsuccessful convictions, such as compliance, obedience, and resistance to authority. Individuals and groups can be influenced by verbal and non-verbal means. It is important to note the difference between the terms obedience and pliability. Flexibility does not imply a change of position. For example, the introduction of strict penalties to comply with the law on "sober driving." Drivers can continue to believe that drinking and driving does not cause any harm, and they could drive in a drunken state, if not for fines. A successful belief is that a person must change his position, opinion and behavior. It is expected that a significant change in opinion or position on this issue will lead to a change in driver behavior.
There is its own terminology in the field of social influence. In 1948, Laswell (Lasswell) [8] proposed his own model of information transfer, consisting of 5 components:
• Source - a person who is trying to convince or influence another person.
4312 • Recipient - the person they are trying to influence.
• Communication channel - a way to send a message.
• Results of communication - the recipient's reaction to the message.
The Lasvel model was created to describe the communication of large masses, but it is also applicable in cases of communication between individuals. There are also models that include feedback, i.e. messages from the recipient to the source, for example, the Shannon-Weaver model (Shannon-Weaver) and the Osgood-Scarm circular model (Osgood-Schramm), since communication is a cyclical rather than linear process.
The methods, tactics and methods of influencing the source on the recipient are called propaganda. If propaganda is successful, it will lead to a change in the position of the recipient. One of the most influential scientists in this field, Carl Hovland (Carl Hovland) led the empirical studies of educational, public, advertising campaigns and propaganda, their impact on behavioral changes, as well as the impact of their individual components. The most important contribution of Hovland was the study of the effects based on the secret or overt fears of a person, and the causes of trust.
Primary research of social influence modeling. Modeling by a factor that plays a role when trying to influence a person requires a multi-pronged approach. Such disciplines as statistical mechanics, computer science, marketing, political science and social psychology are used to build the model. The model presented in this paper is mainly based on the theory of dynamic social influence proposed by Latane and its further development [8].
3.2. Modification of the theory Latane
Next, we consider how the theory of dynamic social influence proposed by Latane can be adapted to the case of social networks.
Latane emphasized the importance of three attributes of the relationship between the recipient and the source: power is social status and strength of trust; distance is something physical or psychological; current number is the number of sources affecting the recipient.
According to the theory of dynamic social influence, the level of influence experienced by an individual can be expressed by the following formula
N
i j
j ij
i j j i
i
d O O S S
I
, 1 ,
,
where: Ii – the amount of social pressure placed on individual; Oi – the opinion of the i individual (±1) in relation to this issue, value +1 conforms to support and –1 corresponds to resistance to supply;
i
S – power of social influence (Si 0); – resistance to change; dij – distance between individuals
i
andj
;
– the degree of weakening distance; N – total number of interacting agents.The value of the constant is generally assumed to be 2, in accordance with the value used in the Latane studies. A higher value of this constant means that more pressure is required to change opinions, a lower value corresponds to less effort. The value of the constant is also usually taken to be 2. Larger values mean that as the distance between the source and the receiver increases, a much larger pressure value is required.
The value dij is determined by the properties of
a pair of individuals, it can be considered as an indicator of ease of communication (transmission of information). When setting this value, age, national, religious and other differences can be taken into consideration. The formula for dij
calculation can include physical distance. For example, between residential places in which individuals locate. Generally, the fact that the ease of communication is subject to the law of inverse quadratic dependence on physical distance is taken into account [4]. Different approaches are possible for computer networks, including those where physical distance is not taken into account.
A modification of the Latane formula can be proposed for social network analysis as following
,
._ _
1 2 1
N i
N
j
ij i j
i j j N
i i
u
u u d
O O u Count Followers
u Count Followers I
n this formula, the force of influence is the number of user’s followers. The greater the number of subscribers, the more popular the user is. Here
ui uj
d , means the distance from the user
u
i to the user uj, which is determined by the mismatchesof the personal data.
4313 individual in the community in question is a member or not.
The following data from the user questionnaire was taken to calculate the Hamming distance: 1. Birthday;
2. Current city; 3. Hometown;
4. Work place (Career); 5. School (Education); 6. University (Education); 7. Relationship;
[image:5.612.116.501.75.440.2]8. Relatives and close people
Figure 1. Questionnaire Ismagulova Flora in the social network vkontakte
The work [4] refers to a polio vaccination company that are based on posts (via radio, publications, mass media, films and posters) that have an impact on society, with television and radio playing the most important role in urban areas. In our case, the power of the hashtag and the power of the link can be considered a distant analogue of the media.
External influence, such as media influence, can also be taken into consideration [8] in case an additional member is added to the Latane’s basic formula
Mi M iO S
O , where SMi – power of influence of
external sources on
i
individual, SMi0, OM– theopinion of an external source. Given consideration to the influence of the media, the final formula is presented
N
i ,j j i,jα
i j j Mi
M i i i
d O O S S
O O β S I
1
.
An external source is commonly modeled as an agent, but “outside the environment” and with a
distance of 1 to each individual due to its “ubiquitous” nature. The value varies from
individual to individual, as each person experiences different media pressure, a value similar to the sometimes considered as “a trust value” of the individual in posts received from external sources.
For social networks, the analogue of the media can be accounted as the power of the hashtag, the power of the link, or the power of the influence of commercial available in the user community.
Accordingly, the next formula is obtained
,, ,
, _
1 2
1 2
1
N i
N
j
ij i j
j i u u Hashtags
i
u Hashtags
j ij
j i u N
i u i
u
u u
u u Mentions
h h Hashtags
u Mentions Count
I
4314 which includes all users mentioned and all hashtags. Similarly, we obtain
N
i N
j
ij i j
j i u u
Urls
i
u Urls
j ij
j i u N
i u i
u
u u
u u Mentions
url url Urls
u Mentions Count
I
1 2
1 2
1
, ,
, _
.
In the case when commercial in relation to the community is played into the calculation, the following formula is obtained
N i
N
j
ij i j
i j j
s i N
i
N
i i
u
u u d
O O u Count Followers
O O s Count Followers
u Count Followers I
1 2 1
1
, _ _
_
Here, the number of followers to the community
sCount
Followers_ is consider ed as the impact power of community on this user. If there is advertising on the community, Osvalue takes the value +1, otherwise -1.
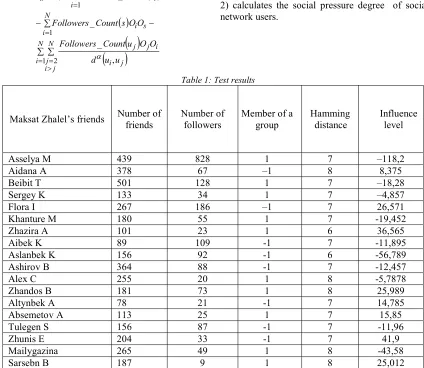
Below are the test results (Table 1) of Maksat Zhalel’s friends. The last column shows the influence levels of the followers (friends) of the individual
.
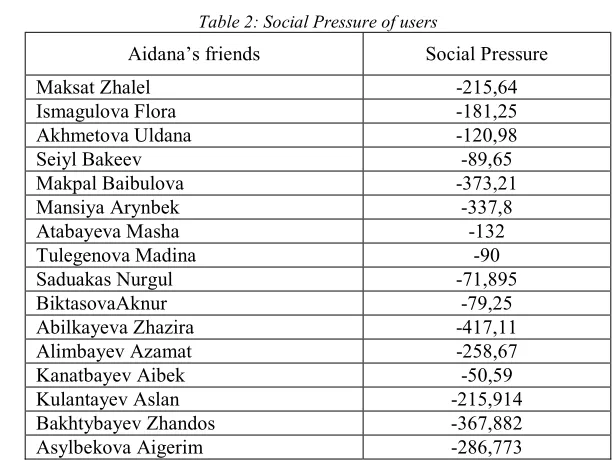
[image:6.612.93.517.278.646.2]When every degree of influence of each other is known, it is possible to calculate the amount of social pressure directed to the user using the above-stated Latane formula. The following table (Table 2) calculates the social pressure degree of social network users.
Table 1:Test results
Maksat Zhalel’s friends Number of friends Number of followers Member of a group Hamming distance Influence level
Asselya M 439 828 1 7 –118,2
Aidana A 378 67 –1 8 8,375
Beibit T 501 128 1 7 –18,28
Sergey K 133 34 1 7 –4,857
Flora I 267 186 –1 7 26,571
Khanture M 180 55 1 7 -19,452
Zhazira A 101 23 1 6 36,565
Aibek K 89 109 -1 7 -11,895
Aslanbek K 156 92 -1 6 -56,789
Ashirov B 364 88 -1 7 -12,457
Alex C 255 20 1 8 -5,7878
Zhandos B 181 73 1 8 25,989
Altynbek A 78 21 -1 7 14,785
Absemetov A 113 25 1 7 15,85
Tulegen S 156 87 -1 7 -11,96
Zhunis E 204 33 -1 7 41,9
Mailygazina 265 49 1 8 -43,58
4315
Table 2:Social Pressure of users
Aidana’s friends Social Pressure
Maksat Zhalel -215,64
Ismagulova Flora -181,25
Akhmetova Uldana -120,98
Seiyl Bakeev -89,65
Makpal Baibulova -373,21
Mansiya Arynbek -337,8
Atabayeva Masha -132
Tulegenova Madina -90
Saduakas Nurgul -71,895
BiktasovaAknur -79,25
Abilkayeva Zhazira -417,11
Alimbayev Azamat -258,67
Kanatbayev Aibek -50,59
Kulantayev Aslan -215,914
Bakhtybayev Zhandos -367,882
Asylbekova Aigerim -286,773
4. METOD OF R/S ANALYSIS
The method of R/S analysis is a statistical method of analyzing time series or numerical
sequences (mainly financial), allowing to determine some important characteristics, such as the presence of non-periodic cycles, “memory” of the process, the degree of randomness, etc. [14,15,16]. An important characteristic calculated by the R/S analysis method is the Hurst exponent, commonly denoted by H, which characterizes the degree of randomness of the process.
Note that in the case when 0.5<H<1 it is considered to be the persistent (supported) behavior of the process, or that the process has a long-term memory. In other words, if there have been positive process increments in the past for some time, that is, there has been an increase, then there will continue to be an increase on average. In other words, the probability that the process at the i+1 step deviates from the average in the same direction as at the i step is as high as the parameter H is close to 1.
In the case when 0<H<0.5 it is considered to an anti-persistence of the process. Here, high process values follow low, and Vice versa. In other words, the probability that at the i+1 step the process deviates from the mean in the opposite direction (relative to the deviation at the i step) is as high as the parameter H is close to 0. If H=0.5, the deviations of the process from the mean are really random and do not depend on the previous values, which corresponds to the case of Brownian motion [14].
The following are the relevant formulas and results of the study.
4.1. RS-analysis algorithm
1. The reference series St is given. Thus,
logarithmic relations are calculated as:
1
ln
t t t
S S N
2. Let us divide the series N to A adjacent periods with the length . Each period is noted as
a
I , where a1,2,...,A. We determine for each period average value:
n
k ka
a n N
I E
1 ,
1 ) (
3. Then the deviations from the average for each period
I
a are calculated in the following way:) ) ( (
1 ,
,
k
i ia a
a
k N E I
X
4. Then the scope within each period is calculated:
) min( )
max( k,a k,a a
I X X
R
5. The standard deviation for each period
I
a is calculated:2 1( , ( )) 1
a n
k ka a
I n N E I
S
6. Each
R
Ia is divided intoS
Ia. Then the average value R/S is calculated:A A S R S
R aA
n) 1 (
) ( / /
4316 Calculating the R/S values in accordance with the algorithm indicated above, we form a sequence
of points on the subspace N
n n n
n y n RS
x ) (ln ,ln ) 1
(
and the corresponding values of the number of elements n. It remains to apply the method of least squares (MLS) to determine the angular coefficient of the line passing as close as possible to the obtained points. For the known least-squares formula, assuming the following
N
i
N i
N i N
i x c xg xy g y
c
1 1 1 2 1
2 1
2
1 , , ,
The Hurst coefficient is calculated next:
2 2 1
2 2 1
c Nc
g c Ng H
4.2. R/S analysis for social networks
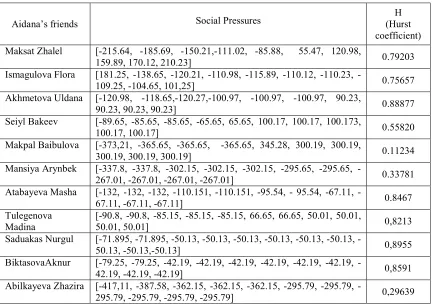
The authors proposed a method of RS analysis to predict changes in the opinions of network users. We decided to make experiments on data taken from social networks. In our calculations we clearly adhered to the above algorithm. As the initial data were taken calculated by the formulas Latane - (the amount of social pressure directed at the individual) at different time series.
As an example, the user's participation in the event was reviewed. One of the types of communities that can be created in the social network is events. The organizer can invite the friends as well as any user of the network will be able to see the event or search for it and join it even if s/he is not the user’s friend just in case the event is open. The number of guests and those who may attend, and those who accepted the invitation can be viewed in the community. In our case, the event “Webinar on self-Development” was created, and invitations were sent to all Aidana Akhmetova’s friends. The source data range was accounted to 2 months: from 15.02.2019 to 15.04.2018. Website vk.com [14] was used as data Source. Some test results are shown in Table 3.
The values of the Hurst indicator indicate that the dynamics of changes in the users’ opinion of Maksat Zhalel, Ismagulova Flora, Akhmetova Uldana, Seiyl Bakeev, Atabayeva Masha,
Tulegenova Madina, Saduakas Nurguland
[image:8.612.85.517.422.729.2]Kanatbeyev Aibek is persistent, that is, they will take part in the event, since the value varies between 0.5<H<1. Hurst indicators for others is anti-persistent, where the values are close to 0.
Table 3: Hurst coefficient
Aidana’s friends Social Pressures (Hurst Н
coefficient) Maksat Zhalel [-215.64, -185.69, -150.21,-111.02, -85.88, 55.47, 120.98,
159.89, 170.12, 210.23] 0.79203
Ismagulova Flora [181.25, 138.65, 120.21, 110.98, 115.89, 110.12, 110.23,
-109.25, -104.65, 101,25] 0.75657
Akhmetova Uldana [-120.98, -118.65,-120.27,-100.97, -100.97, -100.97, 90.23,
90.23, 90.23, 90.23] 0.88877
Seiyl Bakeev [-89.65, -85.65, -85.65, -65.65, 65.65, 100.17, 100.17, 100.173,
100.17, 100.17] 0.55820
Makpal Baibulova [-373,21, -365.65, -365.65, -365.65, 345.28, 300.19, 300.19,
300.19, 300.19, 300.19] 0.11234
Mansiya Arynbek [337.8, 337.8, 302.15, 302.15, 302.15, 295.65, 295.65,
-267.01, --267.01, --267.01, -267.01] 0.33781
Atabayeva Masha [132, 132, 132, 110.151, 110.151, 95.54, 95.54, 67.11,
-67.11, --67.11, -67.11] 0.8467
Tulegenova
Madina [-90.8, -90.8, -85.15, -85.15, -85.15, 66.65, 66.65, 50.01, 50.01, 50.01, 50.01] 0,8213 Saduakas Nurgul [71.895, 71.895, 50.13, 50.13, 50.13, 50.13, 50.13, 50.13,
-50.13, --50.13,-50.13] 0,8955
BiktasovaAknur [79.25, 79.25, 42.19, 42.19, 42.19, 42.19, 42.19, 42.19,
-42.19, --42.19, -42.19] 0,8591
Abilkayeva Zhazira [417,11, 387.58, 362.15, 362.15, 362.15, 295.79, 295.79,
4317 5. SOFTWARE IMPLEMENTATION
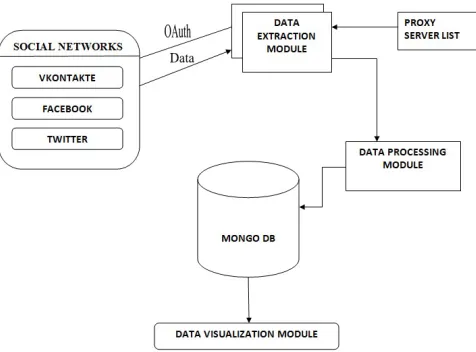
[image:9.612.80.522.61.215.2]In the process of research, a software package was developed that contains modules for extracting information from social networks, processing, analyzing and visualizing data. All modules are implemented in Python. The data extraction module has the ability to extract data, primarily from the largest social networks: vkontakte. To access each of them, an application programming interface (API) is used [19]. The extracted user data can be divided into three categories: 1) the actual user data, such as name, nickname, registration time; 2) user messages; 3) communication between users. The structure of the software complex is shown in Fig.1.
The data extraction module has the ability to extract data, primarily from the social network: vkontakte. At the moment, this module has the possibility of functional expansion to almost any social network, depending on the provided API. To work with most API methods, you need to pass an access_token in the request — a special access key.
A token is a string of numbers and Latin letters that you send to the server along with the request. From this line, the server receives all the information it needs. There are different ways to get a token, moreover, it can be issued not only to the user, but also to the community, and immediately to the entire application.You can get the user access key in one of these ways:
- Implicit flow. To work with the API on behalf of the user in Javascript-applications and Standalone-clients (desktop or mobile).
- Authorization code flow. To work with the API on behalf of the user from the server side of your site.
In our case we used the first method. The basic methods we use are:
Users - Methods for working with user data. Wall - Methods for working with posts on the wall.
Groups - Methods for working with
communities.
Full list of methods on the page:
https://vk.com/dev/methods [20]
Figure 2. Program structure
Alimbayev Azamat [-258,67, -248,7, -248,7, -202.715, -202.715, -195.165, -195.165,
-167.01, -167.01, -167.01, -167.01] 0,4568
Kanatbayev Aibek [-50.59, -37.8, -37.8, -37.8, -37.8, -37.8, -37.8, -37.8, -37.8, -37.8,
-37.8] 0,8756
Kulantayev Aslan [215,914, 215,914, 215,914, 202.115, 202.115, 195.62,
-195.62, -167.011, -167.011, -167.011, 167.011] 0,321
Bakhtybayev
Zhandos [-367,882, -347.118, -302.11, -302.11, -302.11, -291.12, -291.12, -291.12, -291.12, -291.12, -291.12] 0,2891 Asylbekova
Aigerim
[-286,773, -237.48, -237.48, -222.14, -215.15, 215.15, 204.55,
[image:9.612.187.425.512.688.2]4318 After extraction, the data processing module searches for hashtags, user references, links, etc. The extracted data is shown in Fig.2. For data storage used document-oriented database MongoDb [21]. The choice fell on this database for the following reasons.
[image:10.612.109.517.190.509.2]1. There are data processing mechanisms Map Reduce and Aggregation framework, significantly accelerating the processing of data in the database itself to provide the processed data in the required format for subsequent analysis.
Figure 3. Data Akhmetova Uldana downloaded from VKontakte
6.CONCLUSION
This work gave a general idea of the possibilities of the theory of social influence and pc analysis. Although the phenomenon of social change is very complex, the applied theory of dynamic social influence of Latane makes it possible to identify the most critical factors of social influence and systematically change them in a very simple model. Data and events in social networks are not subject to normal distribution. Therefore, we proposed an R / S analysis algorithm, where the Hirst index is calculated, depending on the value of which we can conclude that the time series are constant or random. Studies have shown that the method of R / S-analysis can be used to analyze social networks.
Future research.
The two most labor-intensive parts of social modeling are the selection of an illustrative example of the target group for the formation of a
basic data set and the development of a reasonable set of rules of behavior and the probability of influencing the behavior of USERS. If the data set and rules of conduct are well developed, then a simulation that imitates various issues of social
4319 as military or religious groups. Organizations with a higher level of behavior coherence are easier to model than organizations where there is more uncertainty and diversity in individual behavior. More detailed data sets describing demographic indicators, rules of behavior in a group, and a network of social connections will be of great benefit in further building models. Opportunities such as social and geographical mobility, family ties, the possibility of developing and breaking friendship ties, an increasing and decreasing level of social prestige and influence over time, and more complex interaction rules add accuracy in modeling. The use of several external sources (media) with different opinions also increase the realism of the model.
REFERENSES
[1]Rainie L, Purcell K, Smith A. “The Social Side of the Internet”. Washington, DC: Pew Res. Cent. 2011.
[2]Putnam R.. Bowling Alone. New York: Simon & Schuster, 2000.
[3]McPherson JM, Smith-Lovin L, Brashears M. “Social isolation in America. Am. Sociol. Rev. 71, 2006, pp. 363–75
[4]Wellman B. 1993. “An egocentric network tale: comment on Bien” et al. Soc. Netw. 15, 1991, pp. 423–36
[5]Moreno JL. “Who Shall Survive? A New Approach to the Problem of Human Interrelations”. Nerv. Ment. Disease Monogr. Washington, DC: Nerv. Ment. Disease , Ser., No. 58, 1934, pp. 2–20.
[6]Charu C. Aggarwal Social network data analytics. 2011. 520 p.
[7]Batura T.V. “Methods of Analysis Computer Social Networks” // Bulletin of NSU. Series: Information Technology, Novosibisrk, Vol. 4, 2012, pp. 13–28.
[8]Nowak A., Szamrej J., Latané B. “From private attitude to public opinion: a dynamic theory of social impact” // Psychological Review, 97, 1990. pp. 362–376.
[9]Wragg T. “Modeling the Effects of Information Campaigns Using Agent-Based Simulation” // Prep.: Command and Control Division,
Defense Science and Technology
Organization, Australian Government, DSTO-TR-1853, 2006. 61 p.
[10] Kopylova N. “Modeling the mechanisms of social influence on the basis of the multi-agent approach” // Artificial Intelligence Issues (Vestnik of the MSMI of the RAS), 2009. pp. 173–183.
[11] Murzin F. A., Dubynin S. V. “Modification of Latane's theory of social influence for computer social networks” // Technique. Technology. Engineering, №1, 2016, pp. 14-17.
[12] Asendorpf JB, Wilpers S. 1998. Personality effects on social relationships. J. Personal. Soc. Psychol. 74:1531–44
[13] E. D. Kolaczyk and G. Csárdi, Statistical “Analysis of Network Data with R”. Springer, 2014.
[14] Hurst, G. E., “The long-term capacity of reservoirs ”// Proceedings of the American Society of Civil Engineers, 116, 1951, pp. 770-808
[15] Karmanov A.P., “Lignin. Structural
organization and self-organization” // Institute of Chemistry, Komi Scientific Center, Ural Branch of the Russian Academy of Sciences, Syktyvkar, 1999, pp. 66-67
[16] Peters E. 2000. Chaos and order in the capital markets. - M .: Mir, 2000, 272 p.
[17] Wei Tan, Brian Blake, Iman Saleh. 2013. “Big Data Analytics and Social Networks” // Open Systems. DBMS №8, 2013, pp. 37–41. [18] Tussupov J., La L., Mukhanova A. A. “A
model of fuzzy synthetic evaluation method realized by a neural network” // International journal of Mathematical Models and Methods in Applied Sciences , 2016, Vol. 8. pp.103-106.
[19] API (application programming interface,
application programming interface)
https://ru.wikipedia.org/wiki/API (access date: 09/02/2019).
[20] API methods and objects
https://vk.com/dev/methods (access date: 9/02/2019).
[21] MongoDbhttp://docs.mongodb.org/manual/ref
erence/replica-status/ (access date:
09/02/2019).
[22] Willett P. The Porter “Stemming Algorithm: Then and Now ”// Program: Electronic Library and Information Systems. 2006. Vol. 40 (3). pp. 219–223