Attribute Choice
Thesis by Geoffrey Fisher
In Partial Fulfillment of the Requirements for the degree of
Doctor of Philosophy
CALIFORNIA INSTITUTE OF TECHNOLOGY Pasadena, California
2015
ACKNOWLEDGEMENTS
Before applying to doctoral programs, I was lucky enough to attend two seminars on neuroeconomics given by Antonio Rangel. Simply put, these talks changed my life. The passion with which Antonio presented his work was infectious, and within an hour I was convinced I had to pursue similar topics as a graduate student. When I had the opportunity to go to Caltech and work with him, there really was no choice to be made. Certainly, the research that follows in this dissertation would not be possible without Antonio’s generous support. From the rigorous training, to providing outstanding resources, to constantly working to make me a better scientist, Antonio has exceeded even the loftiest expectations one could have for any advisor or mentor.
ABSTRACT
The following work explores the processes individuals utilize when making multi-attribute choices. With the exception of extremely simple or familiar choices, most decisions we face can be classified as multi-attribute choices. In order to evaluate and make choices in such an environment, we must be able to estimate and weight the particular attributes of an option. Hence, better understanding the mechanisms involved in this process is an important step for economists and psychologists. For example, when choosing between two meals that differ in taste and nutrition, what are the mechanisms that allow us to estimate and then weight attributes when constructing value? Furthermore, how can these mechanisms be influenced by variables such as attention or common physiological states, like hunger?
TABLE OF CONTENTS
Acknowledgements ... iii
Abstract ... v
Table of Contents ... vi
Introduction ... vii
Chapter I: The Multi-Attribute Attentional Drift Diffusion Model ... 1
Results ... 8
Discussion ... 18
References ... 29
Chapter II: Intertemporal Discount Rates Are Causally Influenced by Attention ... 41
Experiment 1: Correlational Test ... 43
Experiments 2&3: Causal Tests ... 50
Discussion ... 55
References ... 61
Chapter III: Symmetry in Cold-to-Hot and Hot-to-Cold Valuation Gaps ... 83
Results ... 87
Discussion ... 92
INTRODUCTION
What are the algorithms we employ when making simple multi-attribute decisions, such as choosing between foods that differ in taste and nutrition? How do we estimate and weight attributes as we make decisions? Chapter 1 proposes a new accumulator model, the multi-attribute attentional drift diffusion model (maDDM), that computationally describes the choice process and allows that process to be guided by visual attention. Using a laboratory experiment, we find the maDDM makes accurate quantitative predictions about several key variables including what we choose, how long it takes to make a choice, and how these variables are correlated with attention to different attributes. Furthermore, we estimate an attribute-based fixation bias that suggests attention to an attribute increases its subjective weight by 5%, while the unattended attribute’s weight is decreased by 10%. Our findings imply we may use similar computational processes as we make multi-attribute choices.
variation explained about 30% of the subjects’ ability to choose the delayed option. We carried out two additional experiments in which we exogenously manipulated the allocation of attention, and found that shifting attention to the attributes that are relatively more attractive in the larger-later option increased patience. Together, these results are consistent with the existence of a causal impact of relative attention on intertemporal choice.
C h a p t e r 1
THE MULTI-ATTRIBUTE ATTENTIONAL DRIFT DIFFUSION MODEL
Except for very simple and familiar choices, most decisions require the identification and weighting of multiple attributes. Examples include choosing between two meals that differ in their taste, nutrition, and costs, or choosing between slot machines that differ in the likelihood and size of the potential rewards. Given their prevalence, understanding the algorithms that we use to make multi-attribute choices, and how they are affected by contextual variables, is a central question in psychology, economics, and neuroscience (Busemeyer & Johnson, 2004; Mas-Colell, Whinston, & Green, 1995; Glimcher & Fehr, 2014; Fehr & Rangel, 2011).
we call the multi-attribute attentional drift diffusion model (maDDM). Our model details the choice process by modeling how attention to attributes, at the level of random eye fixations, alters individual choices.
Our model builds on two main literatures. First, previous work has shown sequential integrator models of decision-making, such as the Drift-Diffusion model (Ratcliff, 1978; Ratcliff et al., 2003; Ratcliff & Smith, 2004), leaky-accumulator model (Usher & McClelland, 2001), and Decision Field Theory (DFT) (Busemeyer et al., 1993; Busemeyer & Townsend, 1992; Roe et al., 2001; Busemeyer & Diederich, 2002; Diederich, 1997) provide accurate quantitative accounts of how choice probabilities and reaction times vary with properties of the choice options. These models typically assume choices are made using a relative value signal that is dynamically computed by integrating an instantaneous noisy measure of the desirability of options, and that a choice is made when the accumulated relative value signal becomes sufficiently strong in favor of one of two options. Furthermore, a growing body of evidence from neuroscience has found that the implementation of certain sequential integrator models is biologically plausible (Britten et al., 1992; Gold and Shadlen, 2007; Heekeren et al., 2008; Rangel and Clithero, 2013; Hare et al., 2011).
Townsend, 1992; Roe et al., 2001; Busemeyer & Diederich, 2002; Diederich, 1997). While both the aDDM and DFT attempt to explain the underlying choice process, the two literatures have progressed slightly differently. For instance, the aDDM has investigated how the value computation process changes as a function of random eye fixations to different options (Krajbich et al., 2010) while DFT has modeled attention by appealing to a dynamic attention function that weights information over time (Roe et al., 2001; Diederich, 1997), but does not rely on fixation data to quantify how attention is distributed throughout a decision. On the other hand, DFT has certain benefits, as it has developed a deep understanding of both multi-attribute choice and choices over multiple options while the aDDM has only been extended to choice over a small number of options and has not modeled multi-attribute choice. Our work attempts to take a step in unifying these two literatures by extending the underlying principles of the aDDM to a case of simple multi-attribute choice.
To test our model, we conduct a laboratory experiment where participants make decisions over whether to consume multi-attribute bundles of food while we record their eye movements between two attributes. Critically, our results provide a quantitative estimate for how attending to particular attributes of a choice can alter the weights those attended features receive when computing value: we find subjects overweight the currently attended attribute and underweight the unattended attribute.
computations performed when making attribute decisions as when making multi-alternative decisions? This question evaluates how well principles of the aDDM can be extended to the maDDM, an important test in understanding this new choice domain. Second, by how much do subjects overweight attended features and underweight unattended features, if at all? This second question is important because although there is previous evidence that fixations bias choice, there is little work estimating the quantitative impact of how attention to attributes alters the likelihood of choosing an option.
Results
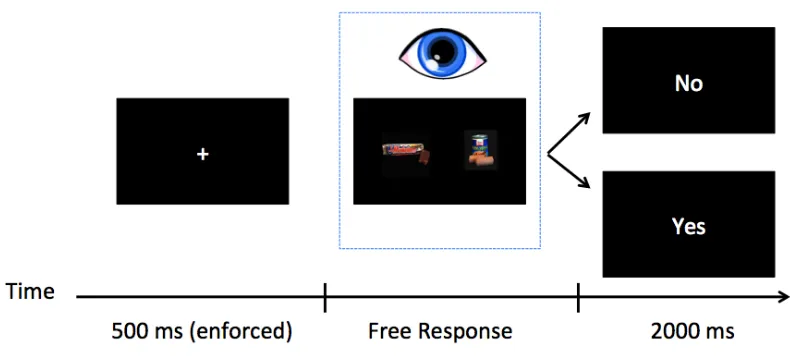
As illustrated in Figure 1, every trial hungry subjects are shown a bundle of two foods, one appetitive and one aversive, and have to decide whether or not they want to eat both a minimum of three bites of both of the foods (see Methods for details). Subjects make such choices for 200 different bundles, and at the end of the experiment the decision that they made in a randomly selected trial is implemented. Subjects also completed two rating tasks in which they provided liking ratings for each food individually, and for each of the choice bundles.
Importantly, in order to study the role of relative attention to the attributes, we monitored fixations during the choice task with eye tracking. Although it is well known that fixations and attention can be dissociated (Posner et al., 1977; Egly et al., 1994), for the purposes of this experiment fixations appear to provide a reasonable measure of attention at any instant during the choice process.
Model. The experiment was designed to allow us to test the ability of the maDDM to account for the relationship between fixations, choices, and reaction times in a simple multi-attribute choice setting. To see why, we begin by describing the model and its properties.
The model assumes that the value of a bundle, denoted by VB, is given by a linear combination of the values of the appetitive food (VP) and the aversive foods (VN); i.e.,
VB = β0 + βPVP + βNVN.
the mean coefficient on the interaction was 0.14 (SD = 0.31); however, the mean difference in R2 before and after adding this term was only 0.007 (minimum = 0.00, maximum = 0.03). Furthermore, running a mixed-effects linear regression with the interaction term found the coefficient to be insignificant with an estimate of 0.077 (p > 0.05). Hence, we find little evidence to suggest an interaction effect occurred and analyze the data without this term.
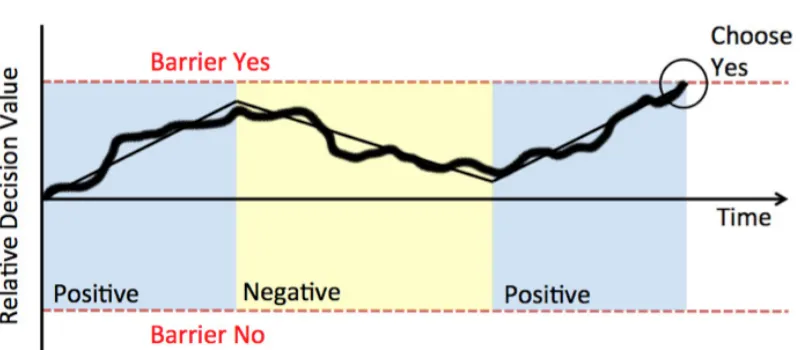
As depicted in Figure 2, the maDDM assumes that decisions are made by integrating a relative decision value (RDV) signal over time until enough evidence is accumulated in favor of one of the two options: choice = “yes” or choice = “no.” In particular, the subjects choose “yes” if the barrier crossed is at B = +1, and choose “no” if the barrier crossed is at B = -1. The model also predicts reaction times, since choice time equals the time the barrier
is crossed.
A key property of the model is that both the bundle properties and attention are allowed to influence the evolution of the RDV signal, and thus how choices are made. In particular, the model assumes that there is a fixation bias, so that attending to a particular attribute increases the weight that attribute is assigned in the integration process. Specifically, when looking at the appetitive attribute the RDV evolves according to
RDVt = RDVt-1 + d(β0 + δβPVP + θβNVN) + εt
RDVt = RDVt-1 + d(β0 + θβPVP + δβNVN) + εt.
Here, RDVt indicates the value of the RDV signal at time t, d is a constant that controls the speed of integration (in units ms-1), δ is a parameter that can take values greater than or equal to 1 and reflects the fixation bias towards the currently fixated attribute, θ is a constant between 0 and 1 that reflects a fixation bias to the currently non-fixated attribute, and εt is i.i.d. white Gaussian noise with variance σ2 that reflects the stochastic nature of the process.
Importantly, the model assumes that the fixation process between the two attributes is independent of each individual attribute’s value, or of the location of the positive and negative items. In particular, the first fixation is assumed to go to the left attribute with a constant probability p. Fixations then alternate between the two foods until a barrier is crossed. At the beginning of each fixation, a maximum fixation length is drawn from a distribution that depends on the type of attribute (appetitive or aversive), and whether the fixation is a first fixation or a later one. The fixation is then allowed to run its course unless a barrier is crossed before it terminates, which ends the choice process.
Several properties of the model are worth highlighting.
been widely used in the previous literature to study binary choices in a large number of domains, including simple choices (Milosavljevic et al., 2011; Ratcliff, 1978; Ratcliff & Smith, 2004).
Second, the model exhibits a fixation bias when δ > 1 or θ < 1. In that case, an exogenous relative increase in attention to the appetitive food biases choices towards consuming the bundle, while the opposite is true for an exogenous decrease. Figure 2 provides an intuition for why this is the case. Consider a case in which βP = βN = 1, VP = -VN, and β0 = 0. Here, in the absence of an attentional bias (i.e., when δ = θ =1), the slope of the RDV is always zero, and the choice is determined simply by the realization of noise. In contrast, when θ < 1 < δ the slope of the RDV signal is positive when looking at the appetitive attribute, and negative otherwise. As a result, the probability of choosing “yes” depends on the relative allocation of attention.
Third, the model has four free parameters (d, δ, θ, σ) that can be fitted using the choice, fixation, and reaction time data. The model has a fifth parameter, given by the height of the barrier, which is assumed to be fixed at ±1. This is without loss of generality because multiplying the barriers, slope, and noise by a fixed constant has no effect on the model’s predictions.
Model Fitting. We fitted the model using MLE on the pooled group data (see Methods for details). Importantly, parameters were fitted using only the even-numbered trials, and the odd trials were used to test the predictions of the best fitting model out of sample. The best fitting parameters where d = 0.0013, σ = 0.02, δ = 1.05, and θ = 0.90 (loglikelihood = -18,016).
In order to test for the presence of a fixation bias, we also fitted a model with the restriction
δ = θ = 1. The best restricted model also had d = 0.0013 and σ = 0.02 (loglikelihood = -18053). A likelihood ratio test statistic provided support in favor of the unrestricted model with a small but significant fixation bias model (p < 0.001).
In order to test for the asymmetry of the fixation bias, we also fitted a model with the restriction δ – 1 = 1 – θ. The best restricted model had parameters d = 0.0012, σ = 0.0225, δ
= 1.025, and θ = 0.975 (log-likelihood value = -18053). A likelihood ratio test provided support in favor of the asymmetric fixation bias (p < 0.001).
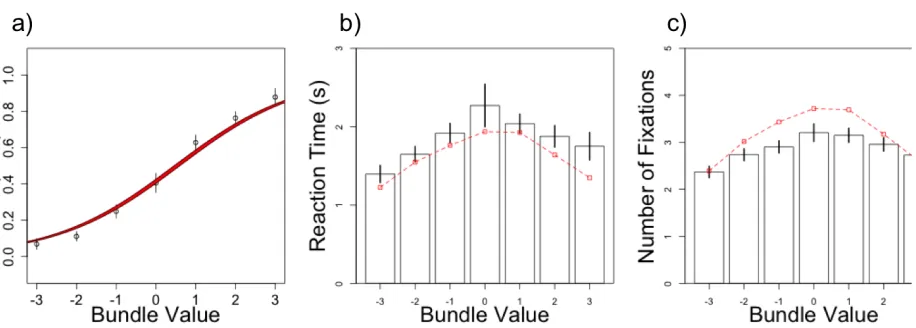
Basic Psychometrics. Figure 3 compares the basic psychometric properties of the data with the predictions generated by the best fitting model. In this figure, and the following ones, black denotes data and red denotes out of sample predictions. Both data and predictions are shown only for odd trials, to insure that the comparison is out-of-sample. Predictions were made by simulation the best-fitting model 4,000 times for each bundle liking rating, and sampling fixation lengths from the empirical distribution of observed fixations, conditioning only on whether a fixation was to an appetitive or aversive attribute, and whether the fixation was a first a later one. See Methods for more details.
Figure 3A depicts the psychometric choice curve. It shows that the probability of choosing yes is a logistic function of the bundle value which matches well the predictions of the best fitting model (goodness of fit test: p = 0.48).
Figure 3B depicts the reaction time curve, which exhibits the typical inverted-U pattern of reaction time when plotted against the liking rating of the bundle, so that more difficult choices take longer. The data also matches the predictions of the best fitting model (goodness of fit test: p = 0.27).
mean = 3.15). Part of the mismatch between actual and predicted fixations has to do with technical limitations of the fitting and prediction procedure, which are discussed in more detail in the final Discussion section.
Properties of the Fixation Process. As described above, the basic maDDM assumes that fixations are independent of the value of the foods. Here we test if the pattern of observed fixations is consistent with this assumption.
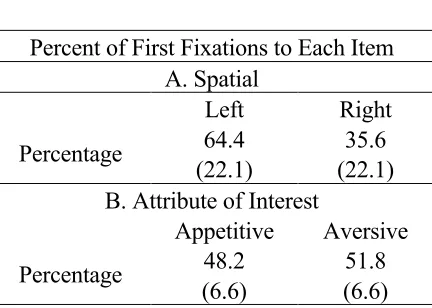
As shown in Table S1, subjects exhibited a left-first bias: they looked at the left attribute before the right 64% of the time (p < 0.01). However, the location of first fixation was not significantly different for positive and negative foods (Table S1, p > 0.05).
The duration of the first fixation was not significantly related to the value of the attended item (mixed-effects regression of first fixation length on an indicator for whether the item is appetitive, the weighted value of the item and the weighted value of the unattended item: beta of indicator = -37.92, t-statistic: -1.84; beta for attended value = -1.90, tstatistic = -0.29; beta for unattended value = -5.38, t-statistic = 1.26). Furthermore, the duration of the first fixation was not related to the value of the bundle (mixed-effects regression of first fixation length on an indicator for whether the item is appetitive and the value of the bundle: beta of indicator = -64.44, statistic = -5.31; beta for value of bundle = -0.35, t-statistic = -0.11) or the difficulty of the choice (mixed-effects regression of first fixation length on an indicator for whether the item is appetitive and the absolute value of the bundle: beta of indicator = 64.44, tstatistic = 5.26; beta for absolute value of bundle = -1.49, t-statistic = -0.32). Clearly, the duration of the first fixation was not dependent on value.
choice (analogous mixed-effects regression: beta for indicator = -61.50, tstatistic = -3.78; beta for absolute value of bundle = -21.61, t-statistic = -2.25). Again, even though we found a significant effect here, the effect was quite small in size as a move from the most difficult choice, with bundle value 0, to the simplest, with an absolute bundle value of 3, only corresponds to a change in fixation duration of -65 ms.
Together, the results in this section suggest that the properties of the observed fixation process are largely consistent with the assumption that fixations are independent of changes in the value of specific attributes (e.g., example, changing a mildly appetitive item for a highly appetitive one). In addition, as shown in Figure S1, there is considerable variation in the duration of fixations across trials. This, together with the tests supporting the existence of a small but significant attentional bias, suggests that fluctuations in attention might be responsible for some of the observed differences in choices.
Model Predictions. The maDDM makes additional predictions about the pattern of the fixations, and their relationship to choices, which we test here.
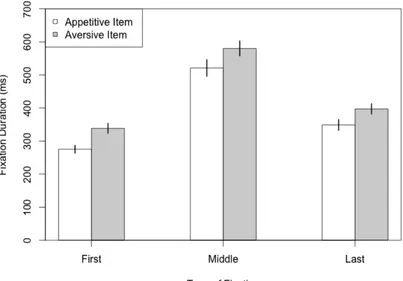
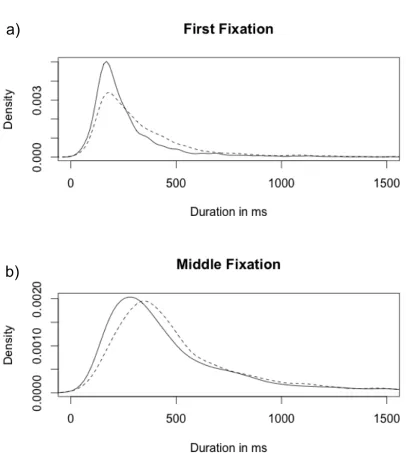
First, the model predicts that final fixation durations should be shorter than middle fixation, since final fixations are terminated prematurely when a barrier is crossed. As shown in Figure 4, this also holds in our data (mean last = 376 ms; mean middle = 550 ms; p < 0.01).
ex-ante prediction about the relationship between these two types of fixations, this pattern was incorporated in our prediction exercise, since fixation durations were conditioned on whether a fixation was first or later.
Second, the model predicts a strong relationship between the fixation-averaged value at the start of the final fixation and the duration of the final fixation, conditional on the choice made. Specifically, the model predicts that conditional on a “no” choice, the duration of the final fixation should increase with the variable
FP(β0 + δβPVP + θβNVN) + (1 - FP)(β0 + θβPVP + δβNVN),
where FP denotes the fraction of the trial spent attending to the appetitive item (as of the beginning of the last fixation). Essentially, this variable measures the average slope of the RDV signal during the initial phase of the choice, given the realization of fixations up to that point. The intuition for this relationship illustrates the key forces at work in the maDDM, and are best seen using a hypothetical case in which βP=βN=1, VP = -VN, and
To test this prediction, we estimated a mixed-effects regression of final fixation duration on the final fixation average value variable, for trials in which the subjects choose “no.” Consistent with the prediction, we found a significant effect between the two (slope = 33.87, t-statistic = 4.22). The model makes an analogous prediction for trials in which the subject chooses yes, albeit with the opposite sign, which was also present on the data (slope = -24.17, t-statistic = -2.43).
These results demonstrate that several key predictions regarding the pattern of fixations and their relationship to choices hold in the data.
Choice Biases. When θ < 1 < δ, the maDDM predicts a number of attentional driven biases, that we test in this section. This provides an additional set of model tests, which we also carried out.
of the appetitive food weighted by its share of relative attention (slope = 0.37, p < 0.05), and a significant decrease in the probability of saying yes with the value of the aversive item weighted by its relative attention (slope= -0.56, p < 0.01). Similar effects were found in the simulated data (constant = .11, p < 0.01; slope bundle rating = 0.62, p < 0.01, slope weighted value appetitive item interacted with relative fixation time = 0.07, p < 0.01; slope weighted value aversive item interacted with relative fixation time = -0.52, p < 0.01).
It is worth emphasizing that, despite the small effect of the fixation bias coefficients (θ and
δ), the resulting choice biases need not be small. To see why, consider an example in which suppose the bundle liking rating is 0, the appetitive attribute has a rating of 2, the aversive attribute has a rating of -2, and the value weights take the mean value over all subjects. Our estimate predicts that when an individual spends 10% of the trial attending to the appetitive attribute, there is only a 23.9% chance of agreeing to consume the bundle; however, if that individual instead spends 90% of the trial attending to the appetitive attribute, the probability of responding “yes” increases to 52.4%. In contrast, in a model without a fixation bias (θ = δ = 1), this change in the fixation pattern has no effect on the choices.
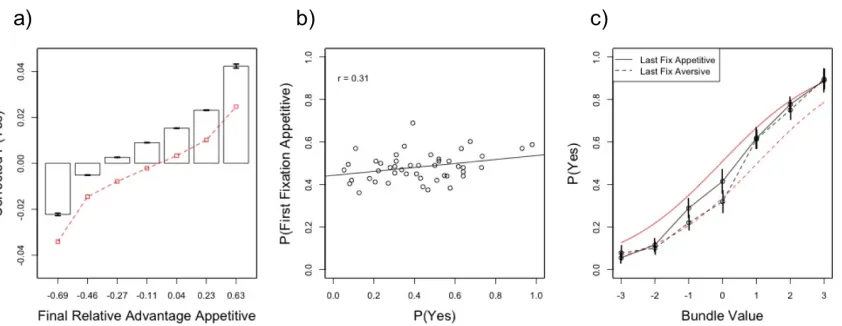
that bundle rating. We then estimated a linear regression of the corrected choice probabilities on the relative time advantage to the appetitive item and found the predicted effect in both the simulated data (slope = 0.04; p < 0.01) and the data (mixed-effects regression slope = 0.04, t-stat = 3.56).
Third, the model predicts that the longer the first fixation is to the appetitive item, interacted with its weighted value, the more likely the subject is to choose “yes.” To see why, note that longer first fixations move the RDV signal towards the “yes” barrier, which all else equal biases choices towards “yes.” To test this, we estimated a mixed-effects logistic regression of choice on the duration of the first fixation, conditioning on a first fixation to the positive attribute, and found the predicted effect in both the data and the simulations (simulated model: slope = 0.0009, p < 0.01; data: slope = 0.0017, p < 0.01). We also found the analogous effect for first fixations to the aversive item (simulated model: slope = -0.0010, p < 0.01; data: slope = -0.0017, p < 0.01).
In a related result, any initial biases in the first attended attribute should translate into choice biases. Figure 5B shows that this is the case: a linear regression of the probability that a subject looks first at the appetitive food first on the subjects’ average probability of choosing shows a significant positive relationship (slope = 0.09; p < 0.04).
prediction stems from the fact that the slope of the RDV signal is more likely to be positive, and thus climbing towards the “yes” barrier, during fixations to the appetitive item.
We estimated a logistic regression of choice on a constant, the bundle liking rating, an indicator variable for when the last fixation is to the appetitive item, and the interaction of the bundle liking rating with the indicator variable, in the simulations and the actual data. In the simulations, we found a significant effect of the identity of the final fixation (beta = 0.71, p < 0.01), but not of the interaction term (beta = -0.00, p = 0.87). A similar pattern was found in the data (last fixation bias to positive indicator: beta = 0.21; p = 0.06; interaction term: beta = 0.03; p = 0.60). As shown in Figure 5C, although these biases are small, they follow a quantitatively similar pattern in the model predictions and data.
Discussion
The results described here suggest the maDDM is accurately able to describe the choice process in a simple multi-attribute environment. Specifically, the model quantitatively describes the relationship between choices, response time, and the correlation of these variables with attentional deployment, as measured by fixations. The data suggest that individuals increase the weight of an attended attribute by 5% and decrease the weight of an unattended attribute by 10%. Consistent with this estimation, a number of attention-based choice biases found in the data support the model’s predictions.
process, we were surprised by its relatively small effect size. Notably, previous findings have estimated that only 30% of an unattended option’s value is accounted for during the choice process (Krajbich & Rangel, 2011). There are several possibilities that can explain this finding. First, as our model is one of the first applications to model the fixation bias in attributes rather than options, it’s possible the fixation bias over attributes is simply smaller than over options. Second, our task forces subjects to accept or reject an outcome. If they were instead making choices over two or more bundles, a larger bias may be prevalent. Understanding how the size of the bias changes with the task is an important step for future work.
One limitation of our results is that we applied the maDDM to a scenario with a relatively small number of attributes. Many real-world decisions are likely more complex than our bundle choices. We chose this simple design for several reasons. First, we wanted to understand how the maDDM could be applied to the simplest possible multi-attribute choice scenario, an important feature when understanding whether and how these models may break down as the task becomes increasingly complex. Second, as the number of attributes and options on a screen grows, the model must be able to account for the fixation process between features. This is a complex task that may be a rich area for future work, but we currently lack a systematic understanding of how to model more than two fixations.
It is worth noting that in our results we find much evidence that has a qualitative flavor of loss aversion. Specifically, the duration of a fixation to an aversive attribute is on average longer than the duration to an appetitive one, individuals weight aversive attributes more heavily than appetitive attributes in choices, and aversive attributes are attended to for a longer period of time throughout the choice process. This differential attribute weighting is consistent with the literature on loss aversion (Kahneman & Tversky, 1984) while the differences in fixations to attributes are consistent with previous process tracking studies of loss aversion (Willemsen et al., 2011). This difference in fixation duration to the appetitive and aversive attributes can be further explained given that the amount of time one attends to a feature appears to influence its weight (Willemsen et al., 2011; Schkade & Johnson, 1989; Fiske, 1980; Wedell & Senter, 1997).
itself from previous work in the cognitive modeling of choice in a number of ways. While the existing aDDM literature has focused on understanding the role of fixations in multi-alternative choice (Krajbich et al., 2010; Krajbich & Rangel, 2011), it has remained silent as to how fixations affect attribute based value estimation. Our model takes a step towards understanding this process and extends the aDDM to this choice environment. Furthermore, while DFT has previously explored decision-making in multi-attribute choice, it has not incorporated eye fixations in understanding how attention to attributes alters an attribute’s perceived weights (Busemeyer & Townsend, 1992; Roe et al., 2001; Busemeyer & Diederich, 2002; Diederich, 1997). Our contribution is not to suggest that one model should be preferred to the other, but that we can accurately describe the choice process by utilizing tools from both of these literatures.
SI Methods
Subjects. Forty-six subjects recruited from the Caltech community participated in the experiment (63% male; mean age = 26.2). All subjects had normal or corrected-to-normal vision with the use of either contact lenses or glasses. Participants were paid a $5 show-up fee and received an additional $25 upon successful completion of the experiment. The study was approved by Caltech’s IRB.
Task. Subjects were asked to fast for four hours prior to the start of the experiment. Compliance was verified through self-report upon subject arrival, and was required for participation.
The experiment consisted of three tasks. Subjects were informed of this at the outset, but the tasks were only described to them just before they took place.
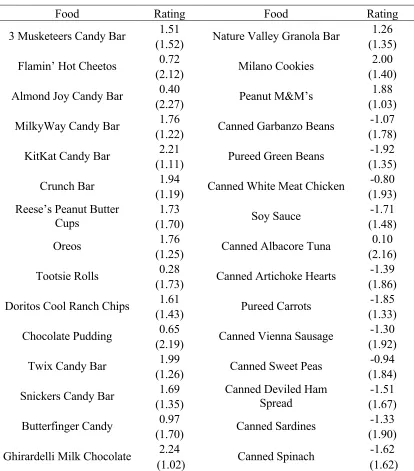
The foods were selected based on previous studies (Plassmann et al., 2007, Plassmann et al., 2010) and contained eighteen foods that were consistently rated as appetitive by previous subjects, and eighteen foods that were consistently rated as aversive. See Table S2 for details.
For every subject, we averaged the two ratings provided for each food in order to create subject-specific food classes. Snacks with a positive average rating were labeled as “appetitive,” snacks with a negative average rating were classified as “aversive,” and foods with a zero average rating were omitted from the remaining tasks. On average, subjects had 17 appetitive foods and 11 aversive foods.
In Rating Task 2, subjects saw bundles of two foods on the screen and had to provide liking ratings over the bundles, using the same integer scale (-3 to 3). In particular, subjects were asked to rate “How much would you enjoy taking at least three bites from both of the foods shown on the screen?” Every bundle contained one appetitive food and one aversive food from the previous round, and subjects could take as long as needed to enter their ratings. As shown in Figure 1, one of the items was shown in the left and the other on the right, with their location randomized every trial. The number of trials in this task varied across subjects, subjects were asked to rate every potential bundle made of one appetitive and one aversive food.
bites from each of the foods at the end of the experiment. Choices were indicated using a keyboard button press using the subject’s dominant hand with the index and middle fingers. Subjects could take as long as desired to make each choice. The choice task consisted of 200 trials, selected at random from the set of all possible bundles described above. Subjects were instructed that at the end of the experiment they would need to remain in the lab for an additional twenty minutes. During this time, one of the two hundred trials was randomly selected and their choice in that trial was implemented. This procedure encouraged subjects to give incentive compatible responses.
Importantly, we recorded eye movements throughout the task at 500 Hz using a desktop mounted SR research Eyelink 1000 eye tracker. The eye tracker was calibrated immediately after reading the instructions for this choice task.
The MLE procedure was conducted as follows.
First, we simulated the model 4000 times for each combination of the model parameters in the grid described below, and for each of the seven possible bundle ratings (ranging from -3 to -3). The simulations were carried out using 1 ms time steps.
In each simulation, individual liking ratings for both the appetitive and aversive foods were drawn from the empirical distribution of liking ratings conditional on the rating of the bundle. Furthermore, once a pair of liking ratings was drawn, we chose subject-estimated regression weights (β0, βP, and βN) associated with the randomly selected simulated liking ratings. For instance, if the drawn liking rating for the appetitive item and the aversive item was drawn and belonged to subject i, then subject i’s regression weights were used throughout the simulated trial.
transition times, and add that sampled transition time to the simulated total fixation time. To clarify, in every trial we have a response time (the length of time from stimulus onset to response) and total time spent fixating to both items. We say the transition time is the difference between these two variables, and the sum of the transition time and total simulated fixation time represents the simulated reaction time in a trial.
Second, we used the simulations to compute the likelihood of each observation, for each vector of parameters, as follows. Reaction time was discretized into bins of 100 ms, from 0 to 7500 ms, with an additional bin representing a trial that took longer than 7500 ms. Choice data is automatically discretized into yes/no bins. We then used the simulation results, conditional on the bundle rating, to compute the frequency with which responses followed into each time-choice bin.
Third, we used the data from the previous step to compute the log-likelihood of the data for each vector of parameters, and carried out a grid search to identify the vector of parameters with the largest maximum likelihood.
To reduce computational costs, this maximization was done in two steps. In step one we first did a coarse search over the following parameter space:
d in {0.0001, 0.0005, 0.001, 0.0015, 0.002, 0.0025}
σ in {0.005, 0.01, 0.02, 0.025}
θ in {0.85, 0.9, .95, 1}
which identified (d = 0.0015, σ = 0.02, δ = 1.05, θ = 0.95) as the parameters that maximized the log-likelihood. In step two we did a finer search around this vector using the grid:
d in {0.001, 0.0011, 0.0012, 0.0013, 0.0014, 0.0015, 0.0016, 0.0017}
σ in {0.015, 0.0175, 0.02, 0.0225}
δ in {1, 1.025, 1.05, 1.075, 1.1, 1.125 1.15}
References
Armel, C., Beaumel, A., & Rangel, A. (2008). Biasing Simple Choices by Manipulating Relative Visual Attention. Judgment and Decision Making, 3, 5, 396- 403.
Britten, K.H, Shadlen, M.N., Newsome, W.T., & Movshon, J.A. (1992). The Analysis of Visual Motion: A Comparison of Neuronal and Psychophysical Performance. Journal of Neuroscience, 12, 4745-4765.
Busemeyer, J.R. & Diederich, A. (2002). Survey of Decision Field Theory. Mathematical Social Science, 43, 345-370.
Busemeyer, J.R. & Johnson, J.G. in Handbook of Judgment and Decision Making (eds Koehler, D. & Narvey, N.) 133-154 Blackwell Publishing Co., New York, 2004. Busemeyer, J.R., & Townsend, J. (1993). Decision Field Theory: A DynamicCognitive
Approach to Decision Making in an Uncertain Environment. Psychological Review, 100, 432-459.
Camerer, C., and Johnson, E. J. (2004). “Thinking about attention in games: backward and forward induction,” in The Psychology of Economic Decisions, eds J. Carillo and I. Brocas (New York: Oxford University Press), 111–129.
Egly, R., Driver, J., & Rafal, R.D. (1994). Shifting Visual Attention Between Objects and Locations: Evidence from Normal and Parietal Lesion Subjects. Journal of
Experimental Psychology: General, 123, 161-177.
Fehr, E. & Rangel, A. (2011). Neuroeconomic Foundations of Economic Choice: Recent Advances. Journal of Economic Perspectives, 25(4).
Fiske, S.T. (1980). Attention and Weight in Person Perception: The Impact of Negative and Extreme Behavior. Journal of Personality and Social Psychology, 38, 6, 889- 906.
Glimcher, P. & Fehr, E. Neuroeconomics: Decision Making and the Brain. Elsevier, London, 2014.
Glockner, A., and Herbold, A.-K. (2011). An eye-tracking study on information processing in risky decisions: evidence for compensatory strategies based on automatic processes. J. Behav. Decis. Mak. 24, 71–98.
Gold, J.I. & Shadlen, M.N. (2007). The Neural Basis of Decision Making. Annual Review of Neuroscience, 30, 535-574.
Hare, T., Camerer, C., & Rangel, A. Self-control in decision-making involves modulation
Hare, T.A., Schultz, W., Camerer, C., O’Doherty, J., Rangel, A. (2011). Transformation of Stimulus Value Signals into Motor Commands During Simple Choice. PNAS: Proceedings of the National Academy of Sciences of the United States of America,
108, 18120-18125.
Heekeren, H.R., Marrett, S., & Ungerleider, L.G. (2008). A General Mechanism for Perceptual Decision-Making in the Human Brain. Nature, 431, 859-862.
Horstmann, N., Ahlgrimm, A., and Glockner, A. (2009). How distinct are intuition and deliberation? An eye-tracking analysis of instruction induced decision modes. Judgm. Decis. Mak. 4, 335–354.
Johnson, E.J., Schulte-Mecklenbeck, M., & Willemsen, M.C. (2008). Process Models Deserve Process Data: Comment on Brandstätter, Gigerenzer, and Hertwig
(2006). Psychological Review, 115, 1, 263-273.
Kahneman, D. & Tversky, A. (1984). Choices, Values and Frames. American Psychologist, 39, 341-350.
Kim, B.E., Seligman, D., & Kable, J.W. (2012). Preference Reversals in Decision Making Under Risk are Accompanied by Changes in Attention to Different Attributes. Frontiers in Neuroscience, 6, 109.
Krajbich, I., Armel, C., & Rangel, A. (2010). Visual Fixations and Comparison of Value in Simple Choice. Nature Neuroscience, 13, 1292-1298.
Krajbich, I., Lu, D., Camerer, C., & Rangel, A. (2012). The Attentional Drift Diffusion Model Extends to Simple Purchasing Decisions. Frontiers in Cognitive Science, 3, 193.
Krajbich, I., & Rangel, A. (2011). A Multi-Alternative Drift Diffusion Model Predicts the Relationship Between Visual Fixations and Choice in Value-Based Decisions.
Proceedings of the National Academy of Sciences, 108, 13853-13857.
Lim, S.L., O’Doherty, J., & Rangel, A. (2011). The Decision Value Computations in the vmPFC and Striatum Use a Relative Value Code that is Guided by Visual
Attention. Journal of Neuroscience, 31, 13214-13223.
Mas-Colell, A., Whinston, M., & Green, J. Microeconomic Theory Cambridge University Press, Cambridge, 1995.
Plassmann, H., O'Doherty, J., & Rangel, A. Appetitive and aversive goal values are
encoded in the medial orbitofrontal cortex at the time of decision making. Journal
of Neuroscience, 2010, 30:10799-10808.
simple economic transactions. Journal of Neuroscience, 2007, 27(37):9984-88.
Posner, M.I., Nissen, M.J., & Ogden, W.C. (1977). Attended and Unattended Processing Modes: The Role of Set for Spatial Location. Modes of Perceiving and Processing Information Hillsdale, N.J.: Erlbaum, 137-157.
Rangel, A. & Clithero, J.A. (2013). The Computation of Stimulus Values in Simple Choice. Neuroeconomics: Decision-Making and the Brain, 2nd ed. (edited by Paul Glimcher and Ernst Fehr), 125-147.
Ratcliff, R. (1978). A Theory of Memory Retrieval. Psychological Review, 85, 59- 108.
Ratcliff, R. (1980). A Note on Modeling Accumulation of Information When the Rate of Accumulation Changes over Time. Journal of Mathematical Psychology, 21, 2, 178-184.
Ratcliff, R., Cherian, A., & Segraves, M. (2003). A Comparison of Macaque Behavior and Superior Colliculus Neuronal Activity to Predictions From Models of Two- Choice Decisions. Jounral of Neurophysiology, 90, 1392-1407.
Ratcliff, R., & McKoon, G. (1982) Speed and Accuracy in the Processing of False Statements About Semantic Information. Journal of Experimental Psychology: Learning, Memory, and Cognition, 8, 1, 16-36.
Ratcliff, R. & Smith, P. (2004). A Comparison of Sequential Sampling Models For Two- Choice Reaction Time. Psychological Review, 111, 333-367.
Roe, R.M., Busemeyer, J.R., & Townsend, J.T. (2001). Multialternative Decision Field Theory: A Dynamic Connectionist Model of Decision Making. Psychological Review, 108, 2, 370-392.
Russo, J.E. & Dosher, B.A. (1983). Strategies for Multiattribute Binary Choice. Journal of Experimental Psychology: Learning, Memory, and Cognition, 9, 4, 676-696.
Russo, J.E. & Rosen, L.D. (1975). An Eye Fixation Analysis of Multialternative Choice. Memory & Cognition, 3, 267-276.
Schkade, D. & Johnson, E.J. (1989). Cognitive Processes in Preference Reversals. Organizational Behavior and Human Decision Processes, 44, 203-231.
Usher, M. & McClelland, J.L. (2001). On the time course of perceptual choice: The leaky competing accumulator model. Psychological Review, 108, 550-592.
Wedell, D.H. & Senter, S.M. (1997). Looking and Weighting in Judgment and Choice. Organizational Behavior and Human Decision Processes, 70, 41-64.
Willemsen M.C., Böckenholt, U., & Johnson, E.J. (2011). Choice by Value Encoding and Value Construction: Processes of Loss Aversion. Journal of Experimental
Figure 1
Figure 2
Figure 3
Figure 4
Figure 5
Table S1
Percent of First Fixations to Each Item A. Spatial
Left Right
Percentage 64.4 35.6
(22.1) (22.1) B. Attribute of Interest
Appetitive Aversive
Percentage 48.2 51.8
(6.6) (6.6)
Table S2
Food Rating Food Rating
3 Musketeers Candy Bar 1.51 Nature Valley Granola Bar 1.26
(1.52) (1.35)
Flamin’ Hot Cheetos 0.72 Milano Cookies 2.00
(2.12) (1.40)
Almond Joy Candy Bar 0.40 Peanut M&M’s 1.88
(2.27) (1.03)
MilkyWay Candy Bar 1.76 Canned Garbanzo Beans -1.07
(1.22) (1.78)
KitKat Candy Bar 2.21 Pureed Green Beans -1.92
(1.11) (1.35)
Crunch Bar 1.94 Canned White Meat Chicken -0.80
(1.19) (1.93)
Reese’s Peanut Butter Cups
1.73 Soy Sauce -1.71
(1.70) (1.48)
Oreos 1.76 Canned Albacore Tuna 0.10
(1.25) (2.16)
Tootsie Rolls 0.28 Canned Artichoke Hearts -1.39
(1.73) (1.86)
Doritos Cool Ranch Chips 1.61 Pureed Carrots -1.85
(1.43) (1.33)
Chocolate Pudding 0.65 Canned Vienna Sausage -1.30
(2.19) (1.92)
Twix Candy Bar 1.99 Canned Sweet Peas -0.94
(1.26) (1.84)
Snickers Candy Bar 1.69 Canned Deviled Ham Spread
-1.51
(1.35) (1.67)
Butterfinger Candy 0.97 Canned Sardines -1.33
(1.70) (1.90)
Ghirardelli Milk Chocolate 2.24 Canned Spinach -1.62
(1.02) (1.62)
Figure S1
C h a p t e r 2
INTERTEMPORAL CHOICES ARE CAUSALLY INFLUENCED BY RELATIVE ATTENTION
Many important choices involve tradeoffs between immediate and delayed rewards, and sound decision-making often requires delaying gratification. Examples include dietary choice (e.g., fruit or chocolate cake?), health behaviors (e.g., go to the gym or watch TV at home?), and saving (e.g., buy a new car or save for retirement?). Previous work has shown that we systematically struggle to delay gratification, that our ability to do so varies across decision contexts, and that there are sizable individual differences (1). Unfortunately, the mechanisms underlying the contextual and individual differences in discounting are not well understood.
Here we propose that variation in how attention is deployed during the choice process can account for a sizable portion of the behavioral differences across both contexts and individuals. In particular, we hypothesized that contextual variables that shift relative attention towards attributes favoring the patient option can induce a causal and sizable decrease on discount rates, and thus an increase in the ability to postpone gratification. Additionally, we hypothesized that individual differences in attentional patterns can explain a sizable portion of the individual differences in discount rates.
leaky-accumulator model (5), and Decision Field Theory (DFT) (6-8), provide accurate quantitative accounts of how choice probabilities and reaction times vary with the properties of the choice options, including intertemporal monetary choice tasks (9-10). These models all assume choices are made using a relative value signal that is dynamically computed by integrating instantaneous noisy measures of the desirability of the attributes associated with the two options, and that a choice is made when the accumulated relative value signal becomes sufficiently strong in favor of one of the two options.
Second, previous studies suggest that this integration process exhibits an attentional bias: options and attributes are weighted more heavily while they are attended. Examples include the attentional Drift-Diffusion Model (aDDM) (11-13) and DFT (6-8). These models assume the allocation of attention to the attributes and options are independent of the state of the relative value signal or of the values of the attributes. Thus, any variable that shifts attention towards attributes that favor choosing the delayed option (e.g., a contextual manipulation that affects the saliency of the delayed reward, or a systematic individual trait) can increase the likelihood of making a patient decision. Evidence consistent this assumption comes from work showing that fixations are affected by relative visual saliency, independent of value (14-15), and that choices can be manipulated by exogenously changing attention (16-17).
change. In contrast, we propose a significant fraction of the within and between subject variation is due to differences in attention. Second, an important goal of this literature is the design of policy interventions that increase people’s ability to delay gratification. Knowing whether changes in attention can have a sizable impact on the likelihood of making a patient choice is useful because ‘nudging’ or ‘re-training’ attention might be easier than changing more hard-wired preference parameters. Third, although there is a large literature demonstrating that context variables matter (18-21), we currently lack a systematic understanding for how these variables affect choices. Our proposal suggests a critical element of the problem is to understand how these contextual variables affect attention during the choice process.
We report the results of three laboratory experiments designed to test our hypothesis. The first experiment combines eye tracking with a common intertemporal choice task in which subjects choose between smaller-sooner and larger-later monetary rewards. The experiment tests the hypothesis that variation in relative attention, to different options and attributes, can explain a sizable fraction of the within and between subject variation in discount rates. The second and third experiments manipulate attention exogenously in order to test the causal impact of attention on intertemporal choice.
Experiment 1: Correlational Test
hypothesis that relative attention affects intertemporal choice? Second, are cross-trial fluctuations in relative attention associated with sizable changes in the likelihood of making a patient choice? Third, what fraction of the individual differences in discount rates can be explained by attentional differences?
Choices. Subjects chose the patient option 54.4% of the time (SD = 27.0%). The average value of the estimated hyperbolic discount parameter, 𝑘, was 0.009 (SD = 0.013), which is comparable with previous results using this task (1, 22-23). Both indices provide a measure of the extent to which subjects discount future rewards. As shown in Figure S1, the two measures are significantly correlated (𝛽 = -0.20, p < 0.001). For robustness, below we report results using both choice measures. Furthermore, there was significant variation in discount rates between subjects (percent patient: max = 91.6, min = 1.4, k: max = 0.055, min = 0.0002), which we exploit in several of the analyses below.
Average fixation patterns. We used fixations to each of the four regions-of-interest (ROIs) as a measure of attention to the individual attributes. Although it is well known that it is possible to attend to information without fixating on it, as demonstrated in the literature on covert attention (24-25), it appears unlikely that there is a large dissociation between the two in this task.
Subjects made an average of 7.0 fixations per-trial (SD = 3.8), which implies that, on average, they fixated to the ROIs displaying the different attributes more than once. The number of fixations was not significantly different in trials in which a patient or an impatient choice was made (p = 0.738, paired t-test). We estimated a mixed-effects linear regression of the number of fixations on trial difficulty and found a significant relationship (𝛽 = - 0.177, p < 0.01).
Table S1 summarizes the relative fixation time patterns across the four ROIs. Subjects spent more time looking at the upper fields in which the amounts were depicted than at the lower fields, which contained the delays (paired t-test, p < 0.001). Furthermore, there was not a significant difference between attending to the left and right locations (paired t-test, p = 0.126); however, subjects spent more time attending to the delayed option than the immediate option (paired t-test, p < 0.001). Finally, there was significant trial-to-trial variation for all ROIs, a fact that we exploit in the within subject analyses below.
Table S2 summarizes the pattern of first fixation locations across the four ROIs. The majority of first fixations were to the top-left location (p < 0.01, t-test of upper left ROI versus sum of all other 3 ROIs). It was rare for subjects to first fixate to one of the delays, as those always appeared in the bottom ROIs (p < 0.01, t-test of first looking at amounts versus first looking at delays). The vast majority of first fixations were to the amounts (p < 0.001, paired t-test). Given that amounts were always shown in the top location, we do not know if this is the result of a spatial bias or a top-down property of the attentional process in this class of tasks. There was a small bias towards first looking at the delayed option (p < 0.001, paired t-test), which suggests that subjects could identify the location of the delayed option through peripheral vision and use this information to influence the location of their first fixation before the information in the four ROIs had been sampled.
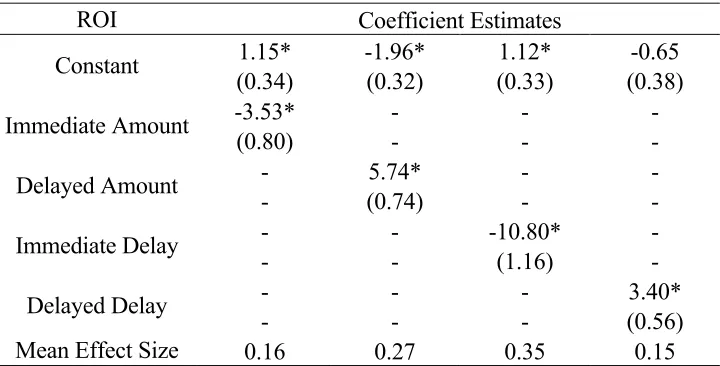
Within subject analysis. As shown in Table S1, relative fixations varied significantly from trial to trial. Here we investigate if this variation is associated with changes in the likelihood of making a patient choice, and if these changes are consistent with the predictions described above. Additionally, we quantify the size of these effects.
computed the mean predicted impact of changing relative attention in that ROI from the 10th to the 90th percentile of the observed distribution of relative attention. To calculate this, we sampled random trial numbers 1,000 times for each subject, with replacement. We then extracted the fraction of time that was spent attending to the ROI in that trial, and used the individually estimated regression weights to calculate the probability that the subject chose the patient option in that trial. Next, we calculated the 10th and 90th percentile of the distribution of the probability of a patient choice, and report the mean change over subjects, which we denote as the mean effect size.
Table 1 summarizes these results. Consistent with the predictions, shifting attention to the immediate delay decreased the likelihood of choosing the delayed option, and shifting attention to the delayed amount had the opposite effect. Importantly, the predicted effect sizes were substantial. For example, a shift from the 10th to the 90th percentile of the observed distribution of relative attention to the immediate delay decreases the probability of making a patient choice by 35%, as given by the mean effect size.
These results suggest that cross-trial variation in attention can explain close to 30% of subjects’ ability to choose the delayed outcome. The largest effects were found in the attentional differences to the immediate delay and the delayed amount, respectively.
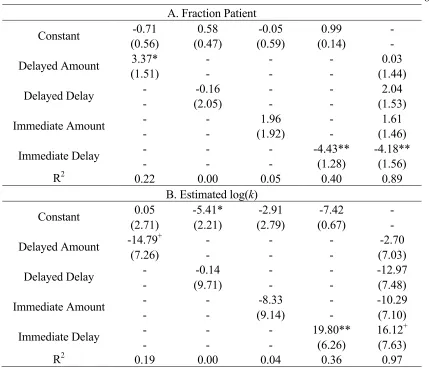
Between subjects analysis. Next we tested if between-subject differences in relative attention could explain a substantial fraction of the individual variation in discount rates. To do this, we first computed the average relative attention that each subject paid to each of the four ROIs. For each ROI, we estimated a linear regression of our subject-level measure of patience (either fraction of patient choices or log(k)) on the subject-level measure of relative attention paid to the ROI.
Table 2 reports the results. We found a positive correlation between the propensity to shift attention to the delayed amount and the likelihood of making a patient choice, and a negative correlation between the propensity to shift attention to the immediate delay and the likelihood of making a patient choice. In contrast, shifting attention to the immediate amount or later delay was not correlated with individual differences in discounting. Since the subject-level measures of attending to the different ROIs are correlated (min = -0.84, max = 0.17), we also estimated a linear model in which the four attentional measures were included. As shown in the right-hand column of Table 2, only the propensity to shift attention to the immediate delay was significantly correlated with individual differences in discount rates.
Two aspects of these results are worth highlighting. First, the results suggest that between 20% and 35% of the individual differences in discount rates can be explained using differences in the average relative propensity to look at different ROIs. Second, the results across subjects are consistent with those found in the previous section; in both cases the attentional variable that has the largest impact in explaining variation in patience is the propensity to shift attention to the immediate delay, followed by the propensity to look at the delayed amount.
Changes in fixations across trials. An important assumption of the models motivating the hypothesis tested here is that the allocation of attention is largely exogenous to the state of the choice process, and to the value of the attributes. More concretely, these models assume that fixations can be modulated by visual features of the stimuli (e.g., text versus numbers or spatial location), but not by the state of the relative value signal that drives the choice, or by the absolute or relative value of the attributes. This assumption is important because it implies that fluctuations in attention have a causal impact in the choice process, instead of being driven by it.
manipulations also have limitations, we finished the analysis of Experiment 1 by carrying out an indirect test of the orthogonality of attention.
The logic of the test is as follows. From the choice data, we know that the attribute values are correlated with the likelihood of choosing the patient option. Under the maintained hypothesis that choices are compatible with a sequential integration model, this implies that, on average, each of these variables should also be correlated with the state of the integrator across trials. Thus, if fixations were driven mostly by the state of the relative value signal, one would expect a strong association between the relative fixations and the attribute parameters across trials. Table S3 reports the results of this test. Importantly, in all cases the magnitude of the effects were quite small in size, contrary to what would be expected if attention were guided mostly by the state of the relative value signal, or by the relative value of the attributes. To quantify this, Table S3 also reports an estimate of the effect size, or the maximum percentage change in attention to each ROI that can be induced, which are also found to be relatively small.
Together, these analyses provide support for the hypothesis that some of the variation in attention is exogenous to the attribute values and to the comparison process used to make the choice. However, we emphasize that these tests cannot rule out the possibility that some of the attentional variation is endogenous, which highlights the importance of the last two experiments, where attention is manipulated exogenously.
The results of Experiment 1 demonstrate that variation in relative attention can account for a sizable fraction of the differences in discount rates, both within and across individuals. However, despite the evidence suggesting that a sizable fraction of the variation of attention is exogenous, the tests are purely correlational, and cannot rule out the possibility that the direction of causality runs in the opposite direction. The last two experiments were designed to address this issue.
Causal Test I. In Experiment 2 (see Figure 2 and SI Methods) we manipulated the relative attention paid to the different attributes and tested if this increased the likelihood that subjects made a patient choice. Here, subjects faced trials where they were forced to attend to the different attributes for a particular amount of time before they were allowed to enter their response. Relative attention was manipulated within subjects as each participant spent either more time fixating towards the amounts or more time fixating towards the delays depending on the trial. We manipulated exposure to amounts versus delays because the results of Experiment 1 suggest that this may affect patience, given the asymmetric impact of fixating on the immediate delay versus the other attributes.
choices in the other case. This amounts to a small, but significant, 4% increase in the number of patient choices as the result of the exposure manipulation (p < 0.03). A similar result was found when we examined at the estimated discount rates: the estimated log(𝑘) is -5.66 when amounts are shown for longer than delays and -5.32 otherwise. Again, the effect is small, but significant (p < 0.04). The direction of these effects was consistent with the predictions made based on the findings of Experiment 1.
Second, we carried out a similar analysis comparing the trials in which amounts were shown first to those trials in which delays appeared first. We did not find a significant order effect using either the percentage of patient choices (p = 0.40) or the estimated log(𝑘) (p = 0.14) indicating that total fixation time may play a larger role than order of fixations.
These results are consistent with the hypothesis that changes in relative attention to different attributes have a causal impact on the ability to make patient choices and suggests that some of the within and cross individual differences in discount rates, identified in Experiment 1, are due to attentional variation.
the previous experiment attention might not have varied as much across conditions as intended, perhaps because subjects made up their minds before the exposure time terminated.
Experiment 3 was designed to address this issue (Figure 3 and SI Methods). Here, subjects were free to fixate between the immediate and delayed outcomes, but once a specified accumulation time had been reached for an option, where one option was always chosen to have a larger accumulation time than the other, it was removed from the computer screen. We still manipulated attention to certain features on the screen, but we sought to create an environment where fixation and behavioral patterns more closely matched those in Experiment 1. Furthermore, this design allows us to test for the presence of an option-based bias, rather than an attribute-based bias, as the within subject results from Experiment 1 suggest the option-based bias may be dominant.
We first verified that the experimental manipulation successfully biased fixations towards the target option. Subjects spent 1.14 seconds (SD = 0.08) fixating to the target option and 0.30 seconds (SD = 0.00) fixating to the non-target option, indicating the manipulation was successful in altering relative attention, as measured by fixations.
delayed option first (p = 0.24). The average time spent on the trial before entering a response was 2.9 seconds (SD = 0.7), and only 10.5% of the trials terminated at the five-second mark. These results indicate that certain behavioral outcomes, particularly response times, were similar to those in Experiment 1.
We then compared choices across the two attentional conditions and found a causal effect: when the immediate option was the target, subjects made 41.5 patient decisions, but when the delayed option was the target, subjects made 46.6 patient decisions. This difference of 5.1 patient decisions is significant (t-test of difference, p < 0.01). The effect size appears quite large and suggests that the number of patient choices increases by 12.3 percent as attention is exogenously shifted away from the impatient and towards the patient option. Note that, as in experiment 1, the range of how patiently subjects chose in this experiment greatly varied (pooled across both conditions: minimum = 2.0%, maximum = 97.5%, mean = 44.0%, SD = 25.0%). Ultimately, this may lead to an underestimate of the effect size as subjects who have a preference to almost always choose the impatient, or patient, option may only have room to slightly alter behavior until they hit a barrier.
for 1000 experimental sessions, where each session consisted of the exact questions from Experiment 1. For each session, we drew a random number from the distribution of estimated effect sizes from Experiment 3, with replacement, and scaled that number to reflect the predicted effect size in the simulated data set. When the drawn effect size, d, was positive, we randomly chose d simulated patient choices to switch to impatient; when d was negative, we randomly chose d simulated impatient choices to switch to patient. Thus, we estimated how each drawn effect size would impact decisions if the effect size could be generalized to the choice set from Experiment 1. Next, we estimated k both before and after making these effect size changes and found the estimated k increased from 0.0089 to 0.0115 (p < 0.01), which predicts a sizeable shift towards impatient behavior. To quantify, while subjects would have, on average, made 93.0 patient decisions, the estimated effect of the manipulation decreases this to 81.8 patient choices. Repeating this simulation exercise an additional 150 times shows these results are not outliers in the distribution of test statistics (Fig. S2).
Discussion
option and between 20% and 35% of individual differences in discount rates could be explained by individual differences in the average relative propensity to look at different ROIs.
Since multiple alternative mechanisms are likely to affect the ability to delay gratification during intertemporal choice (26-28), we were surprised to find that between 20% and 35% of observed individual differences in self-control ability could be explained by differences in the deployment of relative attention. By comparison, previous studies have found that personality traits such as impulsivity or I.Q. can only explain around 13% and 5%, respectively, of individual differences in self-control (29-31).
deployment of attention, but the effect may be small. The results of Experiments 2 and 3, in which attention was manipulated exogenously, suggest that there is a causal effect from attention to intertemporal choice.
We view the results here as demonstrating that there is a causal and sizable impact of variation in relative attention on choice. However, we emphasize that, in our view, it is likely that some of the differences in attention across trials and subjects is endogenous, especially later on in the course of a trial. Designing clear measures of the exogenous and endogenous channels of influence, and how they evolve over the course of a decision, is a critical open question for future studies.
Reasuringly, Experiment 3 shows that a larger causal effect takes place under an alternative attentional manipulation. Given the differences between Experiments 2 and 3, it is difficult to precisely pinpoint why Experiment 3 has a larger effect size than Experiment 2. For instance, it may be related to testing for an option versus attribute bias, differences in exposure time, or differences in the choice response process. It’s possible that altering any of these parameters in the experiment can lead to even larger effect sizes than those we observe.
model fitting and testing, including a formal comparison of the various types of attentional biases that have been proposed by different types of models. This could not be done with the current design, as it requires decorrelating the different attributes and a larger number of trials. However, previous applications using the DDM, the aDDM, and other sequential integrator models have demonstrated the potential of this approach.
Second, our results build on a large body of work which has shown that individuals seem to exhibit hyperbolic discounting in intertemporal choice, which can lead to difficulties in delaying gratification when one of the options entail an immediate reward (1, 22-23, 39). One critical finding in this literature is that discount rates are not constant, and instead decrease with distance to the present. The results of Experiment 1 show that shifts in attention towards the immediate delay attribute had an especially strong impact on discount rates. This suggests that some of the ‘hyperbolicity’ of the discount function might be attributable to attentional effects, and might be more sensitive to training and context than ‘deeper’ preference parameters.