M E T H O D
Open Access
Identification of novel prostate cancer
drivers using RegNetDriver: a framework
for integration of genetic and epigenetic
alterations with tissue-specific regulatory
network
Priyanka Dhingra
1,2, Alexander Martinez-Fundichely
1,2, Adeline Berger
3, Franklin W. Huang
4,5,6, Andre Neil Forbes
1,2,
Eric Minwei Liu
1,2, Deli Liu
1,7, Andrea Sboner
2,3,8, Pablo Tamayo
6,9,10, David S. Rickman
3,8,11*, Mark A. Rubin
3,8,11and Ekta Khurana
1,2,8,11*Abstract
We report a novel computational method, RegNetDriver, to identify tumorigenic drivers using the combined effects of coding and non-coding single nucleotide variants, structural variants, and DNA methylation changes in the DNase I hypersensitivity based regulatory network. Integration of multi-omics data from 521 prostate tumor samples indicated a stronger regulatory impact of structural variants, as they affect more transcription factor hubs in the tissue-specific network. Moreover, crosstalk between transcription factor hub expression modulated by structural variants and methylation levels likely leads to the differential expression of target genes. We report known prostate tumor regulatory drivers and nominate novel transcription factors (ERF, CREB3L1, and POU2F2), which are supported by functional validation.
Keywords: Tissue-specific regulatory network, Cancer drivers, Single nucleotide variants, Structural variants, DNA methylation, Prostate cancer
Background
Cancer is a disease of the genome, characterized by un-controlled growth and survival of damaged cells [1]. Pros-tate cancer (PCa) is the second most common cancer in men worldwide [2]. Whole-exome sequencing and whole-genome sequencing (WGS) of tumors has revealed
recurrent genomic alterations in PCa [3–8]. Genomic
alterations range from single nucleotide variants (SNVs) to large structural variants (SVs) [5, 9, 10]. SVs include deletions, insertions, duplications, inversions, transloca-tions, and other complex rearrangements. The most com-mon genomic alteration identified in prostate tumors is
the fusion of the 5′untranslated region ofTMPRSS2with ERGcaused by deletions or translocations, which is found in 40–50% of samples [3, 11, 12]. Other frequent alter-ations include: chromosomal deletions involving loss of NKX3.1 [13, 14], PTEN [15–17], TP53, CHD1, or CDKN1B[18]; genomic gains of chr 7 and 8q; and focal
amplifications of MYC, PIK3CA, FGFR1, and WHSC1L1
[3]. Additionally, recurrent SNVs have been identified in SPOP, FOXA1,TP53,MED12,IDH1, andPTEN[3, 5–8]. These known genomic alterations affect the genes in-volved in prostate development, cell cycle signaling, chro-matin modification, androgen signaling, and many other processes [4]. Further, these alterations lead to substantial heterogeneity in tumor samples and have been used to
de-fine PCa molecular subtypes based on fusion ofETS
fam-ily genes (ERG, ETV, ETV4, or FLI1) and mutations in SPOP,FOXA1, orIDH1[3].
* Correspondence:[email protected];[email protected] 3
Department of Pathology and Laboratory Medicine, Weill Cornell Medical College, New York, New York 10065, USA
1Department of Physiology and Biophysics, Weill Cornell Medical College, New York, New York 10065, USA
Full list of author information is available at the end of the article
Other than genomic changes, epigenetic alterations such as changes in DNA methylation, histone modifications, and chromatin organization (e.g., nucleosome remodeling and chromatin looping) impact gene expression and play an important role in the onset and progression of PCa
[19–21]. Among the different epigenetic changes, DNA
methylation is the most common and best characterized in PCa [3, 22–24]. Aberrant DNA methylation (hyper- or hypo-methylation) at promoter regions in PCa has been reported to be associated with gene expression changes
[25]. For example, down-regulation of GSTP1 activity in
PCa due to DNA hyper-methylation in the promoter re-gion has been associated with prostate carcinogenesis
[26]. Other genes that commonly exhibit
hyper-methylated promoters and have known implications in
prostate tumorigenesis include MGMT, CDKN2A, APC,
AR, and ER [22, 27]. Similarly, the high expression of
PLAUandCAGEgenes in prostate cells due to promoter
hypo-methylation [23] has been associated with increased tumor invasion and metastasis [22].
Although the individual lists of genetic and epigenetic alterations have greatly enhanced our understanding of prostate tumorigenesis, these events do not act in isola-tion and it is important to interpret their integrative glo-bal effects on differential gene expression in cancer. This is because various events can alter the expression of a gene (1) SNVs or SVs in (a) the coding sequence of the gene, (b) the transcription factors (TFs) that regulate it, or (c) the associated non-coding regulatory regions (pro-moters and enhancers) or (2) epigenetic changes at the promoters and enhancers. Previous studies have focused on the identification of individual categories of alter-ations that occur more than expected randomly, and thus likely constitute drivers of tumorigenesis –for ex-ample, SNVs [3, 6, 9, 28] or SVs [3, 11, 29]. However, these alterations act in concert to influence tumor growth and it is important to integrate the different cat-egories of alterations to identify the top candidates that are likely to play a major role in tumorigenesis by dysre-gulating thousands of genes, termed regulatory drivers. Here, we report a novel computational approach that makes use of tissue-specific regulatory networks to understand the global impact of genetic and epigenetic alterations affecting both coding and non-coding cis-regulatory regions (promoters and enhancers) and identify the regulatory drivers of tumorigenesis. Tissue-specific regulatory networks capture the molecular basis of gene regulation at a systems level and offer a unique means to understand the functional impact of genetic and epigenetic changes in TFs, their target genes, and non-coding cis-regulatory regions [30–32].
Regulatory networks are usually constructed using data from chromatin immunoprecipitation sequencing (ChIP-Seq) or gene co-expression assays. The networks
derived from ChIP-Seq data are limited by the availabil-ity of antibodies corresponding to TFs and the difficulty of interrogating multiple TFs in a tissue-specific manner. The largest human regulatory network constructed using ENCODE ChIP-Seq data consists of only 119 TF genes, is not specific for prostate tissue, and does not contain
important PCa TFs, such asERGandAR[30]. While
regu-latory networks based on gene co-expression overcome the problem of studying one TF at a time, they suffer from the limitation that network edges, which represent signifi-cant co-expression relationships between genes (nodes), often correspond to protein–protein interactions as op-posed to regulatory interactions [33]. Networks can be based on an alternative statistical measure, namely mutual information to detect dependence between every pair of
genes from RNA expression [34–37]. However, the edges
in both co-expression networks and those based on mu-tual information lack edge directionality (i.e., which TF gene is the regulator and which gene is regulated) and do not allow incorporation of cis-regulatory regions in the network. Overcoming these limitations, we report the use of DNase I hypersensitive sites (DHS) corresponding to accessible regulatory DNA regions to study directed tissue-specific regulatory interactions [38, 39]. Unlike pre-vious studies, our approach for DHS-based network con-struction is not restricted to TF–TF interactions [32], rather we model the interactions of TFs with both TF and non-TF target genes and incorporate regulatory regions (promoters and enhancers) assisting those interactions.
We combined DHS data from prostate epithelial
cells with other functional genomics data from
ENCODE and the Roadmap Epigenomics Mapping Consortium (REMC) [40] to construct a comprehensive prostate regulatory network [40, 41]. Previous studies have shown that genes encoding TFs often play an important role in tumorigenesis [42–45]. Targeting TFs that regulate a large number of genes (TF hubs) and act as drivers of cellular transformation from normal to malignant state
can offer novel therapeutic options [42]. While ERG and
ARare well known TF genes that play an important role
tumorigenic state. The large sample sizes used for this analysis provided the statistical power to detect and distinguish genes significantly altered by recurrent SNVs, SVs, or DNA methylation changes in their cod-ing or non-codcod-ing regions from the background of ran-dom passengers.
Thus, we present a novel computational method that integrates genetic and epigenetic data from tumor sam-ples and interprets the combined effects of coding and non-coding cis-regulatory regions significantly altered by SNVs, SVs, and DNA methylation on the tissue-specific regulatory network [5, 9, 48, 49].
Results
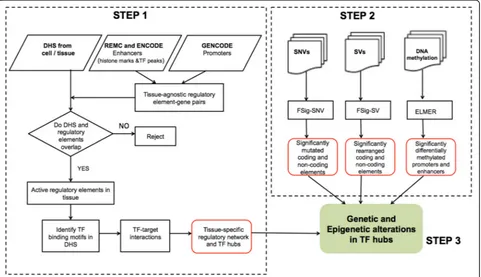
We developed a three-step computational model, RegNet-Driver, for identifying genetic and epigenetic alterations causing large perturbations in tissue-specific regulatory network. The steps are: (1) construction of a tissue-specific regulatory network using DHS data and identifica-tion of TF hubs, (2) the identificaidentifica-tion of significantly mutated, rearranged, and differentially methylated coding and non-coding regulatory regions, and (3) the interpret-ation of the global impact of genetic and epigenetic alterations in the regulatory network (Fig. 1). We applied our computational model on genetic and epigenetic data
from prostate tumor samples and identified regulatory drivers of prostate tumorigenesis.
Construction of the tissue-specific regulatory network using DHS data and identification of TF hubs
Mapping TF–target gene regulatory interactions in
prostate cells
Our pipeline for constructing the prostate network be-gins by identifying active cis-regulatory regions in pros-tate tissue. We identified 15,542 active promoters and 74,440 active enhancers using DHS in prostate epithelial cells (Methods). These numbers are consistent with current estimates of active promoters and enhancers in a tissue: ~10,000–15,000 promoters [50, 51] and ~44,000– 294,000 enhancers [40, 52, 53] depending on the tissue type. To uncover TF-DNA binding sites in these active regulatory regions, we used the PIQ (Protein Interaction Quantification) tool [54] and a curated collection of se-quence binding motifs for 617 TFs [55]. We find enrich-ment of 612 TF motifs in the active promoter and enhancer regions. This knowledge of enriched TF
bind-ing motifs was used to create TF–promoter and TF–
enhancer edges in the regulatory network. The active prostate promoters and enhancers with enriched TF binding motifs were associated with their target genes to
[image:3.595.59.540.398.675.2]model promoter–target gene and enhancer–target gene interactions (Methods).
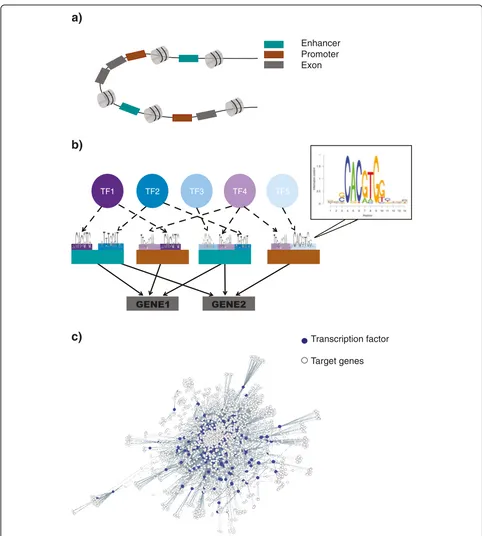
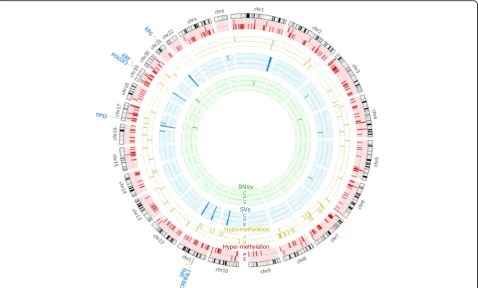
One enhancer can regulate the expression of multiple genes [53]–we find in our network each enhancer is asso-ciated with an average of three genes (Additional file 1: Figure S1a). Similarly, multiple enhancers can regulate the expression of a gene. In our prostate regulatory network, each target gene is associated with an average of five active enhancers (Additional file 1: Figure S1b). Thus, using our pipeline, we generated an extensive prostate regulatory net-work (Additional file 2), which contains 17,087 genes (in-cluding 612 TFs) (Additional file 3: Table S1) and 1,209,599 unique directed TF–target gene interactions (Fig. 2).
Validation of prostate regulatory network
Although systematic validation of all interaction edges is difficult due to the large scale of the network and our limited understanding of the true network [56], a com-mon approach is to use independent TF binding data from ChIP-Seq experiments [57]. We assessed the edges between TF and target genes using ChIP-Seq binding peaks for nine TFs (androgen receptor or AR [58], CTCF [59], ERG [29], ETS1 [60], ETV1 [61], GABPA [62], GATA2[63], NR3C1 [64], and TCF7L2 [65]). We report sensitivity, specificity, precision, and F score values for the predicted TF–target gene edges (Additional file 3: Table S2). For these nine TFs, we obtain an average sen-sitivity of 0.64 and specificity of 0.68. We note that ChIP-Seq data may not necessarily be the true gold standard due to the possibility of some edges labeled incorrectly as positive (non-specific TF binding) or nega-tive (undetected regions), which can impact the sensitiv-ity and specificsensitiv-ity of our network [57].
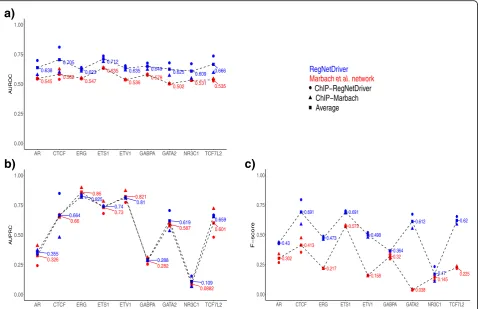
We also compared the performance of our methodology to construct the tissue-specific regulatory network with another method [57]. Marbach et al. developed a network compendium comprising 394 cell type- and tissue-specific gene regulatory networks for human, including a prostate epithelial cell network using TF sequence motifs from EN-CODE with promoter and enhancer activity data from the FANTOM project (http://regulatorycircuits.org) [57]. We compared the area under the receiver operator character-istic curve (AUROC), the area under the precision-recall
curve (AUPRC), and F score values of the Marbach
et al. predicted prostate TF–target genes with our
network predictions (Fig. 3, Additional file 1: Figure S2 and Additional file 3: Tables S2 and S3). Overall, we find
higher average AUROC, AUPRC and F scores from our
network for the TF–target gene edges compared to
Marbach et al. network (more details discussed in Methods). Also, we obtained overall higher AUROC and
AUPRC values for RegNetDriver predicted TF–promoter
and TF–enhancer edges in comparison to Marbach et al.
(see Methods and Additional file 1: Figure S3).
The agreement of TF network edges with ChIP-Seq binding peaks and the better performance of our net-work in comparison to Marbach et al. provide validation for our prostate regulatory network predictions and demonstrate the potential of our DHS-based network construction algorithm to recapitulate global transcrip-tional regulatory interactions.
TF hubs are enriched for known cancer genes
We evaluated the degree centrality distributions of the genes in our regulatory network to identify the hubs (Additional file 1: Figure S4b, c). Hubs are defined as the highly connected TF genes (top 25% out-degree central-ity) that regulate the expression of thousands of down-stream genes [48]. Our prostate regulatory network consists of 153 TF hubs (Additional file 3: Table S4), which are significantly enriched for known cancer genes (odds ratio, OR = 2.24; p value = 0.00074) (Methods). In particular, TFs previously implicated in PCa are hubs in our network: ERG, ETV1, ETV4, NR3C1, NKX3-1, ETV3, NRF1, TP53, STAT3, ETV5, MYC, and ETV6 [3, 4, 6, 9, 66]. Other than known PCa genes, our list of TF hubs also contains novel candidates, which may have a role in prostate tumorigenesis (Additional file 3: Table S4). Our prostate regulatory network represents the flow of information from TFs to target genes via regulatory ele-ments and provides a list of regulatory TF hubs. Next, we investigated the genetic and epigenetic alterations in coding genes and non-coding cis-regulatory elements to identify the ones that are likely to impact TF-hub ex-pression and cause large-scale network changes.
Identification of significantly mutated, rearranged, and differentially methylated coding and non-coding regulatory regions
Different genetic and epigenetic events can trigger global remodeling of the prostate regulatory network. In an at-tempt to understand the combined effects of different events, such as SNVs, SVs, and DNA methylation changes on prostate transcriptional machinery, we analyzed data from primary prostate tumor samples to identify signifi-cantly mutated, rearranged, and differentially methylated regions, respectively.
Significantly mutated coding and non-coding regions (FSig-SNV method)
a)
Enhancer Promoter Exon
TF1 TF2 TF3 TF4 TF5
Transcription factor
Target genes
b)
c)
[image:5.595.56.538.84.620.2]recurrent (present in multiple samples) and more func-tional mutations than expected randomly.
Our method combines the functional impact and pos-itional recurrence of the variants to compute a compos-ite score for each element. The functional impact score is computed using FunSeq2 [48, 67], a computational framework for annotating and calculating the functional impact score of coding and non-coding variants. FSig-SNV then compares the calculated composite score with
a null background to compute pvalues. The null
back-ground is computed from random combinations of an equal number of SNVs in the element [68, 69] (Methods). The output of the method is a list of signifi-cantly mutated coding and non-coding elements that show a higher than expected frequency of functional mutations across multiple tumor samples.
QQ plots show that the p values calculated using the
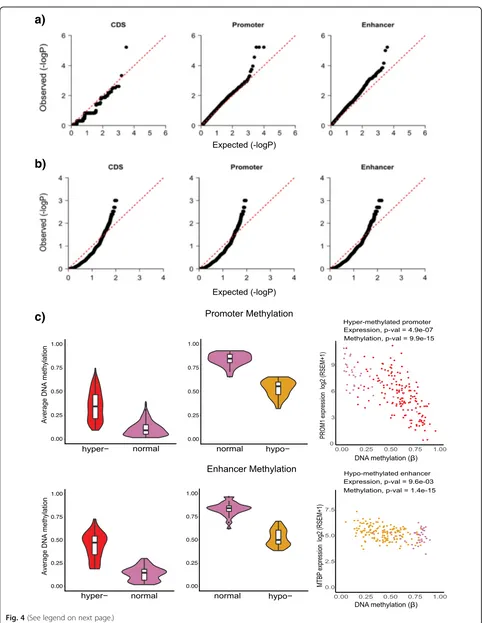
FSig-SNV method for coding regions, promoters, and enhancers follow the expected uniform distribution (Fig. 4a). Using FSig-SNV, we identified the coding
re-gion of a gene (SPOP), the promoters of three genes
(NBPF10,PDE4DIPandZNF595), and the enhancer of a
gene (HM13) to be significantly mutated (Fig. 4a). Con-sistent with previous PCa studies [3, 5, 6],SPOPis nom-inated by FSig-SNV as the most significantly mutated coding candidate (8% in our dataset).
In total, 42% of the tumor samples harbor at least one mutation in a significantly mutated element: the coding
region ofSPOPor the promoter ofPDE4DIP,NBPF10, or
ZNF595, or the enhancer of HM13. We note that while our analysis reveals the non-coding regions of PDE4DIP, ZNF595, and HM13 as significantly mutated in PCa for the first time, their coding regions have been previously implicated in prostate or other cancers [70–73].
Significantly rearranged coding and non-coding regions (FSig-SV method)
Given the important role of oncogenic fusions and chromosomal rearrangements in PCa, we next identified coding and non-coding regulatory regions significantly altered by SVs across multiple tumor samples. Briefly, our FSig-SV (Functionally Significant Structural Vari-ants) method begins with the identification of elements affected by deletion, insertion, duplication, inversion, or
0.326 0.66
0.86 0.73
0.821
0.282 0.587
0.0882 0.601
0.355 0.664
0.825
0.74 0.81
0.288 0.619
0.109 0.659
0.00 0.25 0.50 0.75 1.00
AR CTCF ERG ETS1 ETV1 GABPA GATA2 NR3C1 TCF7L2
A
UPRC
ChIP−RegNetDriver ChIP−Marbach Average
Marbach et al. network
RegNetDriver
0.545 0.582 0.547 0.635
0.536 0.578
0.502 0.531 0.535 0.638
0.705 0.623
0.712
0.635 0.649 0.625 0.609 0.666
0.00 0.25 0.50 0.75 1.00
AR CTCF ERG ETS1 ETV1 GABPA GATA2 NR3C1 TCF7L2
A
UR
OC
0.302 0.413
0.217 0.573
0.158 0.32
0.038 0.145
0.225 0.43
0.691
0.473 0.691
0.498
0.364 0.612
0.17 0.62
0.00 0.25 0.50 0.75 1.00
AR CTCF ERG ETS1 ETV1 GABPA GATA2 NR3C1 TCF7L2
F−score
a)
b)
c)
[image:6.595.60.539.88.397.2]a)
b)
c)
[image:7.595.57.539.82.705.2]translocation events. For each element, it counts the number of samples that exhibit an SV event and com-pares them with a null background generated by ran-domly shuffling SV breakpoints, keeping SV length and overall number of SVs in each chromosomal arm con-stant (Methods). The output of the method is a list of coding and non-coding elements that are rearranged in more samples than expected randomly. We ana-lyzed somatic SVs, which include copy number vari-ants (such as deletions and duplications), and copy number neutral variants (such as inversions, transloca-tions, and other complex rearrangements), from 188 PCa whole-genomes from ICGC and other published studies [5, 9, 47] (as discussed under FSig-SNV). Figure 4b shows the QQ plots for coding regions, promoters, and enhancers.
We identified 168 genes with significantly rearranged coding regions. This includes genes already implicated in
prostate tumorigenesis, such as PTEN, ERG, TMPRSS2,
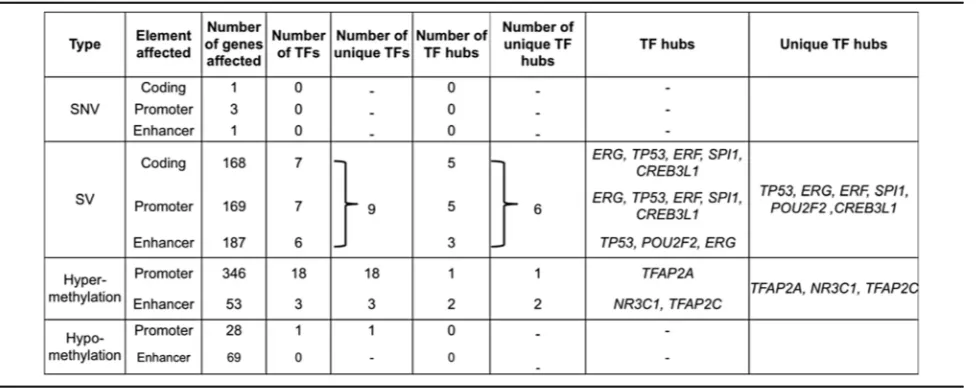
TP53, andFOXP1. In addition, we identified 169 genes with significantly altered promoters and 187 genes with cantly altered enhancers. Overall, 264 genes exhibit signifi-cant rearrangements in their coding or non-coding regions. Thus, using data from 188 whole genomes, we find that a much larger number of coding genes and non-coding regu-latory elements are affected by SVs (524) than SNVs (5) in PCa (Table 1 and Additional file 4: Tables S5–S7).
Significantly differentially methylated promoters and enhancers
DNA hyper-methylation at cis-regulatory regions is mostly associated with down-regulation of gene expres-sion, and hypo-methylation with up-regulation [74]. TCGA PCa study showed that genes silenced due to promoter hyper-methylation are significantly enriched for genes previously known to be differentially expressed in PCa [3]. Using HumanMethylation450 (HM450) array data corresponding to 333 TCGA primary prostate tumor samples and the ELMER (Enhancer Linking by Methylation/Expression Relationships) package [52], we identified 4,591 hyper- and 1,177 hypo-methylated pro-moter probes and 603 hyper- and 267 hypo-methylated enhancer probes (Fig. 4c). Using mRNA expression data
from the tumor samples, we determined putative target genes whose expression is modulated by differential methylation of probes (Methods). We found 346 genes significantly associated with hyper-methylated pro-moters, 28 genes with hypo-methylated propro-moters, 53 genes linked with hyper-methylated enhancers, and 69 genes with hypo-methylated enhancers (Wilcoxon rank-sum test,pvalue < 0.01) (Additional file 4: Table S8). In total, 496 genes are associated with differentially methyl-ated regulatory regions and are significantly enriched for genes found to be differentially expressed in PCa relative
to normal samples (Methods, Fisher’s exact test, p
value = 3.77 × 10⁻⁹, OR = 1.74). In Fig. 4c, we show ex-amples of genes whose expression is associated with methylation at their regulatory regions. Thus, we find that an even larger number of genes are affected by differential methylation than by SVs or SNVs (Table 1).
The list of genes with significantly mutated or rear-ranged coding or regulatory regions and those with differentially methylated promoters or enhancers is pro-vided in Additional file 4: Table S5. This list contains both known cancer genes and novel candidates that may play a role in prostate tumorigenesis. Next, we analyzed the impact of these significant genetic and epigenetic perturbations on the prostate regulatory network to identify the regulatory TF drivers.
Interpretation of the global impact of genetic and epigenetic alterations in the regulatory network
The results discussed under “Identification of signifi-cantly mutated, rearranged, and differentially methylated
coding and non-coding regulatory regions”show the
im-pact of genetic and epigenetic alterations on individual genes. We further analyzed the impact of these alter-ations in the context of the prostate regulatory network.
Common effects of distinct genetic and epigenetic changes on gene expression
To understand whether dysregulated gene expression can be a consequence of the combined effects of genetic and epigenetic changes, we analyzed the list of genes sig-nificantly altered by SNVs, SVs, and differential methyla-tion. Overall, 757 genes are significantly affected by (See figure on previous page.)
genetic or epigenetic alterations. Out of these genes, only three genes are affected by both genetic and
epigen-etic events: FAS, FAM3B, and TNFSF13. These three
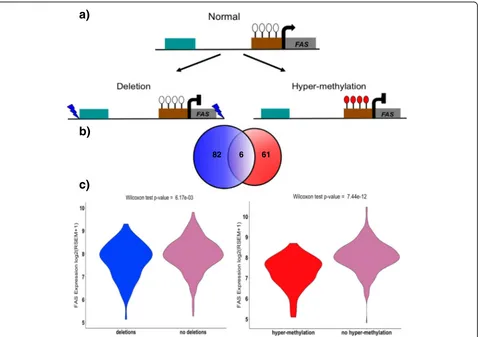
genes are in deleted loci covering the entire gene body and exhibit hyper-methylation in their promoter regions (Fig. 5a). To analyze the combined effects of these differ-ent evdiffer-ents on gene expression, we used RNA-Seq, DNA methylation, and deletion data from 333 TCGA tumor
samples. For FAS, we find 88 samples have undergone
gene deletion and 67 samples show significant hyper-methylation in the promoter region. However, 93% of
these samples have the FAS gene altered by either
methylation changes or deletion and only six samples exhibit both deletion of the gene and promoter hyper-methylation (see the Venn diagram in Fig. 5b). This high percentage of unique samples altered by each event sug-gests that genetic and epigenetic events independently
lead to FAS dysregulation in PCa samples. Indeed, we
find down-regulation of FAS in samples with deletions
vs. without (p value = 0.0061) and in samples with
pro-moter hyper-methylation vs. without (p value = 7.43 ×
10-12) (Fig. 5c and Additional file 1: Figure S5). FAS plays a central role in programmed cell death and is important for regulating cell proliferation and tumor-cell growth [75, 76]. We note that germline polymor-phisms leading to its dysregulated expression have been previously associated with a high risk of cancer, including PCa [75, 77, 78].
We obtained similar results for FAM3Band TNFSF13,
i.e., a high percentage of unique samples altered by either promoter hyper-methylation or deletion (Additional file 1:
Figure S6a and b).FAM3BandTNFSF13also have known
implications in cancer [79, 80] and their altered expression may have some role in prostate tumorigenesis. These results demonstrate that distinct genetic and
epigenetic events can independently lead to the same ef-fects on gene expression in PCa, though it is not common.
SVs have a stronger influence on TF hubs than SNVs and DNA methylation
Overall, we observe more TF genes are affected by methylation changes than SVs or SNVs (Table 1 and Fig. 6). Altogether, 22 TF genes show significant differ-ential methylation in promoter or enhancer regions, while nine are significantly altered by SVs and none by SNVs (Table 1). Although observed for the first time in the genome-wide analysis of TF genes, this is consistent with previous PCa studies, which report a low mutation rate in prostate tumors compared to other tumor types and found a high recurrence of SVs and DNA methyla-tion changes [3, 25, 81]. However, going one step further, we observe a stronger influence of SVs on TF hubs com-pared to methylation changes or SNVs. Out of nine TF
genes altered by SVs, six are hubs (ERG, TP53, ERF,
SPI1, CREB3L1, and POU2F2), whereas among 22 TFs with significant methylation changes, only three are TF
hubs (TFAP2A, TFAP2C, and NR3C1). Thus, we find
that TFs altered by SVs are significantly enriched for hubs compared to TFs altered by methylation changes
(Fisher’s exact test: OR = 11.28, p value = 0.0068)
(Table 1). We note that apart from TP53 and ERG,
which are known PCa genes, our list of TF hubs altered
by genomic and epigenomic changes include TFAP2A
[82],CREB3L1 [83], and ERF [84], which have some
re-ported implications in prostate tumorigenesis.
[image:9.595.57.547.98.293.2]Dysregulation of the central nodes in the network is likely to produce global effects on prostate transcrip-tional machinery and these numbers show that a larger number of TF hubs are likely to be dysregulated by SVs compared to methylation changes. Indeed, we find that
Table 1Genes affected by genetic and epigenetic alterations in their coding and non-coding elements
five out of six TF hub genes affected by recurrent SVs show differential expression between normal and tumor samples (ERG,TP53, ERF, CREB3L1, andPOU2F2) (see
Methods for p values, interaction edges shown in
Additional file 1: Figure S7). Altered expression of ERG
and TP53 due to gene fusions and deletions has already
been shown to play an important role in prostate tumorigenesis [85, 86]. We propose that the dysregu-lated expression of the remaining three TF hubs identi-fied in our study (ERF,CREB3L1, andPOU2F2) can also lead to large-scale changes in the prostate regulatory network, which in turn can play an important role in the transformation of normal cells to a tumorigenic state.
Next, we performed functional validation to under-stand the role of differential ERFexpression in prostate tumorigenesis.
Functional validation of novel prostate regulatory driver, ERF ERG and ERF are members of the ETS family of TFs. ERG is a transcriptional activator, whereas ERF is a tran-scriptional repressor whose interaction with ETS
binding sites can suppress ETS-associated
tumorigen-esis [87, 88]. We observe a significant increase in ERG
expression and a significant decrease inERFexpression
due to SVs (Additional file 1: Figure S8). Also, we find significant enrichment of common binding targets for ERG and ERF in our prostate regulatory network (com-mon targets = 3,061, Fisher’s exact test OR = 106.72 and p value < 2.2 × 10⁻⁶). Based on these results, we
hy-pothesized that a decrease in ERF expression in
pros-tate tumor samples can cause activation of the ETS transcriptional program similar to ERG activation. To
test our hypothesis, we used the ERF gene expression
signature generated from the lentiviral shRNA knock-down and RNA-Seq analysis of immortalized prostate epithelial cell line (LHS-AR) and a PCa cell line that
harbors oncogenic ERG rearrangement (VCaP) [89].
Among the top 100 up-regulated genes due to ERF
knockdown in the VCaP cell line (see Methods), 63 are present in our prostate regulatory network. Genes
up-regulated due to ERF knockdown in the VCaP cell line
are significantly enriched among both ERF and ERG
a)
b)
c)
61 6 82
[image:10.595.61.539.87.424.2]network predicted binding targets [Fisher’s exact test
OR = 2.38, p value = 0.00012 (ERF) and OR = 3.58, p
value = 5.7 × 10⁻⁷(ERG)]. Similar results were obtained for the LHS-AR cell line (Methods). The significant
en-richment of the ERFgene expression signature in ERF
and ERG binding targets validates our network predic-tions and supports our hypothesis that differential
ex-pression of ERF due to SVs can activate the ETS
transcriptional program in prostate tumor samples. This functional study demonstrates the strong poten-tial of our computational method to identify novel regu-latory drivers of tumorigenesis.
Network propagation of differential TF hub expression via methylation changes
Together, we find 7,675 differentially expressed genes in PCa samples relative to normal (Methods). However, it is unknown whether it is the genomic sequence changes or epigenetic alterations that initiate the cascade of gene expression changes in the prostate regulatory network.
The reversible nature of DNA methylation has attracted much attention towards understanding the mechanism by which it is regulated by TF binding. Whether methylation at TF binding sites is a consequence of TF gene expression
or methylation gain is a cause for evicting TF remains un-clear [90–92]. Based on the former hypothesis, multiple studies have proposed several models that have linked TF binding with acquisition or loss of methylation at regulatory elements [90–93]. We investigated the relation-ship between TF hub expression and DNA methylation at its binding sites. Using DNA methylation and expression data from 333 TCGA tumor samples, we calculated the correlation between the expression of six TF hub genes that are significantly altered by SVs (ERG,TP53,POU2F2, SPI1, CREB3LI, and ERF) and average DNA methylation
(β values) at differentially methylated probes within
specific TF motifs. We find a significant association (p value < 0.05) between expression and average DNA
methylation for three out of six TF hubs (ERG,
POU2F2, and SPI1). This significant correlation hints towards DNA methylation as a dynamic process that can be programmed to respond to changes in TF expression (Methods) (Additional file 1: Figure S9). Moreover, these results suggest that changes in TF hub expression due to SVs can trigger epigenetic changes at their binding sites in cis-regulatory regions, which would in turn lead to differential expression of their associated genes.
C P E
C P E
P E
P E
SNVs
SVs
Hypo-methylation
Hyper-methylation
[image:11.595.60.539.88.376.2]In our study, we observe that more TF hubs are per-turbed by SVs than SNVs or DNA methylation, even though a larger number of genes are affected by epigen-etic alterations. Significant associations between TF hub expression and methylation changes indicate a possible mechanism for network propagation of differential hub expression. We propose SVs as the initiators that per-turb the expression of hubs and DNA methylation changes as the propagators of gene expression changes in the prostate regulatory network. This model would explain the larger number of TF hubs altered by SVs but overall a larger number of genes affected by methylation changes. However, since correlation does not imply dir-ect causation, we functionally validated our hypothesis that altered expression of a TF hub can influence DNA methylation by Enhanced Reduced Representation Bisul-phite Sequencing (ERRBS).
Functional validation of impact of SVs on global DNA methylation
To substantiate our hypothesis that genetic changes such as SVs may be initiators that trigger changes in DNA methylation, we used the ERRBS assay for functional val-idation. ERRBS is a genome-wide single-base resolution DNA methylation assay that provides high coverage of CpGs [94–96]. Out of the six TF hub genes that are
per-turbed by SVs, ERG is rearranged at the highest
fre-quency (~45% of tumor samples). ERG rearrangements
result in its overexpression. To replicate the impact of SVs, we used two stable isogenic benign prostate epithe-lial cell lines (RWPE1), which only differ with respect to
ERG expression [97]. We used RWPE1-GFP (control)
and RWPE1-ERG cell lines to see ifERGoverexpression
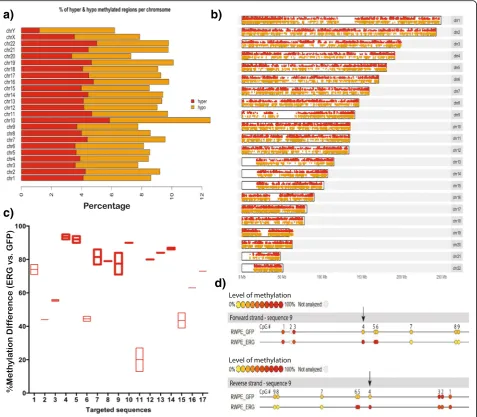
can lead to global methylation changes. To estimate the methylation levels, we performed ERRBS for both RWPE1-ERG and RWPE1-GFP cells. ERRBS provided tenfold sequencing coverage on >2.5 million CpG sites genome-wide for each cell line. By analyzing methylation levels of all CpG sites, we observe an overall significant difference in the DNA methylation level of the RWPE1-ERG cell line in comparison to the control. There are 226,677 differentially methylated CpGs (qvalue < 0.01), in-cluding 105,720 CpGs that are hyper-methylated and 120,957 CpGs that are hypo-methylated in the RWPE1-ERG cell line vs. the control (Additional file 1: Figure S10). Figures 7a and b show the distribution of hyper- and hypo-methylated CpGs on each chromosome. Overall, we find ~9% of the genome is differentially methylated as a result
ofERGoverexpression in RWPE1-ERG cells. Furthermore,
we used a site-specific methylation validation assay (EpiTY-PER MassARRAY system) to specifically measure the methylation at the top 17 hyper-methylated CpGs identi-fied from the ERRBS data in the RWPE1-ERG cells vs. GFP. We see a significant increase in the methylation for
RWPE1-ERG cells with respect to GFP for all the 17 CpG sites, providing independent validation for the ERRBS re-sults (Figs. 7c and d) (Wilcoxon test,pvalue = 3.28 × 10⁻¹⁰, Additional file 4: Table S9).
These results demonstrate that, within controlled iso-genic conditions, global methylation changes are
associ-ated with ERG overexpression. Therefore, our findings
provide further insights about the relation between TF hub expression and global methylation levels in prostate cells (discussed above), corroborating the role of gen-omic alterations in mediating changes in the epigenome.
Computational pipeline to identify regulatory drivers The protocol discussed in this work has been converted into a computational pipeline, RegNetDriver, to identify genetic and epigenetic alterations in the coding and non-coding regulatory regions of the tumor genomes and analyze their effects on tissue-specific regulatory networks (khuranalab.med.cornell.edu/RegNetDriver.html) (Fig. 1). In this study, we analyzed PCa genomes, but the pipeline can be easily used for different cancer types. We expect that analyses using the pipeline will reveal the varied roles of coding vs. non-coding and genetic vs. epigenetic alter-ations in diverse tumor types.
Discussion
demonstrates the use of a computational drug-repositioning approach for targeting TF activity using small molecules [102]. Thus, TF hubs predicted to be as-sociated with tumor progression by our approach can be potential novel therapeutic targets for cancer drug studies.
We identified 153 TF hubs in the prostate regulatory network. These are significantly enriched for known PCa genes and are predicted to play an essential role in
maintaining the prostate transcriptional machinery. The prostate regulatory network and the associated hubs dis-cussed in this work will be a useful resource for further investigations of other diseases involving the prostate tis-sue beyond the current study. In this study, we inte-grated our knowledge of the prostate regulatory network from normal cells with WGS and DNA methylation data from primary prostate tumors to analyze systematically how genetic and epigenetic alterations in coding and
a)
c)
b)
d)
[image:13.595.61.539.88.505.2]non-coding regions impact TF hubs and rewire the regu-latory network in tumor cells. Using novel computa-tional approaches (FSig-SNV and FSig-SV), we identify known PCa genes that are significantly mutated by SNVs
(SPOP) or rearranged by SVs (TMPRSS2, ERG, PTEN,
CHD1,NKX3-1, andTP53) and predict novel candidate
genes with significant SNVs or SVs in their coding or non-coding regions (promoters and enhancers). More-over, by analyzing DNA methylation profiles from tumor vs. normal samples, we identified genes with differen-tially methylated promoters and enhancers across mul-tiple tumor samples. This repertoire of genes with substantial genetic and epigenetic alterations is a useful resource of potential drivers whose role in prostate tumorigenesis can be further explored. In our work, we focused on TF hubs that show enrichment of genetic or epigenetic changes in their coding or non-coding regions and can act as regulatory drivers.
We find that overall a higher number of genes exhibit significant differential methylation at promoters and en-hancers than those that are significantly mutated or rear-ranged. However, TFs that are altered by SVs are significantly enriched for hubs compared to TFs altered by methylation changes, suggesting that SVs play a piv-otal role in PCa development by causing larger perturba-tions in the regulatory network compared to SNVs and methylation changes. The TF hubs that show differential
expression due to SVs are ERG, TP53, POU2F2,
CRE-B3LI, and ERF. Out of these, ERGand TP53 are known
PCa genes and we propose thatPOU2F2,CREB3L1, and
ERFcan also play an important role in prostate
tumori-genesis. Functional validation supports the hypothesis
thatERFdown-regulation leads to activation of the ETS
transcriptional program that mediates cell invasion and tumor development. Very recently, a study of the exomes of African-American PCa patients suggested the
role of ERF as a prostate tumor suppressor gene [89].
This study by Huang et al. provides independent valid-ation of the predictions of our method and shows its im-mense utility in identifying novel cancer drivers.
Based on the DNA methylation changes observed on
ERGoverexpression, we propose a model to explain the
consequences of TF hub dysregulation on the prostate regulatory network. In this model, crosstalk between TF hub expression (modulated by SVs) and DNA methyla-tion allows global expression changes in the network. Previous studies have discussed multiple models to ex-plain the crosstalk mechanism between TF expression and DNA methylation at its binding sites. One such model proposed that CpG islands at promoters can be protected from DNA methylation by TF binding [91]. In this model, higher TF expression would lead to in-creased recruitment of histone H3 lysine 4 (H3K4) methyltransferase, which protects the bound regions
from methylation [91]. On the other hand, higher TF
ex-pression has also been associated with
hyper-methylation [104, 105]. In this case, TF association with DNA methyltransferases promotes methylation at the bound regions. Thus, altered TF expression can be asso-ciated with both hypo- and hyper-methylation depend-ing on the TF and the physiological context [91]. We propose that SVs may be the initiators that perturb the expression of hubs and DNA methylation changes can be the propagators of gene expression changes in the regulatory network. We note that the functional
valid-ation in this study analyzed the consequences of ERG
and ERF expression changes on DNA methylation and
downstream gene expression respectively, but future work can probe the direct impact of SVs on methylation and target gene expression.
The framework proposed in this study can be used to analyze other cancer types. We expect that our computa-tional approach, RegNetDriver (provided at khuranalab.-med.cornell.edu/RegNetDriver.html), will be extremely useful for analyzing the ~2,800 tumor whole genomes, transcriptomes, and epigenomes of 40 tumor types from the upcoming Pan-Cancer Analysis of Whole Genomes project [106].
Conclusions
We provide a computational framework, RegNetDriver, to infer the global impact of tumorigenic genetic and epigen-etic alterations in the tissue-specific network and identify regulatory cancer drivers. The application of our method on PCa data shows that SVs have a stronger regulatory impact than SNVs and methylation changes. TF hub ex-pression modulated by SVs can, in turn, lead to methyla-tion changes. We identify known regulatory drivers (ERG andTP53) and nominate novel TF genes (ERF,CREB3L1, andPOU2F2) that are significantly rearranged across mul-tiple PCa samples and predicted to cause dysregulation of thousands of genes. Functional validation ofERFsupports its role in prostate tumorigenesis by activation of the ETS transcriptional program. RegNetDriver can be used to analyze other cancer types, and we expect SNVs, SVs, and methylation changes can play roles of varied importance in different tumor types and tissues.
Methods
The DHS-based prostate regulatory network
[55] to construct a prostate regulatory network. In the fol-lowing section, we describe the different steps involved in construction of the prostate network.
Identification of promoters and enhancers
We used tissue-agnostic regulatory elements and their association with target genes as described in the Fun-Seq2 protocol [67]. GENCODE v16 annotations were used and promoters are defined as being -2.5 kb from a transcription start site (TSS). To define tissue-agnostic enhancers, we used functional elements identified by ENCODE, which include regions of open chromatin as-sociated with histone marks (H3K4me1, H3K4me2, and H3K27ac) and significantly enriched for ChIP-Seq idtified TF-motifs [41]. Our list of tissue-agnostic en-hancers also includes regions of open and accessible chromatin where transcription-related factors can easily bind even without cognate sequence motifs, which are defined as regions with a high occupancy of TFs (HOT) in the work of Yip et al. [108]. All regulatory elements that are at least 1 kb from the closest gene according to GENCODE annotations were annotated as enhancers [67]. To associate enhancers with their potential regulatory tar-gets, we considered all candidate target genes within 1 Mb from enhancer regions. Correlations were calculated be-tween the activity/inactivity signal at the enhancer region and expression at candidate target genes. Enhancer histone marks, such as H3K4me1 and H3K27ac, were considered as activity signals and DNA methylation data were used as inactivity signals. If there were significant correlation
values, the matches were called enhancer–target gene
pairs. Bisulfite sequencing, ChIP-Seq, and RNA-Seq data from REMC across multiple tissues were used to calculate correlations between activity/inactivity signals and expres-sion data [67] (see Fu et al. [67] for more details).
To define active prostate promoters and enhancers, we intersected tissue-agnostic promoters and en-hancers with DHS of prostate epithelial cells obtained from ENCODE (https://www.encodeproject.org/experi-ments/ENCSR000EPU/). We found 15,542 active prostate promoter regions and 74,440 enhancer regions. In the next step, we identified TF motifs enriched in these active prostate promoters and enhancers.
Prediction of TF binding motifs
We used the PIQ software [54] to predict TF binding in the DHS data. PIQ uses machine learning to normalize input DHS data and predict TF binding by detecting the shape and magnitude of DNase profiles specific to a TF [54, 109]. It takes as input DNase-seq experiment data, the genome sequence of the organism assayed, and a list of TF motifs represented as position weight matrices. We provided PIQ with DHS data from epithelial cells of the prostate, the human genome sequence, and 2,065 TF
motifs for 617 TFs from ENCODE [55]. The output of PIQ is the probability of a TF binding at a motif in the genome. We selected all the active prostate promoters and enhancers with the predicted probability for the TF
binding at the motif being ≥0.7. We found significant
enrichment of 612 TF motifs in the active promoter and enhancer regions. This information was used to generate
TF–promoter and TF–enhancer edges in our network.
There are 629,263 TF–promoter edges and 267,415 TF–
enhancer edges in our network. In the last step, we com-bined the results of steps 1a (Identification of promoters and enhancers) and 1b (Prediction of TF binding motifs) to put together a prostate regulatory network.
TF–target gene interactions
All the active prostate promoters and enhancers enriched for TF binding motifs are used to make connections be-tween TFs and target genes. We used information of pro-moter–target gene and enhancer–target gene pairs from step 1a (Identification of promoters and enhancers) and TF binding motifs enriched in these regulatory elements from step 1b (Prediction of TF binding motifs) to make TF–target gene edges. The output of this three-step proto-col is an extensive prostate regulatory network, where nodes represent TFs, target genes, and regulatory regions (promoters and enhancers). The edges correspond to interactions between these nodes, i.e., TF–promoter, TF–
enhancer, promoter–target gene, and enhancer–target
gene. The complete prostate network contains 629,263 TF–promoter edges, 267,415 TF–enhancer edges, 15,465 promoter–target gene edges, and 69,422 enhancer–target gene edges. We used a simplified form of the prostate regulatory network for the degree centrality analysis dis-cussed in this work. The simplified prostate network con-tains only TF–target gene interactions. There are 17,087 genes in the prostate network, which includes 612 TFs. These 612 TFs are connected to target genes via 1,209,599 unique directed TF–target gene interactions.
Validation of TF–target gene edges in the network
in ChIP-Seq-based targets and negative otherwise. Thus, in our analysis, true positives (TP) refers to predicted TF– target genes, which are also TF ChIP-Seq-based targets, false positives (FP) are predicted targets that are not Seq-based targets and false negatives (FN) are ChIP-Seq-based targets not predicted by our network. Sensi-tivity (true positive rate or recall) = TP/(TP + FN), specificity (true negative rate) = TN/(TN + FP),
preci-sion (positive predictive value) = TP/(TP + FP), and F
score = 2 × ((precision × recall)/(precision + recall)). Our ChIP-Seq dataset includes AR and ERG binding peaks. AR and ERG play pivotal roles in prostate tumori-genesis [29, 85, 110]. AR activity is central for
overexpres-sion of mostETSgenes such asERGandETV1, which are
fused with androgen-regulated promoters in prostate
tumors. Overexpression ofERGdue toTMPRSS2:ERG
fu-sion results in increased cell invafu-sion and promotes PCa [29]. Differential AR activity has been shown to be associ-ated with prostate tumor subtypes, such as those based on SPOPandFOXA1mutations [3]. Given the importance of AR in prostate, we validated our network-predicted AR edges using ChIP-Seq data. We overlapped 8,151 AR ChIP-Seq binding peaks from normal prostate tissue (GSM1358399) with 81,626 promoters for different gene isoforms and 769,538 enhancers with gene links. There are 3,759 ChIP-Seq-based AR targets. AR shares transcrip-tional targets with other members of the nuclear hormone receptor family [111]. Therefore, to compare AR binding targets predicted with RegNetDriver with AR ChIP-Seq-based targets, we considered both AR and NR3C1 motifs. We compared 8,931 AR targets in the prostate network against 3,759 AR ChIP-Seq-based targets from normal prostate tissue and obtained a sensitivity of 0.716, specifi-city of 0.618, and precision of 0.301 (Additional file 3: Table S2). Also, the predicted AR targets include some of
the known target genes such as FGF8, CDK1, CDK2,
PMEPA1, TMPRSS2, SLC43A1, KLK3, KLK4, SLC45A3, CHD1,KIF1A,PRKCD,FZD9,CLDN4,MAFG,KIAA1217, OAT, TRPV3, SIRT7, GSTT2, HERC3, ELL2, CENPN, MED28, ACSL3, GNMT, ABCC4, PTGER4, and CRELD2 [3, 29, 85, 112, 113]. Moreover, it has been reported that AR and ERG co-occupy target loci in PCa cell lines and tissues [29]. We compared 8,931 AR edges with 5,103 ERG edges in the prostate network and found that 3,443 target genes are common. We found significant enrich-ment for common AR and ERG targets (hypergeometric distribution test,pvalue = 1.5 × 10-151). Additional file 3: Table S2 contains the results of network validation.
Network comparison
We compared the performance of our prostate regula-tory network with the prostate epithelial cell network of Marbach et al. for the nine TFs with available ChIP-Seq
binding peaks. To evaluate TF–target gene edges, we
overlapped the TF ChIP-Seq peaks with all promoters and enhancers and then evaluated them using the con-nections between promoter/enhancer and target genes obtained both from RegNetDriver (ChIP-RegNetDriver targets) and Marbach et al. annotations (ChIP-Marbach targets). Due to the unavailability of a true gold standard dataset for promoter–gene and enhancer–gene links, we
evaluated TF–target edges for the nine TFs in
RegNet-Driver and the Marbach et al. network using both ChIP-RegNetDriver and ChIP-Marbach as gold standards.
Figures 3a and b show the AUROC and AUPRC for TF–
target genes edges in the prostate regulatory networks from RegNetDriver (blue) and Marbach et al. (red). In Fig. 3, circular data points represent network TF–target gene edges evaluated using ChIP-RegNetDriver targets and triangular data points represent network TF–target gene edges evaluated using ChIP-Marbach targets. We
find higher AUROC and Fscores for RegNetDriver for
eight out of nine TFs using both ChIP-RegNetDriver tar-gets and ChIP-Marbach tartar-gets (Figs. 3a, c). The mean
values of AUROC and F scores computed using
ChIP-RegNetDriver and ChIP-Marbach targets are higher for all nine TFs for RegNetDriver compared to Marbach (Fig. 3; blue square boxes represent mean values for RegNetDriver and red square boxes for Marbach). For AUPRC, we find that network annotations for generating ChIP-Seq-based TF–targets provide an additional advan-tage to the networks, which show higher AUPRC values for their respective annotation set. However, RegNetDri-ver shows higher mean AUPRC for seven out of nine TFs though the mean AUPRC values for RegNetDriver
and Marbach are more similar than AUROC orFscores
(Fig. 3b). Overall, these results demonstrate the ability of a DHS-based network to recover more reliably true prostate regulatory interactions.
We also evaluated the predicted TF–promoter and
TF–enhancer edges using ChIP-Seq binding peaks. We
overlapped ChIP-Seq peaks for the nine TFs with all promoters and enhancers. We defined an edge as posi-tive if there was a TF ChIP-Seq peak overlapping the regulatory element and negative otherwise. Additional file 1: Figure S3 shows the AUROC and AUPRC for
TF–promoter and TF–enhancer edges in the prostate
networks of RegNetDriver and Marbach. For eight out of nine TFs, we see higher AUROC and AUPRC for
RegNetDriver TF–promoter edges in comparison to
the Marbach et al. network. The AUROC is also
higher for eight TFs for TF–enhancer edges in
Regulatory TF hubs are enriched for known cancer genes We used the prostate regulatory network to identify TF hubs, which are defined as the top 25% of the highest degree TFs [48]. Out-degree is the number of out-going edges per node. There are 153 TF hubs in our prostate regulatory network (Additional file 3: Table S4). Next, we looked for cancer genes in our list of TF hubs. In total, 573 genes were annotated by the Sanger Center as causally implicated in oncogenesis (Cancer Gene Cen-sus; http://cancer.sanger.ac.uk/census/) and 31 out of 153 TF hubs are known cancer genes. Fisher’s exact test was applied to test the hypothesis that TF hubs are sig-nificantly enriched for known cancer genes (OR = 2.24;p value = 0.00074).
Significant genomic alterations
To identify significantly mutated coding and non-coding elements (promoters and enhancers), we developed a novel computational method called FSig-SNV, which uses the functional impact and positional recurrence of the variants present in both coding and non-coding re-gions. For functional annotation, the method uses Fun-Seq2 [67] to annotate and calculate the functional bias score of each variant. FunSeq2 uses a weighted scoring scheme that takes into account features such as the functional annotation of variants; the presence of vari-ants in sensitive, ultra-sensitive, ultra-conserved, and HOT regions; the nucleotide-level impact of regulatory variants, which includes the breaking and motif-gaining score; and the network properties of variant-associated genes [48, 67]. This weighting method pro-vides FunSeq2 with the ability to prioritize cancer som-atic functional mutations better relative to other methods [67, 114].
The positional recurrence of a variant is defined as the number of tumor samples with the same mutated
pos-ition. At each mutated position (i) in the genome, we
multiplied the positional recurrence (W) and functional impact score (FS) to get a positional FSig-SNVposscore:
FSig‐SNVpos¼ Wi FSi:
A summation of FSig-SNVposfor all the variants in an
element (coding, promoter, or enhancer) is defined as the FSig-SNV score:
FSig‐SNV score ¼ Xni¼
0WiFSi
wherenis the total number of variants in an element. To assess the significance of the FSig-SNV score for each coding and non-coding element, we perform a per-mutation test. In the perper-mutation test, the observed FSig-SNV score for an element is compared with a null distribution of permuted FSig-SNV scores and the p value is calculated. Null distributions specific to
coding and non-coding elements are generated by ran-domly sampling the same number of positional scores
(FSig-SNVrpos scores, where rpos refers to random
pos-itional scores) within the same genomic element. Next, we sum FSig-SNVrposscores into an aggregate FSig-SNVrandom
score. Studies have shown that the mutation rate varies across the mammalian genome and late-replicating regions are associated with a higher mutation rate [68, 115, 116]. Thepvalue of the test element is calculated using
P¼1þ
XN
n¼1F Xnð ≥X0Þ
Nþ1 :
The output of function F is 1 when Xn is bigger than
or equal to X0, otherwise it is 0. N is the number of
sampling iterations (default = 106). X0 is the observed FSig-SNV score for a coding or non-coding element of a
gene and Xn is the FSig-SNVrandom score. We use the
Benjamini and Hochberg method for multiple hypothesis testing (q value≤ 0.05). The output of the method is a list of genes with significantly mutated coding, and promoter or enhancer elements.
We developed the FSig-SV method to identify signifi-cantly rearranged coding and non-coding elements. The term “rearranged” refers to SVs, including deletions, in-sertions, duplications, inversions, and translocations. To find rearranged regions within each chromosome, we first generated a list of coding and non-coding regions (promoter and enhancer) altered by different SVs. Next, we counted the number of samples with SVs affecting the listed coding and non-coding regions. In this way, we know the number of samples with rearranged coding and non-coding regions in each chromosome. To iden-tify significantly rearranged regions in each chromo-some, we simulate a background distribution of SVs by randomly shuffling breakpoints keeping the total num-ber of samples, numnum-ber of SVs per chromosome, and length of SVs constant. For each coding and non-coding element within a chromosomal arm, FSig-SV compares the number of samples affected in simulated data with
that observed and computes p values. The formula for
the p value calculation is the same as that discussed
above for FSig-SNV, where N corresponds to the
num-ber of sampling iterations (default 103),X0is the number
of SVs in a coding or non-coding element, andXnis the number of random SVs in the element. The Benjamini and Hochberg method was used for multiple hypothesis testing (q value≤ 0.01). The output of the method is a list of genes with significantly rearranged coding or non-coding elements.
dcc.icgc.org/projects/PRAD-CA), 57 samples from the work of Baca et al. [9], and seven samples from Berger et al. [5]. We used 912,004 SNVs and 3,888 SVs from PRAD-CA samples (n= 124) and 350,049 SNVs and 6,465 SVs (n= 64) from the Baca et al. and Berger et al. samples.
DNA methylation
We used TCGA level 3, Illumina Infinium Human-Methylation450 (HM450) array data corresponding to 333 primary prostate samples, 35 normal samples, and the ELMER package [52] for identifying differentially methylated promoter and enhancer regions. To define promoter probes, we used the promoter definition of being -2.5 kb from a TSS (as discussed above in Identifi-cation of promoters and enhancers section). Out of 485,512 array probes, 167,284 were defined as promoter probes and 20,094 probes overlapped with enhancer re-gions (see Identification of promoters and enhancers section for the enhancer definition). The amount of
DNA methylation at each CpG is referred to as the β
value, whereβ=M/(M+U) andMis the methylated al-lele intensity andU is the unmethylated allele intensity.
The ELMER package uses a t-test to identify promoter
and enhancer probes that are significantly hyper-methylated or hypo-hyper-methylated relative to normal samples
(n= 35 samples). To identify hypo-methylated probes,
ELMER compares the 20% of normal samples with the lowest methylation to the 20% of tumor samples with the lowest methylation and performs an unpaired one-tailed t-test. Similarly, to identify hyper-methylated probes, it compares the 20% of the highly methylated normal and tumor samples [52]. For additional stringency, ELMER considers a probe as differentially methylated if the methy-lation difference is greater than 0.3 (|μnormal–μtumor| > 0.3)
and the one-tailedt-testqvalue < 0.01. Apart from identi-fying differentially methylated promoter and enhancers, ELMER correlates the state of these regions with the ex-pression of the nearby genes to identify transcriptional targets [52]. The output of the package is a list of signifi-cantly differentially methylated promoter and enhancer probes (q value ≤ 0.01) and their significantly associated target genes (qvalue≤0.01).
To generate scatter plots for visualizing the effect of the expression of TF hubs on global methylation, we used level 3 HM450 PRAD DNA methylation data for 333 TCGA prostate samples and log2-transformed level 3 PRAD TCGA RNA-Seq RSEM data.
Common effects of genetic and epigenetic alterations on differential gene expression
To analyze that impact of SVs and promoter DNA
hyper-methylation on the expression of FAS, FAM3B,
and TNFSF13, we first identified TCGA tumor samples with these alterations. Out of 333 tumor samples, 88
samples had FAS deleted, 92 samples had FAM3B
de-leted, and 113 had TNFSF13 deletions. To identify
hyper-methylated samples for each gene, we selected the top 20% of the tumor samples, i.e., 67 tumor samples with the highest methylation at promoter probes
cg26478401 for FAS, cg22612764 for FAM3B, and
cg13829089 for TNFSF13. To be consistent with the
ELMER package, we used a 20% cutoff, which is used to identify differentially methylated promoter and enhancer probes with respect to normal. The 20% cutoff allows identification of molecular subtypes making up minority cases, while providing enough statistical power for pre-dictions [52]. To generate the Venn diagram (Fig. 5b), we segregated tumor samples into three categories: sam-ples with gene deletion, hyper-methylation in promoter regions, and samples with both deletion and hyper-methylation. To analyze the effect of deletion and differ-ential methylation on expression, we used level 3 PRAD TCGA RNA-Seq data corresponding to 333 tumor sam-ples. The Wilcoxon rank sum test was used to compare the distribution of samples with and without deletions/ hyper-methylation.
Differential gene expression
Level 3 PRAD TCGA RNA-Seq data for 333 tumor and the adjacent 27 normal samples were used for finding differentially expressed genes between normal and tumor. We performed the Wilcoxon rank sum test to identify differentially expressed genes between normal and tumor samples at a false discovery rate threshold of 0.0001. We obtained 7,675 genes that are either up- or down-regulated with respect to normal.
SVs have stronger influence on TF hubs
We applied Fisher’s exact test to check whether TFs al-tered by SVs are significantly enriched for TF hubs com-pared to TFs altered by methylation changes. Out of 31 TFs significantly altered by genetic and epigenetic changes, 22 TFs have significant differential methylation in promoter or enhancer regions, nine are significantly altered by SVs in coding or non-coding region, and none by SNVs. Among 22 TFs, three are hubs, while six are hubs among the nine TFs affected by SVs. We found that TFs altered by SVs are significantly enriched for hubs compared to TFs altered by methylation changes. Also, five out of the six hub genes affected by SVs are differentially expressed between tumor and normal sam-ples (ERG pvalue = 0.02,TP53 pvalue = 8.61 × 10⁻⁶,ERF
p value = 0.05, CREB3L1 p value = 2.5 × 10⁻¹¹, and
POU2F2 pvalue = 4.02 × 10⁻¹⁰).
observed enrichment for Gleason score 8 or higher in
TCGA samples (OR = 2.13, p value = 0.003). The
ab-sence of this enrichment in WGS data could be due to depletion of tumors with a high Gleason score in ICGC samples (Additional file 4: Table S10).
ERF signature
To generate the ERFsignatures, we analyzed the RPKM
RNA-Seq profiles of ERF shRNA knockdown in VCaP
cell lines [89]. Briefly, we independently rank genes ac-cording to the difference of means between the shERF-infected VCaP and control samples. The same procedure was performed for the LHS-AR cell line. The top 100 up-regulated genes in LHS-AR and VCaP cell lines are provided as part of the supplementary information
(Additional file 4: Table S11). We performed Fisher’s
exact test to assess whether ERGand ERF binding
tar-gets in the prostate regulatory network are enriched for genes up-regulated due to ERF knockdown in VCaP and LHS-AR cell lines. Out of 17,087 prostate network
genes, 5,103 areERGbinding targets and 3,327 areERF
target genes. Among the top 100 up-regulated genes due
toERFknockdown in VCaP, 63 are present in our
pros-tate regulatory network, 38 areERGbinding targets, and
25 are ERF targets. Similarly, among the top 100
up-regulated genes in LHS-AR, 76 are present in the
pros-tate network, 36 are ERGtarget genes, and 21 are ERF
targets [VCaP: Fisher’s exact test OR = 2.38, p value = 0.00012 (ERF) and OR = 3.58,pvalue = 5.7 × 10⁻⁷(ERG);
LHS-AR: Fisher’s exact test OR = 1.64, p value = 0.05
(ERF) and OR = 2.12,pvalue = 0.0014 (ERG)]. We would like to note that a change inERFexpression impacts the downstream transcriptional program through activation of both direct and indirect binding targets. As it is hard to compute indirect binding targets from our network, we restrict our analysis to direct targets only.
TF expression and DNA methylation
We calculated the Spearman correlation between TF
hub expression (ERG, TP53, POU2F2, SPI1, CREB3LI,
andERF) and DNA methylationβvalues at differentially methylated probes in TF binding motifs. We correlated
ERG expression with average DNA methylation at 642
hyper-methylated and 24 hypo-methylated probes with
overlappingERGChIP-Seq binding peaks (GSM353647).
Due to the unavailability of ChIP-Seq peaks for the remaining TF hubs, we considered differentially methyl-ated probes in promoters and enhancers with a TF bind-ing motif. All the TF bindbind-ing targets in our prostate network are enriched for TF motifs.
For this analysis, we used level 3 HM450 PRAD DNA methylation data for 333 TCGA prostate samples and log2-transformed level 3 PRAD TCGA RNA-Seq RSEM data. Three out of six TF hubs showed significant
correlations between TF expression and DNA methyla-tion at differentially methylated probes within TF
bind-ing motifs (ERG: rho = -0.173, p value = 0.00149;
POU2F2: rho = -0.277, p value = 3.01 × 10⁻⁷; SPI1: rho = -0.14, p value = 0.010). The differential expression of TFs with more binding sites should have a larger impact in the network by causing methylation changes at more sites, consistent with our observation of significant
cor-relation between TF hub expression (ERG,POU2F2, and
SPI1) and DNA methylation at binding sites. As a refer-ence, we do not observe significant correlation between expression of non-TF hubs (10% of the lowest out-degree nodes) and DNA methylation at differentially methylated probes within TF binding motifs.
RWPE1 cell line preparation
We obtained RWPE1 cells from ATCC and maintained
them as per the manufacturer’s protocol. The
RWPE1-ERG isogenic cell line with overexpressed ERG (the
common isoform is based on TMPRSS2-ERG fusion)
and the RWPE1-GFP cell line have been previously de-scribed [97, 118]. We prepared genomic DNA from RWPE1-GFP or RWPE1-ERG using standard phenol chloroform extraction followed by ethanol preparation
and suspension into 30 μl of 10 mM Tris pH 8.0. The
genomic DNA used in the EpiTYPER MassARRAY assay was collected from the RWPE1-GFP/ERG cells using a system of purification through a column (NucleoSpin Tissue kit, Macherey Nagel, Bethlehem, PA).
Sample preparation for ERRBS
amplification for each library was prepared with FastStart High Fidelity DNA Polymerase (Roche,
Indian-apolis, IN) and 0.5μM each of the Illumina PCR primers
PE1.0 and 2.0. The thermocycler conditions were 5 minutes at 94 °C, 18 cycles of 20 seconds at 94 °C, 30 seconds at 65 °C, 1 minute at 72 °C, followed by 3 minutes at 72 °C. PCR products were isolated using
Agencourt AMPure XP beads per the manufacturer’s
recommended protocol (Agencourt). All amplified librar-ies underwent quality control, which involves use of a Qubit 1.0 fluorometer and Quant-iT dsDNA HS Assay Kit (Invitrogen, Grand Island, NY) for quantitation and bio-analyzer visualization (Agilent 2100 Biobio-analyzer; Agilent, Santa Clara, CA).
EpiTYPER MassARRAY system
Sample preparation was performed at Weill Cornell Medicine Epigenomics Core as described in the previous section. Briefly, the gDNA samples are treated with bi-sulfite to convert any non-methylated cytosine residues into uracil. The targeted sequences are then amplified by PCR, preserving the bisulfite-induced sequence changes. In vitro transcription is performed and the resulting RNA transcripts are specifically cleaved at uracil resi-dues. The resulting fragments differ in size and mass, depending on the sequence changes generated through bisulfite treatment. The EpiTYPER reaction products are dispensed onto a SpectroCHIP array and read by a MALDI-TOF mass spectrometer for data acquisition. The primers used to target the 17 sequences are listed in Additional file 4: Table S12.
Computational approach for ERRBS analysis
The bisulfite-treated reads were aligned and methylation calls were made as previously described [95]. The bisul-fite reads were aligned to the bisulbisul-fite converted hg19 reference genome using Bismark [120]. We analyzed the ERRBS data for both cell lines using the methylKit R package [121]. methylKit analyzes and characterizes genome-wide cytosine profiles from high-throughput methylation experiments. It reads DNA methylation in-formation from text files and performs operations such as differential methylation analysis, sample clustering, annotation, and DNA methylation visualization [121]. We used ERRBS output files for RWPE1-ERG and
RWPE1-GFP, which contained information about
chromosome, base, strand, coverage, cytosine frequency (freqC), and thymine frequency (freqT). We used the
calculateDiffMeth() function to find differentially
methylated CpGs. The calculateDiffMeth() function uses Fisher’s exact test to compare the fraction of methylated C’s in test vs. control. methylKit uses the sliding linear
model (SLIM) method to correct p values and reportq
values [121]. A CpG is defined to be differentially
methylated if the percentage methylation difference be-tween test and control is larger than 25% and theqvalue < 0.01. We used this criterion to call hyper- and hypo-methylated regions in the RWPE1-ERG cell line with re-spect to RWPE1-GFP (Additional file 1: Figure S11).
We compared DNA methylation in 333 TCGA pros-tate tumor samples with the DNA methylation for the RWPE1-ERG cell line and observed a significant correl-ation (Additional file 1: Figure S12).
Additional files
Additional file 1:This file containsFigures S1–S12and Supplementary text. (PDF 11000 kb)
Additional file 2:Prostate regulatory network. This file contains TF–target gene edges in the prostate regulatory network. (TXT 14236 kb)
Additional file 3:This file includesTables S1–S4. (XLSX 47 kb)
Additional file 4:This file includesTables S5–S12. (XLSX 2964 kb)
Acknowledgments
We would like to acknowledge the important contribution of the Weill Cornell Medical College Epigenomics Core Facility and the Weill Cornell Medical College Computational Genomics Core Facility and the technical assistance provided by Naoki Kitabayashi, Theresa McDonald, and Yifang Liu. We thank Christopher Barberi, Effie Apostolou, Jason Mezey, and Abishek Sainath for helpful suggestions.
Funding
We acknowledge support from the National Institutes of Health to EK (1U24CA210989-01) and DSR (R21 CA143496-01, R01 CA179100-01).
Availability of data and materials
RegNetDriver source codes and data files for the prostate regulatory network are available at github.com/khuranalab/RegNetDriver and khuranalab.med.cornell.edu/ RegNetDriver.html with GNU General Public License v3.0. Source codes used in the manuscript are available via Zenodo with DOI http://doi.org/10.5281/ zenodo.800729. TF Chip-Seq data used for network validation and comparison can be accessed at the NCBI GEO database (https://www.ncbi.nlm.nih.gov/geo/ ). Accession codes are GSM1358399 (AR), GSM947527 (CTCF), GSM353647 (ERG), GSM1424526 (ETS1), GSM1145322 (ETV1), GSM738822 (GABPA), GSM1600544 (GATA2), GSM980665 (NR3C1), and GSM1249449 (TCF7L2).
Authors’contributions
PD and EK designed the study. PD, MAR, and EK wrote the manuscript. PD, AMF and EK developed the computational methods. PD, AMF, ANF, EML, and DL analyzed the data. AB, DSR, and MAR performed and supervised the ERRBS study. FWH and PT performedERFfunctional validation. All authors provided input at all stages of the manuscript and read and approved the final version. EK supervised the study.
Ethics approval and consent to participate Not applicable.
Competing interests
The authors declare that they have no competing interests.
Publisher’s note
Springer Nature remains neutral with regard to jurisdictional claims in published maps and institutional affiliations.
Author details 1