Nelloreet al. Genome Biology (2016) 17:266 DOI 10.1186/s13059-016-1118-6
R E S E A R C H
Open Access
Human splicing diversity and the extent
of unannotated splice junctions across human
RNA-seq samples on the Sequence Read
Archive
Abhinav Nellore
1,2,3, Andrew E. Jaffe
2,3,4,5, Jean-Philippe Fortin
2,3, José Alquicira-Hernández
2,6,
Leonardo Collado-Torres
2,3,4, Siruo Wang
2,7, Robert A. Phillips III
2,8, Nishika Karbhari
2,9,
Kasper D. Hansen
2,3,10, Ben Langmead
1,2,3*and Jeffrey T. Leek
2,3*Abstract
Background: Gene annotations, such as those in GENCODE, are derived primarily from alignments of spliced cDNA sequences and protein sequences. The impact of RNA-seq data on annotation has been confined to major projects like ENCODE and Illumina Body Map 2.0.
Results: We aligned 21,504 Illumina-sequenced human RNA-seq samples from the Sequence Read Archive (SRA) to the human genome and compared detected exon-exon junctions with junctions in several recent gene annotations. We found 56,861 junctions (18.6%) in at least 1000 samples that were not annotated, and their expression associated with tissue type. Junctions well expressed in individual samples tended to be annotated. Newer samples contributed few novel well-supported junctions, with the vast majority of detected junctions present in samples before 2013. We compiled junction data into a resource calledintropolisavailable at http://intropolis.rail.bio. We used this resource to search for a recently validated isoform of the ALK gene and characterized the potential functional implications of unannotated junctions with publicly available TRAP-seq data.
Conclusions: Considering only the variation contained in annotation may suffice if an investigator is interested only in well-expressed transcript isoforms. However, genes that are not generally well expressed and nonetheless present in a small but significant number of samples in the SRA are likelier to be incompletely annotated. The rate at which evidence for novel junctions has been added to the SRA has tapered dramatically, even to the point of an asymptote. Now is perhaps an appropriate time to update incomplete annotations to include splicing present in the now-stable snapshot provided by the SRA.
Keywords: RNA-seq, Splicing, Intron
*Correspondence: [email protected]; [email protected]
1Department of Computer Science, Johns Hopkins University, Baltimore, MD, USA
2Department of Biostatistics, Johns Hopkins Bloomberg School of Public Health, Baltimore, MD, USA
Full list of author information is available at the end of the article
Background
Gene annotations such as those compiled by RefSeq [1] and GENCODE [2] are derived primarily from align-ments of spliced complementary DNA (cDNA) sequences and protein sequences [3, 4]. So far, the impact of RNA sequencing (RNA-seq) data on annotation has been lim-ited to a few projects including ENCODE [5] and Illumina Body Map 2.0 [6].
To measure how much splicing variation present in pub-licly available RNA-seq datasets is missed by annotation, we aligned 21,504 Illumina-sequenced human RNA-seq samples from the Sequence Read Archive (SRA) to the
hg19genome assembly with Rail-RNA [7] and compared exon-exon junction calls to exon-exon junctions from annotated transcripts. We compared exon-exon junctions rather than full transcripts because junction calls from short RNA-seq reads are considerably more reliable than assembled transcripts [8]. Details of our alignment pro-tocol are reviewed in Methods. All alignment was per-formed in the cloud using Amazon Web Services (AWS) Elastic MapReduce, costing 72 US cents per sample, as computed in Methods.
We considered only Illumina platforms because of their ubiquity and high base-calling accuracy. Specifically, the samples we aligned were obtained by querying the SRA metadata SQLite database of the R/Bioconductor pack-age SRAdb [9] as of April 2015 for all Illumina-sequenced human RNA-seq samples.
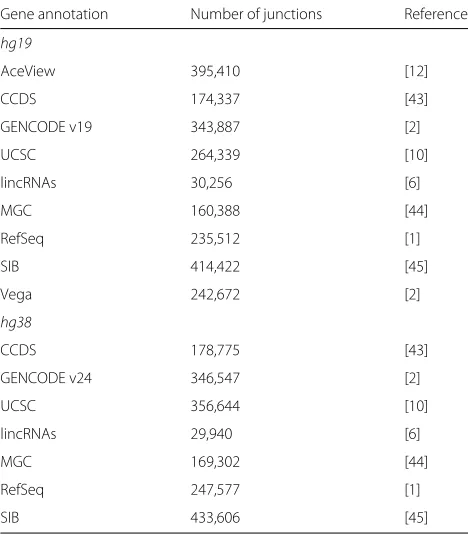
In the remainder of this paper, we use the term “anno-tation” to refer to junctions from the union of transcripts across several gene annotation tracks from the UCSC Genome Browser [10]. We also occasionally use the term “RNA-seq junctions” to distinguish junctions we called from RNA-seq data from annotated junctions. Forhg38
annotations, coordinates were lifted over to hg19. See Methods for details and Table 1 for included gene annota-tions together with the number of juncannota-tions in each. In all, we found 536,994 annotated junctions in RNA-seq data: 505,314 were present in annotations ofhg19, and the rest were added by annotations ofhg38.
Results and discussion
We compiled the junction calls and associated coverage levels for 21,504 SRA RNA-seq samples into a resource calledintropolisavailable at http://intropolis.rail.bio. Using this resource, we addressed several questions that are fundamental to our understanding of the transcrip-tome and informative for analyses by individual investiga-tors.
Reproducibility of junction calls across alignment protocols
[image:2.595.304.538.113.380.2]We first asked whether our RNA-seq junction calls could be reproduced across alignment protocols. The SEQC/MACQ-III consortium (hereafter called SEQC)
Table 1Gene annotations from which exon-exon junctions were extracted and unioned to obtain a list of annotated junctions
Gene annotation Number of junctions Reference
hg19
AceView 395,410 [12]
CCDS 174,337 [43]
GENCODE v19 343,887 [2]
UCSC 264,339 [10]
lincRNAs 30,256 [6]
MGC 160,388 [44]
RefSeq 235,512 [1]
SIB 414,422 [45]
Vega 242,672 [2]
hg38
CCDS 178,775 [43]
GENCODE v24 346,547 [2]
UCSC 356,644 [10]
lincRNAs 29,940 [6]
MGC 169,302 [44]
RefSeq 247,577 [1]
SIB 433,606 [45]
All tracks were taken from the UCSC Genome Browser [10] except for GENCODE [2], which was downloaded from the GENCODE website http://www.gencodegenes. org/releases/. Junction coordinates fromhg38annotations were lifted over tohg19 before the union was performed. Of all gene annotations listed here, the Swiss Institute of Bioinformatics (SIB) genes has the most, with more than 400,000 junctions for each ofhg19andhg38
aligned a subset of 1720 universal human reference RNA and human brain reference RNA samples [11] of the 21,504 samples we considered using three different pro-tocols: NCBI Magic [12], r-make (which uses STAR [13]) and Subread [14]. Junctions called by Rail-RNA are com-pared with junctions called by SEQC across the subset in Fig. 1. Of junctions found by Rail-RNA in at least 80 SEQC samples, as many as 97.5% are found by at least one SEQC alignment protocol, and 90.1% are found by all three. Note that 80 SEQC samples is 4.7% of 1720, comparable to a 1000-sample threshold discussed in the next subsection for the 21,504 SRA samples. This suggests that the over-whelming majority of junctions we called are not artifacts of any particular aligner’s junction-calling algorithm.
Relationship between annotation and expression of splice junctions
Nelloreet al. Genome Biology (2016) 17:266 Page 3 of 14
Fig. 1Displayed is the number of exon-exon junctionsJfound by Rail-RNA and other alignment protocols in at leastSof the 1720 brain and universal human reference RNA-seq samples also studied by the SEQC/MACQ-III consortium [11] (i.e., SEQC). “2 aligners” (red), “3 aligners” (green), and “4 aligners” (orange) refer to junctions we found with Rail-RNA that were also found by, respectively, 1, 2, and 3 of the alignment protocols used by SEQC
of cutoffs. For each RNA-seq junction we considered, we also evaluated whether it appeared in annotation. We con-sidered the following levels of evidence: (1) fully annotated junctions; (2) separately annotated junctions (typically exon-skipping events), where both the donor and accep-tor sites appear in one or more junctions from annotation, but never for the same junction; (3) alternative donor and acceptor sites, where only either the donor or the accep-tor site appears in one or more junctions from annotation; and (4) novel junctions, where neither donor nor acceptor site is found in any annotated junction.
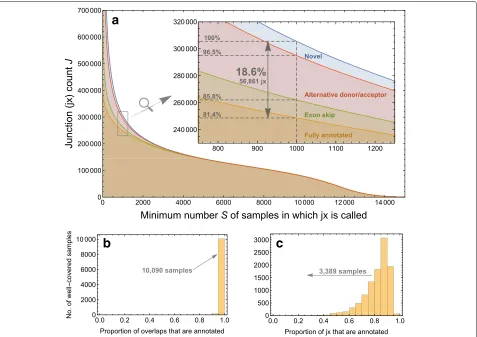
We observed that the RNA-seq junctions most widely expressed across samples and experiments were well doc-umented in annotation. For example, we observed that junctions that appeared in at least 40% of human RNA-seq samples on the SRA (S ≥8000) were also present in previous annotation at least 99.8% of the time. However, 18.6% of junctions that appeared in 1000 or more sam-ples did not appear in annotation (Fig. 2a). Many of these unannotated junctions are partially annotated, but 3.5% of junctions found in more than 1000 samples do not match any splice site from an annotated junction.
We also took an investigator-focused view of the rela-tionship between annotation and expression. Most inves-tigators collect only a small number of samples for their study. We restricted attention to samples where at least 100,000 RNA-seq junctions were found to rule out obvi-ously small RNA-seq samples and samples that were mislabeled as RNA-seq on the SRA. In each sample, we counted the number of instances where a read maps across a junction. (A read mapping across two junctions
thus contributes two instances.) The total number of such “junction overlaps” across samples is a measure of the total expression of junctions across the SRA. Most of the reads that map to junctions map to annotated junc-tions (Fig. 2b). In 10,090 of a total of 10,311 samples that meet our criterion of 100,000 junctions observed, more than 95% of junction overlaps correspond to annotated junctions.
This represents only the bulk coverage of junctions. We can also consider the number of junctions observed, regardless of coverage. In 3389 out of 10,311 samples, we observe that fewer than 80% of junctions appear in annotation (Fig. 2c). So while the most highly covered junctions are well annotated, there is a large number of junctions that are well covered across multiple sam-ples but may not appear in any given small subset of samples.
[image:3.595.59.540.86.300.2]Fig. 2 aShows how many exon-exon junctionsJare found in at leastSsamples of the 21,504 human RNA-seq samples on the SRA aligned here. It also shows how much evidence for these junctions is found in gene annotation: “fully annotated” (orange) means the junction is in an annotated transcript, “exon skip” (green) means a called junction’s donor and acceptor sites are annotated in distinct junctions, “alternative donor/acceptor” (red) means only one of a called junction’s donor and acceptor sites is in a junction from annotation, and “novel” (blue) means neither donor nor acceptor site is annotated.bandcrestrict attention to the 10,311 samples for which 100,000 junctions are discovered in each.brefers to overlaps, where an overlap is any instance where a read maps across a junction
Technical and biological variation in junction expression across samples
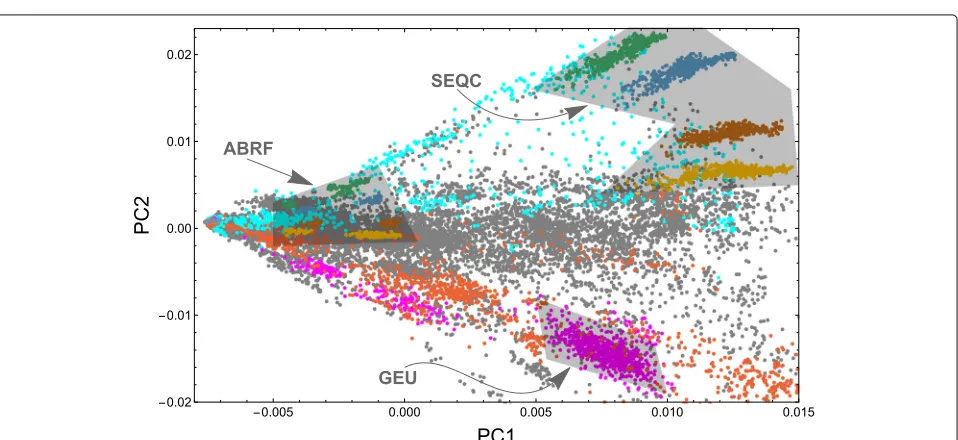
We next explored variation across the 21,504 samples we processed. We wanted to see the combination of techni-cal and biologitechni-cal factors that contribute to variation in unannotated junction expression. In this analysis, we con-sidered only the 56,861 unannotated junctions found in at least 1000 samples of the 21,504, and the subset of 21,057 samples of the 21,504 with at least 100,000 reads each. We performed a principal component analysis (PCA) on the data matrix where rows correspond to the 56,861 unannotated junctions and columns correspond to the 21,057 samples. (See Methods for technical details of the decomposition.)
PC1 explains the overwhelming majority of the vari-ance (87.9%) and has a Pearson correlation coefficient
r = 0.978 with junction sequencing depth sj as
mea-sured by total junction overlaps (i.e., instances where a
read maps across a junction) in sample j (Fig. 4) after normalization by library size and log transformation. PC1 is also highly correlated with log-transformed read lengthj(r = 0.639), but much less correlated with
log-transformed total number of mapped readsCj(r=0.277),
showing that enrichment for splice junctions is different in different samples. (See Methods for precise definitions of correlates.)
Nelloreet al. Genome Biology (2016) 17:266 Page 5 of 14
Fig. 3Displayed is the number of exon-exon junctionsJfound in at leastPprojects of the 929 human RNA-seq projects on the SRA considered in this paper. It also shows how much evidence for these junctions is found in gene annotation: “fully annotated” (orange) means the junction is in an annotated transcript, “exon skip” (green) means a called junction’s donor and acceptor sites are annotated in distinct junctions, “alternative donor/acceptor” (red) means only one of a called junction’s donor and acceptor sites is in a junction from annotation, and “novel” (blue) means neither donor nor acceptor site is annotated
[image:5.595.59.540.86.304.2] [image:5.595.61.540.442.662.2]mixture ratios—0:1, 1:3, 3:1, and 1:0—with each sample sequenced at multiple sites. The four mixtures separate well, and each lies on a radial line passing through the singular point on the left. Data from the two groups are separated because they used different sequencing depths and read lengths.
The four SEQC UHRR:HBRR sample ratios form four clusters distinguished by PC2, and the ABRF UHRR:HBRR sample ratios form clusters distinguished by both PC1 and PC2. Observe that there is a singular point where all points appear to converge (Fig. 4). Here, the number of junctions detected in a sample approaches zero. A radial line extending from the singular point rotat-ing clockwise across the plot passes over UHRR:HBRR sample ratios in the same order for ABRF as it does for SEQC. Though ABRF and SEQC have some overlap in managing investigators, they are two different projects that employed randomized study designs, making a strong case that PC2 is distinguishing mostly biological rather than technical factors.
Lymphoblastoid cell lines, typically made from HapMap samples, are extensively present in the SRA. Differ-ent studies cluster together and are again placed on a radial line going through the singular point; each study used very different sequencing depths and read lengths. Searching the SRA metadata, we could classify a number of samples as brain and blood. Again, these samples fall along radial lines through the singular point. The biggest separation in PC2 is between brain and blood, two tissue types that are well represented in the SRA.
Novel junction discovery over time
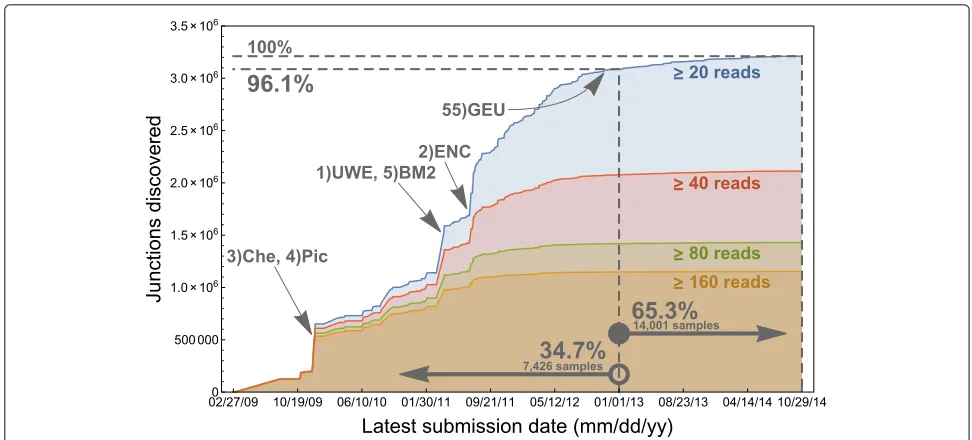
We proceeded to measure the accumulation of “confi-dently called” junctions over calendar time. A junction was “confidently called” if it was found in at least 20 reads across all samples. We measured the discovery date of a junction as the earliest submission date to the BioSam-ple database [16] from among all samBioSam-ples in which the junction was found by Rail-RNA. The≥20-read curve has noticeable spikes in 2009 and 2011 but appears to decel-erate significantly before 2013, by which time 96.1% of junctions were discovered.
Recent samples added to the SRA have contributed few novel junctions. Curves for more stringent cover-age thresholds (Fig. 5) level off sooner; the curve for the most stringent threshold (≥160 reads) is essen-tially flat by 2012. Ranked and labeled are the domi-nant contributing projects from days on which the most junctions were discovered. The largest single contribu-tion comes from UWE, the University of Washington’s Human Reference Epigenome Mapping Project [17], on 4 April 2011, when 252,628 new junctions appeared. The submission includes total RNA from fetal tissue,
which exhibits markedly different expression than adult tissue [18]. Moreover, sequencing total RNA may cap-ture a more diverse range of exon-exon junction expres-sion than sequencing poly(A)-selected RNA since a larger set of noncoding transcripts is sampled. So a new total RNA sample may contribute more novel junctions than a new poly(A)-selected sample. The second, third, fourth, and fifth largest contributions are from, respectively, ENCODE [19], early studies of 69 lymphoblastoid cell lines (LCLs) [20] and 41 Coriell cell lines [21], and the Illumina Body Map 2.0 sequencing of 16 human tissue types [6]. The GEUVADIS submission of 464 LCLs is on only the 55th largest contributing date, 7 November 2012. By this time, LCLs had already been well studied using RNA-seq.
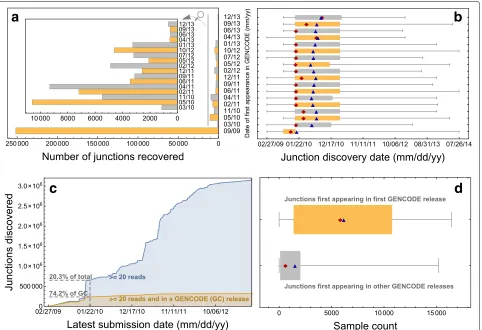
To determine whether the annotation of junctions is being driven by RNA-seq experiments, we examined the correlation between annotated junctions and the dis-covery date of observed junctions over calendar time. GENCODE released 18 versions between September 2009 and December 2012. Call a confidently called junction “documented” if it appears in at least one GENCODE release. Most documented junctions (80.0%) appear in the earliest GENCODE release (Fig. 6a). Documented junctions tend to have early discovery dates (Fig. 6b); in fact, by late January 2010, 74.2% of documented junc-tions were discovered, while 20.3% of confidently called junctions were discovered (Fig. 6c). This makes sense: annotated junctions tend to be found in many sam-ples, making it likelier that at least one sample has an early submission date to BioSample. It is reasonable to speculate that there is a correlation between junction discovery date and GENCODE appearance date: per-haps shortly after a junction is discovered, it appears in GENCODE.
But inspection of the relationship between documenta-tion date and discovery date suggests that only the first GENCODE release introduced new junctions with signifi-cantly earlier discovery dates than other releases (Fig. 6b). The reason for this phenomenon is that junctions appear-ing first in GENCODE’s first release are present in many more samples (median=5825) than junctions appearing first in other GENCODE releases (median=602 samples) (Fig. 6d).
Application toALKisoform discovery
We have compared the variation in our database
intropolisto standard gene annotations.
Nelloreet al. Genome Biology (2016) 17:266 Page 7 of 14
Fig. 5The 3,211,228 junctions found in at least 20 reads across samples are accumulated by their “discovery dates.” Here, discovery date of a junction is taken to be the earliest submission date to the BioSample database from among the samples in which the junction was found. 96.1% of the junctions were discovered before 1 January 2013, although only 34.7% of samples depicted in the figure had been submitted by then, and afterwards discovery levels off. Demanding higher levels of confidence (thered, green,andorange curves) gives rise to earlier asymptotes. Ranked from 1 to 5 are the dominant contributing projects from dates on which the most junctions are discovered. “Che” refers to a study of 41 Coriell cell lines by Cheung et al. [21], “Pic” refers to a study of 69 LCLs by Pickrell et al. [20], “UWE” refers to the University of Washington Human Reference Epigenome Mapping Project [17], “BM2” refers to Illumina Body Map 2.0 [6], and “ENC” refers to ENCODE [19]. “GEU” refers to GEUVADIS [37], whose 464 LCLs uncovered few junctions that had not already been discovered
ALK is frequently mutated or aberrantly expressed in cancers including neuroblastoma [22–25] and non-small-cell lung adenocarcinoma, where in particular it has been found to participate in the fusion geneEML4-ALK [26]. Cancers withALK abnormalities are often responsive to treatment with ALK inhibitors such as crizotinib [27].
ALK is a good therapeutic target because it is rarely expressed in normal adult tissue [28]. A novelALK tran-script variant present in about 11% of melanomas and occasionally in other cancer subtypes was recently iden-tified [29]. The transcript is described as resulting from a de novo alternative transcription initiation (ATI) site in ALK intron 19 and is dubbed ALKATI. The kinase activity ofALKATI is found to be suppressed by various
ALK inhibitors, and a patient with ALKATI-expressing metastatic melanoma is shown to exhibit significant tumor shrinkage after treatment with crizotinib.
To investigate the prevalence of ALKATI on the SRA, we searched for a deficit of junction expression in ALK
exons 1–19 compared to exons 20–29. We did this by defining a junction inclusion ratioDmeasuring to what degree junctions between exons 20–29 are expressed rel-ative to junctions between exons 1–19 (see Methods). This signature is a necessary but not sufficient condition for exclusiveALKATIexpression: the expression signature also arises in, for example, the EML4-ALK fusion gene. Table 2 shows the ten top SRA samples we studied ranked
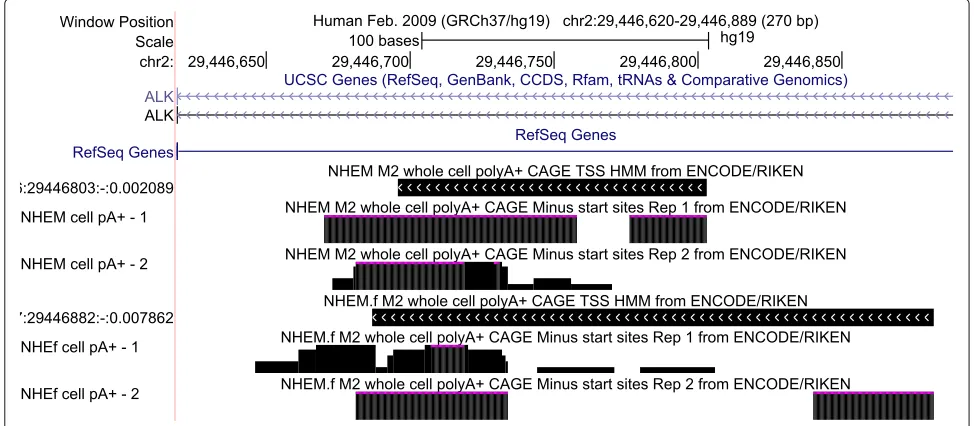
in order of decreasing D. As expected, four such sam-ples are cancers, including uveal melanoma. Three of the ten samples are from two melanocyte cell cultures stud-ied as part of the ENCODE project, “NHEM_M2” and “NHEM.f_M2.” Cap analysis of gene expression (CAGE) data from ENCODE on the same cell lines shows a tran-scription start site (TSS) within ALK intron 19, where the TSS was localized for ALKATI (Fig. 7). This raises the possibility that the transcript is expressed in normal melanocytes. While [29] found noALKATIexpression in 1600 samples from 43 different normal tissues across the GTEx project, including skin, it should be noted that melanocytes comprise only up to 10% of skin cells. In addition to melanocytes, theALKATI transcript may be expressed in macrophages. We also observed that the macrophage and macrophage+fibroblast samples from Table 2 are part of the study [30] that additionally sequenced the same samples exposed to tumor necrosis factor (TNF). The two samples exposed to TNF appear to have no expression of theALKgene, suggesting that TNF may participate in suppressingALKgene expression. This is supported by [31] in lymphoma.
Potential functional implications of previously unannotated junctions
[image:7.595.55.541.85.305.2]Fig. 6Displayed is a summary of the evolution of junctions from the GENCODE annotation ofhg19through its 18 releases compared to the evolution of confidently called junctions called across the SRA. Every junction considered here is “confidently called”—found in at least 20 reads across the SRA samples we analyzed.ashows that most junctions (80.0%) annotated by GENCODE first appeared in the first release.bshows that junctions in GENCODE tend to have early discovery dates. This is also evident fromc, which shows that while only 20.3% of junctions are discovered by late January 2010, almost three-quarters of junctions appearing in at least one GENCODE release are discovered by the same date. Also shown in
bis how junctions first appearing in GENCODE’s first release have noticeably earlier discovery dates than junctions first appearing in later releases. This is due to how junctions first appearing in GENCODE’s first release tend to be found in many more samples (median = 5825) than junctions first appearing in later releases (median = 602 samples), as shown ind. In every box plot, thered diamondcorresponds to the median, and theblue trianglecorresponds to the mean
In [32], Hupe et al. performed translating ribosome affin-ity purification followed by RNA sequencing (TRAP-seq) of brain and kidney samples from mouse. TRAP is a tech-nology that isolates translating RNAs from intact tissues, potentially from targeted cell types. Thus, we examined the extent of our novel and partially annotated junctions presumably being translated. We aligned the six kidney and nine brain TRAP-seq samples from their study using Rail-RNA and lifted the resulting exon-exon junction coordinates over from mouse (mm10) to human (hg19) (see Methods). Of the 112,825 junctions found across the TRAP-seq samples whose liftovers were also found in at least one SRA sample, 86,954 (77.1%) were fully anno-tated, 10,771 (9.5%) were exon skips, 12,410 (11.0%) had alternative donors or acceptors, and 2690 (2.4%) were novel. These data suggest that a significant fraction of unannotated junctions are likely conserved across species:
more than 3% of unannotated junctions found in more than 1000 SRA samples have analogs likely translated in mouse. Furthermore, of the 84,185 junctions found across the TRAP-seq samples whose liftovers were also found in at least 1000 SRA samples, 81,482 (96.9%) were fully anno-tated, 1089 (1.3%) were exon skips, 1464 (1.7%) had alter-native donors or acceptors, and 150 (0.2%) were novel. So there is significant evidence that many previously unanno-tated or partially announanno-tated junctions are translated into proteins and therefore have potentially novel functional relevance.
Conclusions
[image:8.595.59.541.86.416.2]Nelloreet al. Genome Biology (2016) 17:266 Page 9 of 14
Table 2Top ten samples across the 21,504 analyzed in this paper in order of descending junction inclusion ratioD, as defined in the table
Rank Sample (i.e., run) Project Description of sample
Junction Junction Total junction
D=(B-A)/C coverage A for ALK coverage B for ALK coverage C
exons 1–19 exons 20–29 across ALK
1 SRR545713 SRP007461 NHEM.f_M2: normal human 0 139 139 1 melanocyte
1 SRR396804 SRP010166 Non-small cell lung 0 172 172 1 adenocarcinoma
1 SRR620100 SRP017262 Leukemia 0 108 108 1
4 SRR1289650 SRP042031 Macrophage 1 85 86 0.976
5 SRR1289651 SRP042031 Macrophage cultured 1 77 78 0.974 with fibroblast
6 SRR545716 SRP007461 NHEM_M2: normal human 2 94 96 0.958 melanocyte
7 SRR628586 SRP017413 Uveal melanoma 12 111 123 0.805
8 DRR016705 DRP001919 H2228, an EML4-ALK-expressing 38 285 333 0.765 lung adenocarcinoma cell line
9 SRR545714 SRP007461 NHEM.f_M2: normal human 14 63 77 0.636 melanocyte
10 ERR532612 ERP006077 Prostate tumor 16 53 69 0.536
Dessentially measures the difference in expression between junctions acrossALKexons 1–19 and junctions acrossALKexons 20–29. Values ofDclose to 1 may point toward expression of ALKATI, a novel transcript variant ofALKrecently identified in [29] across several cancers but not normal cells. Several cancer samples appear, but interestingly,
normal cell samples also appear, including melanocytes and macrophages
also used our population-level view of transcription to understand the potential hazards of analyzing individual samples without a clear understanding of the background variation in junction discovery levels. We have shown evidence that some unannotated and partially annotated
junctions in human have translated analogs in mouse. We have introduced a resource,intropolis, for others to investigate junction variation, and we have provided an example of the utility of our resource in the case ofALK
gene expression.
Fig. 7Displayed in the UCSC Genome Browser (http://genome.ucsc.edu) are tracks corresponding to CAGE data for normal human melanocyte cell cultures NHEM_M2 and NHEM.f_M2 studied by ENCODE as well as TSSes predicted with hidden Markov models from pooled replicates in theALK
[image:9.595.55.542.473.686.2]While we observed many unannotated junctions shared by thousands of RNA-seq samples from independent investigations, some of these are likely false positive calls due to incorrect placement of reads, sample-specific vari-ation, and regions where the reference genome is incor-rectly assembled. Rail-RNA [7] is designed to be parsi-monious and conservative, and its junction calls agree closely with those of other aligners (Fig. 1). When an
intropolis junction appears in many samples, our evidence suggests that the call is reliable; e.g., 99.8% of junctions found in at least 8000 samples from the SRA are also found in gene annotation. That said, individual novel junctions in intropolis should be used care-fully and verified by other means, such as rtPCR, where appropriate.
Our study also suggests that the rate at which evi-dence for novel junctions has been added to the SRA has tapered dramatically, even to the point of an asymptote (Fig. 5). This has implications for projects and tools that use gene annotations; if annotations have been incomplete up to this point, now is perhaps an appropriate time to update them to include splicing present in the now-stable snapshot provided by the SRA.
As highlighted by Fig. 2a, b, considering only the varia-tion contained in annotavaria-tion may suffice if an investigator is interested only in well-expressed transcript isoforms. However, genes that are not generally well expressed and nonetheless are present in a small but significant num-ber of samples in the SRA are likelier to be incompletely annotated. Quantification of poorly expressed genes may thus be improved by incorporating information about annotated and unannotated splicing events. Along related lines, [33] develops a local splicing variation (LSV) formal-ism that jointly analyzes multiple junctions from the same gene using splicing graphs. The authors show a signifi-cant impact of considering novel (unannotated) junctions on their conclusions. Using this, or similar methodology, on theintropolisdatabase to go beyond the single-junction analysis presented here may be an interesting avenue for future research.
Our approach to synthesizing large public RNA-sequencing datasets offers the opportunity to study transcription more deeply than ever before. Further,
intropolis is a step toward establishing public resources that facilitate rapidly querying existing RNA-seq data.
Methods
Identifying annotated junctions
Following [34], we extracted junctions from transcripts across all the latest “empirical” gene annotation tracks in the UCSC Genome Browser [10] forhg19andhg38except GENCODE [2] and Ensembl [35]. (While GENCODE’s tracks are also in the UCSC Genome Browser, we chose to
download them from the GENCODE website http://www. gencodegenes.org/releases/ instead: as of 24 January 2016, GENCODE v22 was the latest GENCODE track listed, but GENCODE v24 had already been released.) Empirical tracks are based on alignments of, e.g., spliced cDNA and protein sequences and are listed in Table 1. Annotation tracks based on algorithmic predictions from genome sequence (Augustus, GeneID, Genscan, N-SCAN, and SGP) were excluded because they comprise transcripts that were not directly observed in experiment. Ensembl was excluded because GENCODE is already a merge of Ensembl and HAVANA transcripts. After junction coordinates were extracted, all hg38 coordinates were lifted over to hg19 where feasible, and the union of all junctions was taken. Liftover of junctions was performed using the UCSCliftOver utility [36] with command-line parameters-ends 2 -minMatch=1.0. Since the
intropolisdatabase was formed from alignments to only the hg19 chromosomal assembly, only those junc-tions corresponding to thehg19chromosomal assembly were kept to form a final list of annotated junctions. Table 1 lists all gene annotations used to determine our set of annotated junctions. We froze these annotations on 24 January 2016 and compressed them into an archive avail-able at http://verve.webfactional.com/misc/jan_24_2016_ annotations.tar.gz. We ran the script https://github.com/ nellore/runs/blob/master/sra/rip_annotated_junctions. py with PyPy v2.5.0 to extract junctions from these anno-tations, performing coordinate conversions from hg38
tohg19where appropriate. The final list of junctions we defined as “annotated” is available at https://github.com/ nellore/runs/blob/master/sra/annotated_junctions.tsv.gz.
Selecting human SRA samples
Samples were selected by querying the SRA meta-data SQLite meta-database of the R/Bioconductor package SRAdb [9]. The database was downloaded from http:// gbnci.abcc.ncifcrf.gov/backup/SRAmetadb.sqlite.gz, but this file is updated regularly. The version of
SRAmetadb.sqlite.gz we used was updated on 1 April 2015, and it is available at ftp://ftp.ccb.jhu.edu/ pub/langmead/sra_junctions/SRAmetadb.sqlite.gz. We selected all run_accessions from thesratable with
platform = ’ILLUMINA’, library_strategy = ’RNA-Seq’, andtaxon_id = 9606(human) that also had URLs for FASTQs on the European Bioinformat-ics Institute server listed in thefastqtable. Our query may be reproduced with the script https://github.com/ nellore/runs/blob/master/sra/define_and_get_fields_ SRA.R compatible with R v3.1.0.
Alignment of human SRA samples with Rail-RNA
Nelloreet al. Genome Biology (2016) 17:266 Page 11 of 14
because ofhg19’s continued prevalence, including use by the GEUVADIS consortium [37] in its study of 462 lym-phoblastoid cell line (LCL) samples as well as the GTEx consortium [38] in its ongoing large-scale study of gene expression across human tissues. We performed a single pass of alignment; that is, reads were not realigned after junctions were discovered to improve alignments of short-anchored reads. See the “Junction detection” subsection below. Alignment was performed in the cloud using AWS Elastic MapReduce on Elastic Compute Cloud spot instances, i.e., standardized units of computing capac-ity. Spot instances permit bidding for computing to save money, where bids that equal or exceed a market price are fulfilled. However, if the market price drops below a bid, instances could be lost, and a computational job could fail. So saving money by bidding for spot instances comes with risk, and rather than aligning all samples in one batch, we distributed this risk by dividing alignment up into 43 batches of about 500 samples each. Analysis of each batch was itself divided into (1) a preprocessing job flow, which downloaded and preprocessed compressed FASTQs from the European Bioinformatics Institute’s mirror of the SRA, writing results to Amazon’s cloud storage service S3; and (2) an alignment job flow, which was configured to write only exon-exon junction coordinates and the number of reads in each sample mapping across each detected junc-tion. Each preprocessing job flow was run on a cluster of 21 c3.2xlarge instances, each with 8 Intel Xeon E5-2680 v2 (Ivy Bridge) processing cores and 15 GB of RAM. Each alignment job flow was run on a cluster of 61 c3.8xlarge instances, with 32 Intel Xeon E5-2680 v2 (Ivy Bridge) pro-cessing cores and 60 GB of RAM. Summing the sizes of the 43 compressed files output by the 43 runs gives 5.3 GB, about the size of an alignment BAM for a single RNA-seq sample. Our alignment runs may be reproduced by following the instructions at https://github.com/nellore/ runs/blob/master/sra/README.md.
Alignment cost
Alignment was performed over a period of eight days. There were 21,506 samples spanning 62.2 trillion nucleotides initially selected for alignment, but two sam-ples (run accession numbers SRR651690 and DRR023700) were not found on the European Bioinformatics Institute server and were therefore excluded. We used the Ama-zon Cost Explorer to compute total cost; summing across eight days of activity, it came to US$15,393.69, or 72 cents per sample. Costs divided up by Amazon service over the period of computational activity may be viewed at https:// github.com/nellore/runs/blob/master/sra/hg19.costs.csv.
Junction detection
Rail-RNA’s junction detection method, discussed in detail in the Rail-RNA study [7], begins by using Bowtie 2 [39]
in local alignment mode (-local) to align each read to the genome. If a read’s highest scoring alignment is soft-clipped, the read is retained and used for junction dis-covery. Otherwise, it is not used for junction discovery, on the principle that the parsimonious explanation for the read is that it is exonic. Reads with soft-clipping are then divided into short, overlapping segments called readlets. Readlets are aligned to the reference genome, and the alignments are clustered into sets of mutually compatible alignments. A gap between consecutively aligning readlets in a cluster is called as an exon-exon junction if an appro-priate two-base motif (e.g., GT and AG) appears on either side of the corresponding intron in the reference. If multi-ple clusters are tied for largest, indicating an ambiguously mapped read, Rail-RNA refrains from using that read for junction discovery.
Rail-RNA’s approach is both parsimonious, seeking to explain alignments with as few junctions as possible, and conservative, ignoring evidence from multi-mappers. Accordingly, for this study, we value precision over recall in order to make reliable statements about junctions missed by annotation. The approach could underestimate (1) the number of reads mapping across a junction in a sample, and (2) the number of samples in which a given junction is found. Since Rail-RNA excludes reads that align to the genome end-to-end from its junction discov-ery algorithm, it is also liable to miss junctions in a given gene for which there is a processed pseudogene. Details on Rail-RNA’s single-pass alignment algorithm may be found in Sections S.18 and S.19 of the Rail-RNA study [7].
Reproducing main figures
All data underlying Figs. 1, 2, 3, 5, and 6 are repro-ducible with the Python v2.7 script https://github.com/ nellore/runs/blob/master/sra/tables.py, which was run using PyPy v2.5.0. These figures as well as Fig. 4 were generated with the Mathematica v10.3.1 notebook; see https://github.com/nellore/runs/blob/master/sra/preprint _figures.nb. SEQC/MAQC-III consortium junction data were downloaded from http://www.nature.com/nbt/ journal/v32/n9/extref/nbt.2957-S4.zip. BioSample sub-mission dates for 77 SRA runs (0.3% of the samples we studied) were not found on the server, so these runs were excluded from the analyses involving junction discovery dates presented in Figs. 5 and 6.
Analysis of TRAP-seq samples
mm10_translatome_junctions.tsv.gz may be recovered with the script https://github.com/nellore/runs/blob/ master/sra/translatome.sh. Junctions were subsequently lifted over to hg19 with the UCSC liftOver utility [36] using the command-line parameters -ends 2 -minmatch=1.0; that is, we lifted over only the two-base motifs on either end of each intron and required that all four motif bases had mappings in the liftover. The script https://github.com/nellore/runs/blob/master/sra/ translatome.py calls the liftOver utility and writes lifted-over junctions and their presence in human anno-tation. Lifted-over junctions may be downloaded at https://github.com/nellore/runs/blob/master/sra/transla-tome_mm10_to_hg19_junctions.tsv.gz, where the format of this file is described in translatome.py. Statis-tics on the presence of lifted-over junctions in human SRA samples reported in the main text were computed by https://github.com/nellore/runs/blob/master/sra/get_ final_translatome_stats.sh.
Analysis of novelALKisoform
The junction inclusion ratioDdiscussed in the main text is defined as follows. Suppose the number of instances where junctions are overlapped by reads (i.e., the junction overlap count) inALKexons 1–19 isA, and the junction overlap count inALKexons 20–29 isB. The normalized differenceD=(B−A)/(A+B)is close to 1 when exons 1–19 are unexpressed compared to exons 20–29, and close to -1 when exons 20–29 are unexpressed compared to exons 1–19.
The ALK analysis may be reproduced by first filter-ing intropolis for junctions in ALK with the script https://github.com/nellore/runs/blob/master/sra/alk.sh, and then running the Mathematica 10.3.1 notebook https:// github.com/nellore/runs/blob/master/sra/alk.nb. Sam-ples found were checked manually for their descriptions on the SRA at http://www.ncbi.nlm.nih.gov/sra, and the UCSC Genome Browser screenshot of Fig. 7 was created using the Genome Browser’s PDF/PS utility.
Principal component analysis
Restrict attention to unannotated junctions found in at least 1000 of the 21,504 SRA samples we studied and fur-ther to only those samples with at least 100,000 reads each. Consider the number of readscijoverlapping theith
unannotated junction in the jth sample. We formed the normalized log-countsxij := log2
c
ij
Cj +1
, whereCj is
the number of mapped reads for samplej. We then used the row-centered matrixAfor PCA; that is,Aij=xij− ¯xi.
More specifically, we computed the cross product AtA
in a block-wise manner, and we subsequently performed a singular value decomposition (SVD) ofAtA to obtain the right-singular vectors (principal components) with a
randomized SVD algorithm [40]. Three correlates of PC1 are mentioned in the text. They are defined as
sj=
i
xij j=log2(1+pj)
mj=log2(1+Cj),
wherejindexes samples andpjis the read length in sample
j.
Scripts for reproducing the PCA analysis are available in the sra subdirectory of https://github.com/nellore/ runs and described in https://github.com/nellore/runs/ blob/master/sra/README.md. The output of the analysis sourced the Mathematica 10.3.1 notebook https://github. com/nellore/runs/blob/master/sra/preprint_figures.nb for generating Fig. 4.
Liftover ofintropolis
http://intropolis.rail.bio also provides a version of
intropoliswith junction coordinates lifted over from
hg19 to hg38. This was accomplished with the UCSC
liftOver utility [36] using command-line parameters
-ends 2 -minmatch=1.0; that is, we lifted over only the two-base motifs on either end of each intron and required that all four motif bases had mappings in the liftover, as in the TRAP-seq analysis. The script https://github.com/nellore/runs/blob/master/sra/liftover _intropolis.py reproduces our liftover.
Acknowledgements
We thank the reviewers for their insights, which strengthened the manuscript and in particular led us to pursue the reanalysis of publicly available TRAP-seq samples.
Availability of data and materials
The dataset is available from Figshare [41]. The code is also available from Figshare [42].
Authors’ contributions
AN, BL, and JTL conceived and designed the study. JAH obtained the list of SRA samples to align. AN and BL performed the alignment. AEJ, JPF, and KDH performed the PCA analysis. AN, AEJ, LCT, SW, RAP, and NK performed the other analyses. AN created all figures and tables. AN, BL, and JTL wrote a first draft of the paper, and AEJ, JPF, LCT, and KDH contributed to revisions. All authors read and approved the final manuscript.
Competing interests
The authors declare that they have no competing interests.
Ethics approval and consent to participate
No ethics approval was required for this work.
Author details
1Department of Computer Science, Johns Hopkins University, Baltimore, MD,
USA.2Department of Biostatistics, Johns Hopkins Bloomberg School of Public
Health, Baltimore, MD, USA.3Center for Computational Biology, Johns Hopkins
University, Baltimore, MD, USA.4Lieber Institute for Brain Development, Johns
Hopkins Medical Campus, Baltimore, MD, USA.5Department of Mental Health,
Johns Hopkins University, Baltimore, MD, USA.6Undergraduate Program in
Genome Sciences, National Autonomous University of Mexico, Mexico City, Mexico.7Department of Mathematics and Computer Science, Centre College,
Nelloreet al. Genome Biology (2016) 17:266 Page 13 of 14
Salisbury, MD, USA.9Department of Biological Sciences, University of Texas at
Austin, Austin, TX, USA.10McKusick-Nathans Institute of Genetic Medicine,
Johns Hopkins University, Baltimore, MD, USA.
Received: 13 June 2016 Accepted: 29 November 2016
References
1. Pruitt KD, Brown GR, Hiatt SM, Thibaud-Nissen F, Astashyn A, Ermolaeva O, Farrell CM, Hart J, Landrum MJ, McGarvey KM, et al. RefSeq: an update on mammalian reference sequences. Nucleic Acids Res. 2014;42(D1):756–63.
2. Harrow J, Frankish A, Gonzalez JM, Tapanari E, Diekhans M, Kokocinski F, Aken BL, Barrell D, Zadissa A, Searle S, et al. GENCODE: the reference human genome annotation for the ENCODE Project. Genome Res. 2012;22(9):1760–74.
3. Thibaud-Nissen F, Souvorov A, Murphy T, DiCuccio M, Kitts P. Eukaryotic genome annotation pipeline. 2013. https://www.ncbi.nlm.nih.gov/ books/NBK169439/.
4. Curwen V, Eyras E, Andrews TD, Clarke L, Mongin E, Searle SM, Clamp M. The Ensembl automatic gene annotation system. Genome Res. 2004;14(5):942–50.
5. Consortium EP, et al. The ENCODE (ENCyclopedia Of DNA Elements) Project. Science. 2004;306(5696):636–40.
6. Illumina Body Map 2.0 on ArrayExpress. http://www.ebi.ac.uk/ arrayexpress/browse.html?keywords=E-MTAB-513&expandefo=on. Accessed 10 Dec 2016.
7. Nellore A, Collado-Torres L, Jaffe AE, Morton J, Pritt J,
Alquicira-Hernández J, Leek JT, Langmead B. Rail-RNA: scalable analysis of RNA-seq splicing and coverage. Bioinformatics. 2016575. https://www. ncbi.nlm.nih.gov/pubmed/27592709.
8. Steijger T, Abril JF, Engström PG, Kokocinski F, Hubbard TJ, Guigó R, Harrow J, Bertone P, Consortium R, et al. Assessment of transcript reconstruction methods for RNA-seq. Nat Methods. 2013;10(12):1177–84. 9. Zhu Y, Stephens RM, Meltzer PS, Davis SR. SRAdb: query and use public
next-generation sequencing data from within R. BMC Bioinforma. 2013;14(1):19.
10. Rosenbloom KR, Armstrong J, Barber GP, Casper J, Clawson H, Diekhans M, Dreszer TR, Fujita PA, Guruvadoo L, Haeussler M, et al. The UCSC Genome Browser database: 2015 update. Nucleic Acids Res. 2015;43(D1): 670–81.
11. Consortium SI, et al. A comprehensive assessment of RNA-seq accuracy, reproducibility and information content by the Sequencing Quality Control Consortium. Nat Biotechnol. 2014;32(9):903–14.
12. Zhang W, Yu Y, Hertwig F, Thierry-Mieg J, Zhang W, Thierry-Mieg D, Wang J, Furlanello C, Devanarayan V, Cheng J, et al. Comparison of RNA-seq and microarray-based models for clinical endpoint prediction. Genome Biol. 2015;16(1):1.
13. Dobin A, Davis CA, Schlesinger F, Drenkow J, Zaleski C, Jha S, Batut P, Chaisson M, Gingeras TR. STAR: ultrafast universal RNA-seq aligner. Bioinformatics. 2013;29(1):15–21.
14. Liao Y, Smyth GK, Shi W. The Subread aligner: fast, accurate and scalable read mapping by seed-and-vote. Nucleic Acids Res. 2013;41(10):108–8. 15. Li S, Tighe SW, Nicolet CM, Grove D, Levy S, Farmerie W, Viale A,
Wright C, Schweitzer PA, Gao Y, et al. Multi-platform assessment of transcriptome profiling using RNA-seq in the ABRF next-generation sequencing study. Nat Biotechnol. 2014;32(9):915–25.
16. Barrett T, Clark K, Gevorgyan R, Gorelenkov V, Gribov E, Karsch-Mizrachi I, Kimelman M, Pruitt KD, Resenchuk S, Tatusova T, et al. BioProject and BioSample databases at NCBI: facilitating capture and organization of metadata. Nucleic Acids Res. 2012;40(D1):57–63.
17. Bernstein BE, Stamatoyannopoulos JA, Costello JF, Ren B, Milosavljevic A, Meissner A, Kellis M, Marra MA, Beaudet AL, Ecker JR, et al. The NIH Roadmap Epigenomics Mapping Consortium. Nat Biotechnol. 2010;28(10):1045–8.
18. Jaffe AE, Shin J, Collado-Torres L, Leek JT, Tao R, Li C, Gao Y, Jia Y, Maher BJ, Hyde TM, et al. Developmental regulation of human cortex transcription and its clinical relevance at single base resolution. Nat Neurosci. 2015;18(1):154–61. doi:10.1038/nn.3898. https://www.ncbi.nlm. nih.gov/pubmed/25501035.
19. Consortium EP, et al. A user’s guide to the Encyclopedia of DNA Elements (ENCODE). PLoS Biol. 2011;9(4):1001046.
20. Pickrell JK, Marioni JC, Pai AA, Degner JF, Engelhardt BE, Nkadori E, Veyrieras JB, Stephens M, Gilad Y, Pritchard JK. Understanding mechanisms underlying human gene expression variation with RNA sequencing. Nature. 2010;464(7289):768–72.
21. Cheung VG, Nayak RR, Wang IX, Elwyn S, Cousins SM, Morley M, Spielman RS. Polymorphic cis-and trans-regulation of human gene expression. PLoS Biol. 2010;8(9):2213.
22. Janoueix-Lerosey I, Lequin D, Brugieres L, Ribeiro A, de Pontual L, Combaret V, Raynal V, Puisieux A, Schleiermacher G, Pierron G, et al. Somatic and germline activating mutations of the ALK kinase receptor in neuroblastoma. Nature. 2008;455(7215):967–70.
23. Mossé YP, Laudenslager M, Longo L, Cole KA, Wood A, Attiyeh EF, Laquaglia MJ, Sennett R, Lynch JE, Perri P, et al. Identification of ALK as a major familial neuroblastoma predisposition gene. Nature.
2008;455(7215):930–5.
24. George RE, Sanda T, Hanna M, Fröhling S, Luther II W, Zhang J, Ahn Y, Zhou W, London WB, McGrady P, et al. Activating mutations in ALK provide a therapeutic target in neuroblastoma. Nature. 2008;455(7215): 975–8.
25. Chen Y, Takita J, Choi YL, Kato M, Ohira M, Sanada M, Wang L, Soda M, Kikuchi A, Igarashi T, et al. Oncogenic mutations of ALK kinase in neuroblastoma. Nature. 2008;455(7215):971–4.
26. Soda M, Choi YL, Enomoto M, Takada S, Yamashita Y, Ishikawa S, Fujiwara S-I, Watanabe H, Kurashina K, Hatanaka H, et al. Identification of the transforming EML4–ALK fusion gene in non-small-cell lung cancer. Nature. 2007;448(7153):561–6.
27. Shaw AT, Kim DW, Nakagawa K, Seto T, Crinó L, Ahn MJ, De Pas T, Besse B, Solomon BJ, Blackhall F, et al. Crizotinib versus chemotherapy in advanced ALK-positive lung cancer. N Engl J Med. 2013;368(25):2385–94. 28. Iwahara T, Fujimoto J, Wen D, Cupples R, Bucay N, Arakawa T, Mori S,
Ratzkin B, Yamamoto T. Molecular characterization of ALK, a receptor tyrosine kinase expressed specifically in the nervous system. Oncogene. 1997;14(4):439–49.
29. Wiesner T, Lee W, Obenauf AC, Ran L, Murali R, Zhang QF, Wong EW, Hu W, Scott SN, Shah RH, et al. Alternative transcription initiation leads to expression of a novel ALK isoform in cancer. Nature. 2015;526(7573): 453–7.
30. Donlin LT, Jayatilleke A, Giannopoulou EG, Kalliolias GD, Ivashkiv LB. Modulation of TNF-induced macrophage polarization by synovial fibroblasts. J Immunol. 2014;193(5):2373–83.
31. Zhang Q, Wang HY, Bhutani G, Liu X, Paessler M, Tobias JW, Baldwin D, Swaminathan K, Milone MC, Wasik MA. Lack of TNFαexpression protects anaplastic lymphoma kinase-positive T-cell lymphoma (ALK+TCL) cells from apoptosis. Proc Nat Acad Sci. 2009;106(37):15843–8.
32. Hupe M, Li MX, Gillner KG, Adams RH, Stenman JM. Evaluation of trap-sequencing technology with a versatile conditional mouse model. eLife. 2016;5:e11752. doi:10.7554/eLife.11752. https://www.ncbi.nlm.nih. gov/pmc/articles/PMC4801060/.
33. Vaquero-Garcia J, Barrera A, Gazzara MR, Gonzalez-Vallinas J, Lahens NF, Hogenesch JB, Lynch KW, Barash Y. A new view of transcriptome complexity and regulation through the lens of local splicing variations. Elife. 2016;5:11752.
34. Farkas MH, Grant GR, White JA, Sousa ME, Consugar MB, Pierce EA. Transcriptome analyses of the human retina identify unprecedented transcript diversity and 3.5 Mb of novel transcribed sequence via significant alternative splicing and novel genes. BMC Genomics. 2013;14(1):486.
35. Cunningham F, Amode MR, Barrell D, Beal K, Billis K, Brent S, Carvalho-Silva D, Clapham P, Coates G, Fitzgerald S, et al. Ensembl 2015. Nucleic Acids Res. 2015;43(D1):662–9.
36. Kent WJ, Sugnet CW, Furey TS, Roskin KM, Pringle TH, Zahler AM, Haussler D. The human genome browser at UCSC. Genome Res. 2002;12(6):996–1006.
37. Lappalainen T, Sammeth M, Friedländer MR, AC’t Hoen P, Monlong J, Rivas MA, Gonzàlez-Porta M, Kurbatova N, Griebel T, Ferreira PG, et al. Transcriptome and genome sequencing uncovers functional variation in humans. Nature. 2013;501(7468):506–11.
39. Langmead B, Salzberg SL. Fast gapped-read alignment with Bowtie 2. Nat Methods. 2012;9(4):357–9.
40. Halko N, Martinsson PG, Tropp JA. Finding structure with randomness: probabilistic algorithms for constructing approximate matrix decompositions. SIAM Rev. 2011;53(2):217–88.
41. Exon-exon junction dataset at Figshare. https://dx.doi.org/10.6084/m9. figshare.3811680.v1. Accessed 10 Dec 2016.
42. Scripts for analysis at Figshare. https://dx.doi.org/10.6084/m9.figshare. 3811629.v1. Accessed 10 Dec 2016.
43. Pruitt KD, Harrow J, Harte RA, Wallin C, Diekhans M, Maglott DR, Searle S, Farrell CM, Loveland JE, Ruef BJ, et al. The Consensus Coding Sequence (CCDS) Project: Identifying a common protein-coding gene set for the human and mouse genomes. Genome Res. 2009;19(7):1316–23. 44. Temple G, Gerhard DS, Rasooly R, Feingold EA, Good PJ, Robinson C,
Mandich A, Derge JG, Lewis J, Shoaf D, et al. The completion of the Mammalian Gene Collection (MGC). Genome Res. 2009;19(12):2324–33. 45. Benson DA, Karsch-Mizrachi I, Lipman DJ, Ostell J, Wheeler DL. GenBank:
update. Nucleic Acids Res. 2004;32(Database issue):23.
• We accept pre-submission inquiries
• Our selector tool helps you to find the most relevant journal • We provide round the clock customer support
• Convenient online submission • Thorough peer review
• Inclusion in PubMed and all major indexing services • Maximum visibility for your research
Submit your manuscript at www.biomedcentral.com/submit
![Fig. 1 Displayed is the number of exon-exon junctionsaligners” (human reference RNA-seq samples also studied by the SEQC/MACQ-III consortium [11] (i.e., SEQC)](https://thumb-us.123doks.com/thumbv2/123dok_us/8601559.864925/3.595.59.540.86.300/displayed-number-junctionsaligners-reference-samples-studied-seqc-consortium.webp)