6
I
January 2018
Performance Evaluation of ANFIS algorithm for
Diagnosis of Faults in Power Transformers
Suhashini Shinde1, Syed Gilani Pasha2 1, 2
Assistant Professor, School of Engineering, Central University of Karnataka, Gulbarga, Karnataka, India
Abstract: Fault diagnosis in transformer is a motivating topic in power plant generation operator due to its criticality. Several international standards are available which gives insight to understand the power transformer faults based on Dissolved Gas Analysis (DGA). In some scenarios these standards are not capable to provide correct fault diagnosis. One of the frequently used soft computing modeling techniques used for power transformer is Adaptive Neuro-Fuzzy Inference System (ANFIS). In this paper, we present an ANFIS technique using DGA for concurrent identification of fault type and its location. The ANFIS algorithm is simulated in MATLAB and the simulation results shows that the proposed ANFIS model is capable to determine the transformer faults with high precision
Keywords: ANFIS, Dissolved Gas Analysis (DGA), fuzzy, gas, CO2, fault
I. INTRODUCTION
Power transformers are vital devices in a transmission and distribution system. Power transformers fault free operation is a factor of major cost-effective significance and safety in power supply utilities and industrial consumers of electricity. Power transformers are constantly under the impact of electrical, mechanical, thermal and environmental stresses and this stresses degrade insulation quality of transformers [1]. Power failure of power transformer can be avoided by periodically monitoring the conditions of transformers. The transformer even sometimes experiences electrical faults such as partial discharge, low and high energy discharges and thermal faults. This results into decomposition of mineral oil used in the power transformer and liberates gases. The gases dissolve in oil and gases are extracted by means of gas chromatograph and examined in the laboratory. DGA is used to evaluate the health of the power transformers. IEC/IEEE standard, Roger’s ratio, Dual triangle is one of the Dissolved Gas Analysis (DGA) interpretation methods. The various approaches for fault diagnosis/diagnosis in power transformers are dissolved gas, measurement of breakdown voltage and tan-δ, pollution, sludge, and Interfacial Tension Tests (ITT) are described in [2]. The DGA is the commonly used technique for evaluating health of the power transformers. Thermal stress and also electrical stress results in fracture of the insulating materials and the release of some gases. Analysis of these gases presents vital information on the type of faults. International Electro-technical Commission (IEC) standards [3]–[5], have been recommended for the detection of transformer faults with the ratio of dissolved gases in the transformer oil. In few standards, faults cannot be diagnosed or located precisely. In order to improve the reliability of fault diagnosis intelligent algorithms such as wavelet networks [6], neuro-fuzzy networks [7], fuzzy logic [8], and artificial neural networks (ANN)[9],are used. In these techniques, first the type of fault is diagnosed and then the fault is located by taking the ratio of the concentrations of CO2 and CO dissolved in the transformer oil [10], [11] [12]. The algorithms are not completely suitable.
The wavelet network algorithm has high efficiency except low convergence, the number of input are limited in fuzzy logic algorithm and, in a few cases, it is very complicated to derive it from the logic rules, and a reliable training patterns is needed for ANN in order to improve fault diagnosis performance.
II. DISSOLVED GAS ANALYSIS
In regular operation of transformer oil contains gases such as H2, CH4, C2H4, C2H2, O2, and N2 and there will be no fault. Whenever
a fault is there, the concentration of a few of these gases increase, depending on what type of fault it is and its present location. The gases of transformer oil can be classified into three types as mentioned below.
1) Hydrogen and Hydrocarbons: H2, C2H4, CH4, C2H2;
2) Carbon oxides: CO2 and CO; and
3) No-fault gases: O2 and N2.
In [8], [22] describes about the accepted association among faults and dissolved gas concentrations which is given as.
a) H2 and C2H2- Increasing the concentration of H2 and C2H2 is a positive an indication of arcing faults. Temperature in excess of
b) C2H6, C2H4, CH4, C3H8/C3H6 (propane/propylene) and H2: An increased concentration of C2H4, in combination with any one of
C2H6, CH4, and C3H8/C3H6, indicates thermal decomposition of the oil in transformers. The propane/propylene gases are
produced when the temperature is lower than 250°C.
c) H2 and CH4: These gases are produced, if the partial discharge and corona occurs in the transformers oil.
d) CO2 and CO: The production of these gases points out of corona, partial discharge and thermal ageing in cellulosic insulation.
e) H2 and O2: The incidence of H2 and O2 gases in the transformer oil, along with the absence of any hydrocarbon gas, indicates
the existence of water particles in the transformer oil.
A. The DGA Standards:
The three DGA standards are as follows.
1) IEC Standard: In paper [3]indicate fault type, a code of three digits (X, Y, Z) are used and each digit in code indicates a ratio of gas concentration (X = C2H2/C2H4; Y = CH4/H2; and Z = C2H4/C2H6). The output pattern for this standard is, where O0 is
absence of the fault, O1 indicates the low energy partial discharges, O2 indicates high energy partial discharges, O3 indicates a
low energy discharge or an arc, O4 indicates an high energy discharge (arc), O5 indicates a thermal fault and it is less than
150°C, O6 indicates a thermal fault ranging from 150°C to 300°C, O7 indicates a thermal fault ranging from 300°C to 700°C,
and O8 indicates a thermal fault at greater than 700°C.
2) Rogers Ratio Method: In [5].In this method the ratios of three gas are used, CH4/H2, C2H4/C2H6, and C2H2/C2H4.
3) Doernenburg Ratio Method: In this method [7] the ratios of these four gases CH4/H2, C2H2/C2H4, C2H2/CH4, and C2H6/C2H2 are
used to diagnose the fault in the transformer oil. The procedure is suitable, provided that the concentration level of one of these gases, at least in each of the ratio exceeds the requisite minimum concentration limits (L1)
B. Different Types of Faults in Transformers.
The IEC-599 points out to the revelation of the DGA outcome for mineral oils in transformers. These faults are divided as thermal types and electrical types.
For the thermal fault, when temperature T1 is less than 300° C, the paper insulation of transformer will turn brownish.
For the thermal faults, when temperatures T2 is in the range of 300°C and 700° C, then the paper insulation of transformer will be
carbonised.
For the thermal faults, when temperature T3 is higher than 700° C, the oil is carbonised and the metal becomes coloured or will fuse.
Different electrical faults comprise of partial discharge, low energy and high energy discharge. The wax is formed in the oil due to partial discharge. The Low and high energy discharge are the result of electrical discharge through the oil, or paper insulation, or at the surface of the paper insulation, otherwise the development of conducting paths (small arcs) due to degradation of the surface of the paper insulation.
C. CO2/CO gas Ratio.
In paper [15] the author describes faults happening in the paper insulation of transformer are usually considered to be more severe than the faults happening in the insulating oil of transformer. In transformers the paper insulation fault in located in the region of high electric field. Hence the degradation of paper insulation fault results into short-circuiting and severe arcing effects. As a result, fault detection through DGA or by some different methods is of significant interest from our point of view.
The gases such as CO2, CO and other fractional quantities of gases are produces due to degradation of paper insulations of power
transformers [3], [4], [5]. Due to degradation of high-temperature of cellulose will decrease the CO2/CO ratios, however the rates of
CO2 and CO production mainly depends on availability of O2, moisture, and heat in the power transformers. However, if the ratio of
CO2/CO is less than about 3 or greater than about 11, the possibility of a fault in power transformer relating cellulose degradation must be taken into account [3]. The thermal stress gives rise to the generation of CO and CO2 in the transformer oil as mentioned in
[10] along with the varying concentrations of transformer type. The power transformers which are new or freshly oiled with high CO2/CO ratios, the concentration of CO & CO2 increases initially
III. PROPOSED WORK
using MATLAB tool. In ANFIS algorithm, the first step is to diagnose the type of fault and then the fault is located using the concentration ratio of CO2 and CO dissolved in the power transformer oil. According to the IEC 599 [3], initially ANFIS algorithm
is trained, in order to acquire certain fault determination abilities. The CO2/CO ratio is used as extra input information enabling
concurrent diagnosis of fault type and its location. The ANFIS algorithm is then simulated in MATLAB and the results shows that ANFIS proposed model is able to estimate the power transformer faults with high level of accuracy.
A. ANFIS Structure
In ANFIS network the number of node are connected using directional links which can be adaptive or fixed. The adaptive node output depends on the parameters shaping its input, but the fixed node output depends only on the previous layer output. A layer consists of all nodes having same inputs. ANFIS structure consists of five layers, connecting n-inputs to 1-output denoted by ‘f’. It has three inputs such as (X1 = C2H2/C2H4, X2 = CH4/H2, X3 = C2H4/C2H6) and 1-output (Oi). The outcome Oi indicates the output
pattern for the ith fault. In order to determine O0 through O8 nine ANFIS systems must be used. For easing, we considered it to be
two inputs as mentioned in Fig.1.
Fig.1. Structure of ANFIS network having two inputs and one output.
In an ANFIS network with n-inputs, the layer-1 comprises of n2 nodes, so the two-input network as shown in Figure 1. has four
nodes, A11, A12, A21, and A22 and these nodes belongs to a fuzzy-set comprising of letters of the alphabet, numbers, etc.
There is a gradual change-over of an element present in a set to the same element not present to the same set in[13].A function of membership 1(maximum) in a fuzzy system, indicates a full-membership of an element in a set and a function of membership 0(minimum) indicates zero membership in a fuzzy system . The output from the each node of layer-1 is the membership of input to the fuzzy sets (A11, A12, A21, A22). Some triangular, trapezoidal functions could be a suitable membership function. In layer-2, there
are Prod1 and Prod2 nodes. The Prod1 output W1 = A11 × A21, and the Prod2 output W2 = A12 × A22. The layer-3 consists of Norm1
and Norm2. The Norm1 outputs W1 = W1/(W1 + W2) and the Norm2 output W2 = W2/(W1 + W2). The layer-4 has two adaptive nodes,
represented by the square boxes and diagonal arrows. Thus X1 and X2 (the inputs to layer-1) are modifiable parameters of layer-4.
The outputs of layer-4 (f1 and f2) are determined by the fuzzy Sugeno interface system relation. The layer-5 contain single-node
B. Training Procedure
[image:5.612.119.500.116.293.2]Here a hybrid-training procedure combining the gradient descent technique along with Least-Squares Estimate (LMSE) is used to ANFIS network training as mentioned in [24].
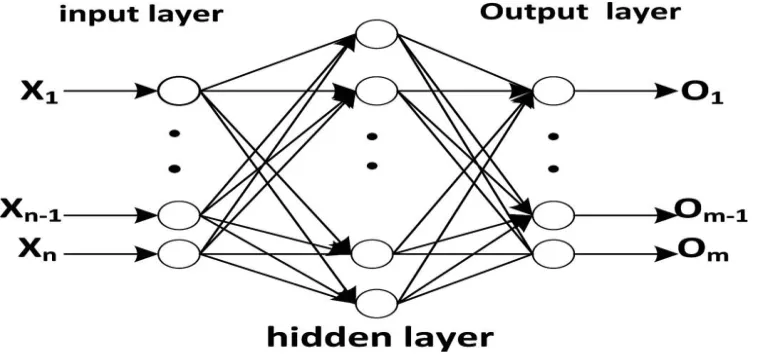
Fig. 2 A Feed-forward neural network model.
C. Feed-Forward ANN
For finding faults using ANN Technique, we use the relationships between the dissolved gases and the transformer fault types through a training process because the normal DGA methods cannot recognized this relationships. Fig. 2 shows the structure of feed-forward network. in this figure prod nodes represented by circles The output of each node propagates forward to the output [14]. According to IEC standard ANN has 3-inputs and 9-outputs, O0 through O8. With reference to IEC standard, the training data
for fault-1 are C2H4/ C2H6 < 1, CH4/H2 < 0.1, and C2H2/C2H4 < 0.1. The output to fault O1 =1, and the outputs for remaining faults
are all zeros.The each inputs in ANN are weighted by multiplying connection strength weight. During the training procedure to reduce the difference between the required output and the actual output of the ANN, for the same input patterns these weights are adjusted. For the training process, the initial input and output patterns are used and the former are obtained using the DGA data. In accordance to the IEC fault diagnosis standards, for each input pattern, there is an output pattern which shows the type of fault present [2], [9], [10].
D. Simultaneous Diagnosis of Fault Type and Location The two most important stages are training and testing.
1) Training Stage: During the training stage, the initial values of the parameters of ANFIS are given for each one standard and gas chromatography data for various transformers. It permits the initial training data set to be calculated for each standard. And also the ANFIS network is trained for diagnosis of data faults. The input comprises of about 5-gas ratios ensuing the output is a binary number. Thus the training data for fault 1 of the IEC standard in oil are C2H4/C2H6 < 1, CH 4/H2 < 0.1, C2H2/C2H4 < 0.1
and 3 < CO2/CO < 1 and the matching reference output value (O1) is 1 [3], [4]. The training for these ratios results the output
equal to 0; with reference to other faults. In this proposed work, one additional output value was used, so as to find the fault location is determined concurrently with the fault type. We use minimum 10-training input and output sets to train the network for every fault in each standard. Also a separate network was trained for each fault. Epoch is the steps performed in ANFIS training process. when epoch = epochmax the training procedure is completed. The epochmax should be sufficiently large to
permit the training process to congregate to such a level that the variation between the ANFIS output and zero or one (then the error) is < 0.001.
2) Testing Stage
then it is used to confirm the fuzzy inference model. Using DGA data-set, if the errors between the ANFIS network outputs and the desired outputs increases, the setting of the adaptable parameters of the Sugeno-type fuzzy system is not correct and ANFIS network must be trained once again with an extra setting of adaptable parameters
IV. SIMULATION RESULTS & DISCUSSIONS
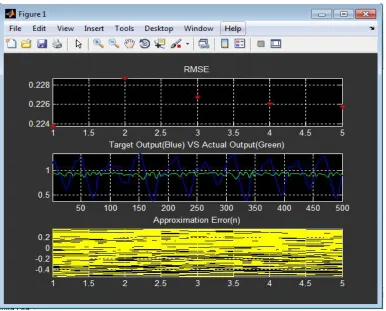
The implementation and simulation of proposed diagnosis technique (ANFIS), is carried out using MATLAB2010 tool and simulation results are shown in Fig.3.
Gas: H2=100; CH2=120; CO=350; C2H2=1; C2H4=50; C2H6=65.
A. Simulation input parameters Enter no of epochs: 5
Enter no of samples: 500
Fig.3 shows the graph of RMSE, Target Output V/s actual Output and Approximation Error. To study and analyse the proposed diagnosis method six transformers are utilized. In certain cases, conventional standards were not capable to diagnose the faults that had developed in these transformers. By using ANFIS the Fault diagnosis and location were performed, and results is compared by results obtained using ANN and also with the other conventional standards. Gas chromatography data are used to obtain the performance test of ANFIS using other 19 transformers. Table I shows the Dissolved Gas Concentrations in Six Transformers. Table II shows the Dissolved Gas Concentrations in a set of 19 Transformers
Fig.3.Outcome of RMSE, Target Output V/s actual Output and Approximation Error.
V. CONCLUSION
The implementation and simulation of proposed diagnosis technique (ANFIS), is successfully carried using MATLAB2010 tool and Simulation results show that ANFIS model is capable to estimate the faults of power transformer with high level of accuracy. We have been analyzed an ANFIS technique using classical standards for detection of fault type and fault location in power transformers.
[image:6.612.115.501.309.620.2]REFERENCES
[1] Fofana, A. Bouaicha, M. Farzaneh, J. Sabau, D. Bussieres, and E. B. Robertson, “Decay Products in the Liquid Insulation of Power Transformers,” in IET Electronic. Power Appl., Vol.4, no. 3, pp. 177–184, 2010.
[2] I. N. da Silva, M. M. Imamura, and A. N. de Souza “The application of neural networks to the analysis of dissolved gases in insulating oil used in transformers,” IEEE International Conference on Systems, Man and Cybernetics, vol. 4, pp. 2643–2648, Oct. 2000.
[3] Guide to the Interpretation of Dissolved and Free Gases Analysis, IEC Publ. 60599, 2007.
[4] M. Duval and A. DePabla, “Interpretation of gas-in-oil analysis using new IEC Publication 60599 and IEC TC 10 Databases,” IEEE Electr. Insul. Mag., vol. 17, no. 2, pp. 31–41, 2001.
[5] R. R. Rogers, “IEEE and IEC codes to interpret incipient faults in transformers using gas-in-oil analysis,” IEEE Trans. Electr. Insul., vol. EI-13, no. 5, pp. 349–354, 1978.
[6] W. Chen, C. Pan, Y. Yun, and Y. Liu, “Wavelet networks in power transformers diagnosis using dissolved gas analysis,” IEEE Trans. Power Delivery, vol. 24, no. 1, pp. 187–194, 2009.
[7] J. L. Guardado, J. L. Naredo, P. Moreno, and C. R. Fuerte, “A comparative study of neural network efficiency in power transformers diagnosis using dissolved gas analysis,” in IEEE Trans. Power Delivery, vol. 16, no. 4, 2001.
[8] R. Hooshmand and M. Banejad, “Fuzzy Logic Application in Fault Diagnosis of Transformers Using Dissolved Gases,” J. Electr. Eng. Technol., vol. 3, no. 3, pp. 293–299, 2008.
[9] D. V. S. S. Siva Sarma and G. N. S. Kalyani, “ANN Approach for Condition Monitoring of Power Transformers Using DGA,” in IEEE Trans. Power Syst., vol. 3, pp. 444–447, Nov. 2004.
[10] I. Hohlein-Atanasova and R. Frotscher, “Carbon Oxides in The Interpretation of Dissolved Gas Analysis in Transformers and Tap Changers,” IEEE Electr. Insul. Mag., vol. 26, no. 6, pp. 22–26, 2010.
[11] Electric Power Research Institute (EPRE), “Condition Monitoring & Diagnostics of Bushings, Current Transformers, & voltage Transformers by Oil Analysis,” in Technical Update, EPRE, Palo Alto, CA, Dec. 2006.
[12] A. Akbari, A. Setayeshmehr, H. Borsi, E. Gockenbach, and I. Fofana, “Intelligent agent-based system using dissolved gas analysis to detect incipient faults in power transformers,” IEEE Electr. Insul. Mag., vol. 26, no. 6, pp. 27–40, 2010.
[13] J. S. R. Jang, C. T. Sun, and E. Mizutani, Neuro-Fuzzy and Soft Computing. New Delhi, India: Prentice Hall of India, 2008. [14] R. J. Schalkoff, Artificial Neural Networks. New York, NY: McGraw-Hill, 1997.