6
I
January 2018
Numerical Analysis and Optimization of
Corrugated Heat Exchanger with Taguchi Method
Chandra Shekhar Pandey1, Harimohan Sharma2, Manish Dadhich3,Sheetal Kumar Jain4 1, 2
Department of Mechanical Engineering, Apex Institute of Engineering and Technology Jaipur, 3RTU Kota, 4MNIT Jaipur
Abstract: Heat transfer from one fluid to another is important application in engineering science, various type of heat exchanger devices was developed by engineers from previous decades. Research on these devices continues in present era to improve thermal performance. Various shapes are used by engineers to improve thermal performance. Main common shapes are like simple straight pipe, curved shape pipe, twisted shape pipe, custom shape pipes like corrugated plate heat exchanger. In present study three type of corrugated plates are selected which are following simple flat plate, circular plate, angular plate type heat exchangers are investigated in present thesis. Simple U bend tubes are experimental investigated and validated with numerical simulation and present in research work. Design of experiment (DOE) “Taguchi” method is selected for this research work and total 16 experiments are selected and solved by using Ansys fluent software. Signal to noise ratio analysis and ANOVA analysis is performed for outlet
Keywords: Corrugated plate heat exchanger; CFD; DOE; Taguchi method; ANOVA
I. INTRODUCTION
Heat exchanger is mechanical thermal equipment which is used to transfer thermal energy between two or more fluid, between fluid and solid surface (Practical), at different temperature in thermally contact. It does not require any external heat and work interaction. The purpose of constructing a heat exchanger is to get an efficient method of heat transfer from one fluid to another, by direct contact or by indirect contact. It is using in various practical application filed such as heating and cooling of fluids, space heating, refrigeration, air conditioning, power stations, chemical plant, petroleum refinery, sewage treatment etc. Some common heat exchangers are shell and tube, condensers, evaporator, automobile radiator, cooling tower and air pre-heater. In heat exchanger, tube is important role play to transfer energy therefore many research works are carried out to improved heat exchanger tube by using heat enhancement techniques.
Xiao-Hong Han et al. [1] investigated on chevron folded plate heat exchanger was re-enacted, and the three-dimensional temperature, weight, and speed fields were gotten. From the temperature field we can see that in the main zone, the temperature slope increments step by step and get the most extreme; in the focal of the stream, the temperature inclination winds up noticeably littler once more. The most astounding temperature shows up around the upper port, while the least temperature shows up in the driving rain liquid inflow around the lower port. From the weight field, we can see that the liquid weight is progressively diminished along the stream heading.
Harika Sammeta et al. [2] studied on Gasket plate heat exchangers (PHEs) are utilized as a part of refrigeration and heat pump plants and are broadly utilized as a part of the handling of sustenance and beverages, where the simplicity of plate cleaning also, re-gasket (in)g are critical. Existing literary works give an account of the estimation strategy, execution examination for various stream arrangements, CFD displaying and re-enactment for diverse number of plates with different stream designs and in addition passes, examination outlines for level PHE, and so forth.
Enlu Wang et al. [3] studied on mass and heat exchange execution of turning air preheaters comprising of honeycomb earthenware production and metal creased plates. The trial think about was done by a bi-directional exchanging hot breeze burrow loaded with single heat exchange network. The heat exchange and protection observational connections, also, the connections amongst adequacy and number of exchange unit were reasoned from measured information. Under similar conditions, higher outlet air temperature and heat exchange viability, bring down weight drop happened in the metal heat exchange components. The impacts of exchanging time and vent gas speed on stream and heat exchange execution of turning air preheaters were dissected.
Subsequently, in the present work exegetic parameters were tentatively concentrated for a shell and tube warm exchanger made of corrugated shell and corrugated tube.
Marjan Goodarzi et al. [5] studied on distinctive practical covalent gatherings on the thermos physical properties of carbon nanotube-base liquid was first examined tentatively. To reveal more insight into this issue, cysteine (Cyst) and silver (Ag) were covalently connected to the surface of the multi-walled carbon nanotubes (MWCNT). Usefulness and morphology were contemplated by the guide of portrayal instruments to affirm surface functionalization.
Hoseong Lee [6] studied on Warm and water powered execution of a sinusoidal corrugated plate warm exchanger (PHX) was explored for the utilization of a low temperature lift warm pump (LTLHP), which requires interesting working conditions. The water-side warmth exchange coefficient and weight drop of the PHX were acquired through the trial test. The refrigerant-side warmth exchange execution was researched by differing a few parameters. The PHX execution was poor because of low refrigerant mass motion.
Václav DvořáK [7] studied on Stream and warmth move in an aerial recuperative counter-stream plate warm exchanger were researched numerically. Weight drop and adequacy were assessed as elements of gulf speed for three sizes of genuine warmth exchangers. Acquired information were broke down, gulf/outlet cross-stream and centre counter-stream parts were researched autonomously and information were substituted by recommended capacities for Nusselt number and misfortune coefficients. These capacities were utilized to represent the impact of warmth exchanger measurements.
Shenghan Jin [8] investigated the for single-stage (water) in both edge and-plate (FPHE) and brazed plate warm exchangers (BPHE) are given different number of chevron plates in U-type stream game plan. Investigation of the exploratory outcomes demonstrates that the end plates, rather than being adiabatic, work as blades because of the contact between nearby plates. The exploratory information is utilized to approve a warm conduction display in ANSYS, which shows that the end plates blade productivity is a component of liquid convective warmth exchange coefficient and conductive warm protection.
M. Faizal et al. [9] studied on corrugated plate warm exchanger for little temperature contrast applications. Tests were performed o a solitary groove design on 20 plates organized parallelly, with an aggregate warmth exchange region of 1.16298 m2. The separating DX, between the plates was shifted (DX = 6 mm, 9 mm, and 12 mm) to tentatively decide the design that gives the ideal warm exchange. Water was utilized on both the hot and the cool channels with the stream being parallel and entering the warmth exchanger from the base. The high temp water flow-rates were changed.
Shive Dayal Pandey et al. [10] studied on three channel 1e1 pass plate warm exchanger (PHE). Air was made to stream in the focal channel to get warmed by water in the external channels under states of counter and parallel streams.
II. DOE GENERATION
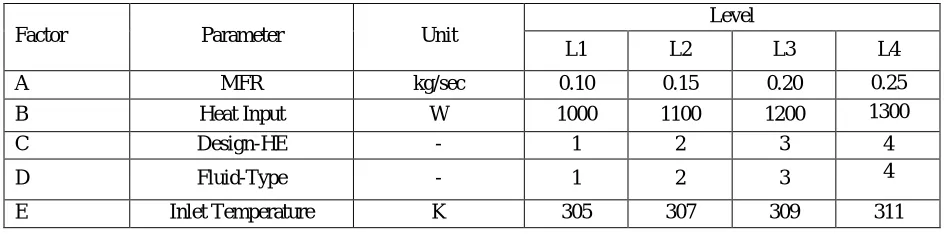
[image:3.612.70.544.574.691.2]For the present experimental work, the five process parameters each at four levels have been decided for Taguchi method. It is desirable to have three minimum levels of process parameters to reflect the true behaviour of output parameters of study. The process parameters are renamed as factors and they are given in the adjacent column. The levels of the individual process parameters/factors are given in Table 1. Table 2 shows the L16 orthogonal array of desired design of experiments and Table 3 shows the response table of these 16 experiments where response is outlet temperature of pipe of heat exchanger.
Table 1.
Process parameters and their levels (taguchi method)
Factor Parameter Unit
Level
L1 L2 L3 L4
A MFR kg/sec 0.10 0.15 0.20 0.25
B Heat Input W 1000 1100 1200 1300
C Design-HE - 1 2 3 4
D Fluid-Type - 1 2 3 4
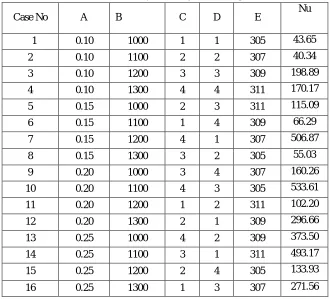
TABLE 2
L16 ORTHOGONAL ARRAY Case
No A B C D E
1 0.10 1000 1 1 305
2 0.10 1100 2 2 307
3 0.10 1200 3 3 309
4 0.10 1300 4 4 311
5 0.15 1000 2 3 311
6 0.15 1100 1 4 309
7 0.15 1200 4 1 307
8 0.15 1300 3 2 305
9 0.20 1000 3 4 307
10 0.20 1100 4 3 305
11 0.20 1200 1 2 311
12 0.20 1300 2 1 309
13 0.25 1000 4 2 309
14 0.25 1100 3 1 311
15 0.25 1200 2 4 305
16 0.25 1300 1 3 307
Table 3 L16 Orthogonal Array Nu As Responce
Case No A B C D E Nu
1 0.10 1000 1 1 305 43.65
2 0.10 1100 2 2 307 40.34
3 0.10 1200 3 3 309 198.89
4 0.10 1300 4 4 311 170.17
5 0.15 1000 2 3 311 115.09
6 0.15 1100 1 4 309 66.29
7 0.15 1200 4 1 307 506.87
8 0.15 1300 3 2 305 55.03
9 0.20 1000 3 4 307 160.26
10 0.20 1100 4 3 305 533.61
11 0.20 1200 1 2 311 102.20
12 0.20 1300 2 1 309 296.66
13 0.25 1000 4 2 309 373.50
14 0.25 1100 3 1 311 493.17
15 0.25 1200 2 4 305 133.93
[image:4.612.141.471.430.729.2]III.RESULT AND DISCUSSION
Taguchi method develop a technique which helps to predict the rank of factors, which are responsible for response effectiveness for product, so in present study Signal to Noise ratio test is performed to get rank of factors for both responses.
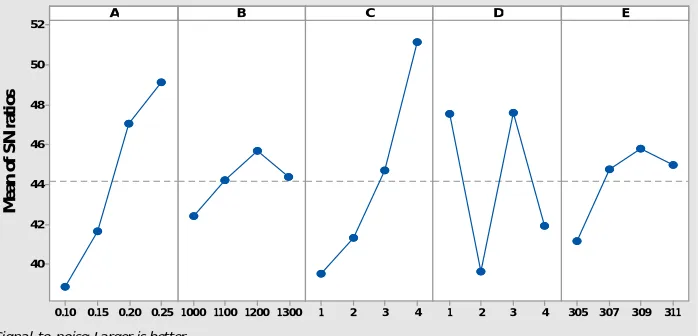
A. S/N ratio for Nu
Signal to ratio analysis is performed for temperature at outlet of heat ex-changer setup and present in Table 4. Mean ratio analysis is performed and presented in Table 5. As seen in Table 4, best ranked factor is inlet temperature of fluid, it means inlet temperature play important role for this case, second ranked factor is heat exchanger designs least factor is mass flow rate of fluid.
TABLE 4
RESPONSE TABLE FOR SIGNAL TO NOISE RATIOS LARGER IS BATTER
LEVEL A B C D E
1 38.88 42.39 39.52 47.55 41.17
2 41.64 44.24 41.33 39.64 44.75
3 47.07 45.70 44.69 47.60 45.82
4 49.13 44.39 51.18 41.92 44.97
DELTA 10.25 3.31 11.65 7.96 4.65
RANK 2 5 1 3 4
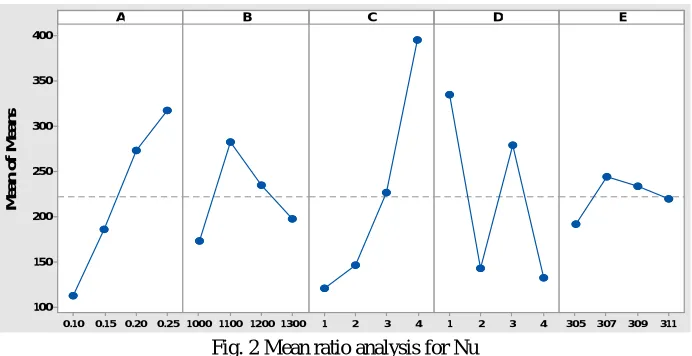
TABLE 5
RESPONSE TABLE FOR MEAN RATIO FOR Nu NUMBER
LEVEL A B C D E
1 113.3 173.1 120.9 335.1 191.6
2 185.8 283.4 146.5 142.8 244.8
3 273.2 235.4 226.8 279.8 233.8
4 318.0 198.4 396.0 132.7 220.2
DELTA 204.8 110.2 275.1 202.4 53.2
RANK 2 4 1 3 5
B. Rank Calculation for parameters
Taguchi analysis is also useful to predict best case from selected experimental cases. In present study one response named outlet temperature is selected and S/N ratio results are discussed in previous chapters. Figure 1 and 2 represent the Mean ratio and S/N ratio results for responses, Nusselt number (Nu) respectively.
0.25 0.20 0.15 0.10
52
50
48
46
44
42
40
1300 1200 1100
1000 1 2 3 4 1 2 3 4 305 307 309 311
A
M
e
a
n
o
f
S
N
r
a
ti
o
s
B C D E
Signal-to-noise: Larger is better
[image:5.612.134.483.536.704.2]0.25 0.20 0.15 0.10 400 350 300 250 200 150 100 1300 1200 1100
1000 1 2 3 4 1 2 3 4 305 307 309 311
A M e a n o f M e a n s
[image:6.612.134.480.75.253.2]B C D E
Fig. 2 Mean ratio analysis for Nu
C. Regression modelling for parameters outlet temperature and Nu number
Taguchi analysis is performed for this study and it tells us about factors importance based on response variables, but in present study regression equations are also developed for response Nu using linear regression modelling tool MINITAB software.
TABLE 6
ANOVA ANALYSIS FOR Nu RESPONSE
SOURCE DF Adj SS Adj MS F-Values P-Values
Regression 5 308022 61604 4.66 0.019
A 1 98475 98475 7.45 0.021
B 1 155 155 0.01 0.916
C 1 164045 164045 12.41 0.006
D 1 44225 44225 3.34 0.097
E 1 1122 1122 0.08 0.777
Error 10 132237 13224
[image:6.612.92.522.525.723.2]Total 15 440259
Table 6 and figure 3 represent the ANVOA results and residual figures for response Nusselt Number. As seen in Table 6, most of the factors are significant but one factor mass flow rate is not significant. Figure 3 present the residual plot for Nu response and it was seen from figure that residual error is not much high for this response.
200 100 0 -100 -200 99 90 50 10 1 Residual P e rc e n t 480 360 240 120 0 200 100 0 -100 -200 Fitted Value R e s id u a l 200 100 0 -100 -200 4.8 3.6 2.4 1.2 0.0 Residual F re q u e n cy 16 15 14 13 12 11 10 9 8 7 6 5 4 3 2 1 200 100 0 -100 -200 Observation Order R e si d u a l
Normal Probability Plot Versus Fits
IV.CONCLUSION
In present study special type of heat exchanger named corrugated type plate heat ex-changer is investigated using design of experiment (DOE) technique “Taguchi Method”. Total five factors are selected for this study having four levels, total sixteen experiments are carried out in present study and discussed in previous chapter in detail. Main conclusions of this research work are present in following section:
A. Taguchi method analysis present rank of factors for selective response (Nu) and present in Table 7 for responses for present
[image:7.612.227.421.206.256.2]study. Rank of factors are different for responses, which show the differences among responses due to their working methodologies or formulas capability.
TABLE 7 FACTOR RANK BASED S/N RATIO
A B C D E
Nu 2 5 1 3 4
B. Taguchi analysis also present the best case among all experiments carried out for this research study and results are present in
Table 8 for response. It was clear that the best-case parameter shows equal-ness for response, which indicate that response have same conditions for best case among all L16 experiments.
TABLE 8 BEST CASE (ON THE BASIS OF S/N RATIO)
A B C D E
Nu 0.25 1200 4 1 or
3 309
C. Linear regression modeling is also performed for response and the generated model equation is present in this section with
model summary parameters. These model equations are useful for future application of this type of devices. Model summary represents the values of different statically parameters.
Nu = -1317 + 1403 A + 0.028 B + 90.6 C - 47.0 D + 3.7 E
Model Summary
S R-sq R-sq(adj) R-sq(pred)
114.994 69.96% 54.95% 28.24%
REFERENCES
[1] X. H. Han, L. Q. Cui, S. J. Chen, G. M. Chen, and Q. Wang, “A numerical and experimental study of chevron, corrugated-plate heat exchangers,” Int. Commun. Heat Mass Transf., vol. 37, no. 8, pp. 1008–1014, 2010.
[2] H. Sammeta, K. Ponnusamy, M. A. Majid, and K. Dheenathayalan, “Effectiveness charts for counter flow corrugated plate heat exchanger,” Simul. Model. Pract. Theory, vol. 19, no. 2, pp. 777–784, 2011.
[3] E. Wang, K. Li, J. Mao, N. Husnain, D. Li, and W. Wu, “Experimental study of flow and heat transfer in rotary air preheaters with honeycomb ceramics and metal corrugated plates,” Appl. Therm. Eng., 2017.
[4] H. Sadighi Dizaji, S. Jafarmadar, and S. Asaadi, “Experimental exergy analysis for shell and tube heat exchanger made of corrugated shell and corrugated tube,” Exp. Therm. Fluid Sci., vol. 81, pp. 475–481, 2017.
[5] M. Goodarzi et al., “Investigation of heat transfer and pressure drop of a counter flow corrugated plate heat exchanger using MWCNT based nanofluids,” Int. Commun. Heat Mass Transf., vol. 66, pp. 172–179, 2015.
[6] H. Lee, Y. Hwang, R. Radermacher, and H. H. Chun, “Thermal and hydraulic performance of sinusoidal corrugated plate heat exchanger for low temperature lift heat pump,” Int. J. Refrig., vol. 36, no. 3, pp. 689–700, 2013.
[7] V. Dvořák and T. Vít, “Evaluation of CAE Methods Used for Plate Heat Exchanger Design,” Energy Procedia, vol. 111, no. September 2016, pp. 141–150, 2017.
[8] S. Jin and P. Hrnjak, “Effect of end plates on heat transfer of plate heat exchanger,” Int. J. Heat Mass Transf., vol. 108, pp. 740–748, 2017.
[9] M. Faizal and M. R. Ahmed, “Experimental studies on a corrugated plate heat exchanger for small temperature difference applications,” Exp. Therm. Fluid Sci., vol. 36, pp. 242–248, 2012.
[image:7.612.37.579.499.721.2]