R E S E A R C H
Open Access
Discovery of novel transcripts and gametophytic
functions via RNA-seq analysis of maize
gametophytic transcriptomes
Antony M Chettoor
1, Scott A Givan
2, Rex A Cole
3, Clayton T Coker
1, Erica Unger-Wallace
4, Zuzana Vejlupkova
3,
Erik Vollbrecht
4, John E Fowler
3and Matthew MS Evans
1*Abstract
Background:Plant gametophytes play central roles in sexual reproduction. A hallmark of the plant life cycle is that gene expression is required in the haploid gametophytes. Consequently, many mutant phenotypes are expressed in this phase.
Results:We perform a quantitative RNA-seq analysis of embryo sacs, comparator ovules with the embryo sacs removed, mature pollen, and seedlings to assist the identification of gametophyte functions in maize. Expression levels were determined for annotated genes in both gametophytes, and novel transcripts were identified from de novoassembly of RNA-seq reads. Transposon-related transcripts are present in high levels in both gametophytes, suggesting a connection between gamete production and transposon expression in maize not previously identified in any female gametophytes. Two classes of small signaling proteins and several transcription factor gene families are enriched in gametophyte transcriptomes. Expression patterns of maize genes with duplicates in subgenome 1 and subgenome 2 indicate that pollen-expressed genes in subgenome 2 are retained at a higher rate than subgenome 2 genes with other expression patterns. Analysis of available insertion mutant collections shows a statistically significant deficit in insertions in gametophyte-expressed genes.
Conclusions:This analysis, the first RNA-seq study to compare both gametophytes in a monocot, identifies maize gametophyte functions, gametophyte expression of transposon-related sequences, and unannotated, novel transcripts. Reduced recovery of mutations in gametophyte-expressed genes is supporting evidence for their function in the gametophytes. Expression patterns of extant, duplicated maize genes reveals that selective pressures based on male gametophytic function have likely had a disproportionate effect on plant genomes.
Background
The plant life cycle has genetically active diploid and haploid phases, called the sporophyte and gametophyte, respectively [1]. In angiosperms the gametophytes are highly reduced, are dependent on the parent sporophyte, and develop embedded within the diploid sporophyte tissues, with a three-celled male gametophyte and a fe-male gametophyte consisting of as few as seven cells.
To produce the female gametophyte, or embryo sac, after meiosis, one spore undergoes three rounds of synchronous divisions to produce an eight-nucleate syncytium with
micropylar and chalazal clusters of four nuclei each [2]. Cellularization then produces seven cells: two synergids, the egg cell, the bi-nucleate central cell, and three anti-podal cells [3]. In maize, the antianti-podal cells continue to divide during embryo sac maturation, reaching a final number of 20 to 100 cells. The male gametophyte, or pollen grain, has an even more reduced phase of growth. Each microspore first undergoes an asymmetric cell div-ision to produce the vegetative cell and the generative cell. The generative cell then divides once to produce the two sperm cells, which are carried within the vegetative cell. In addition to expressing functions required for pollen grain development, the vegetative cell must also generate the tip-growing pollen tube that navigates through the pistil
* Correspondence:[email protected] 1
Department of Plant Biology, Carnegie Institution for Science, Stanford, CA 94305, USA
Full list of author information is available at the end of the article
tissues to reach the embryo sac and deliver the sperm cells [4].
Mutations in genes required in the gametophytes re-sult in characteristic fertility phenotypes and modes of transmission that have formed the basis of many mutant screens [5-9]. When heterozygous, mutations affecting the embryo sac are expected to have reduced fertility and seed set, because half of the ovules contain mutant embryo sacs and so often fail to produce seed. Mutations affecting the male gametophyte do not cause reduced seed set, because both wild-type and mutant pollen from heterozygotes enter the pistil. However, for mutations af-fecting male and/or female gametophytes, the mutant al-lele (and the alal-leles of loci linked to it) is found at a reduced frequency in progeny when the defective gamete is involved (that is, male gametophyte mutants are recov-ered poorly when heterozygotes are crossed as males). This characteristic reduced transmission also prevents, or makes very difficult, the generation of mutant homozy-gotes. Note that genetic redundancy can facilitate the re-covery of mutations in genes active in the gametophytes but also can complicate recognizing them as such, given generally weaker phenotypes. Maize, as an ancient allote-traploid constituted by two progenitor genomes (subge-nomes 1 and 2), has a mix of genes present as either duplicated pairs (homeologs), or as singletons, due to gene loss [10]. Notably, subgenome 2 is characterized by lower levels of gene expression and higher rates of gene loss than subgenome 1 [11].
Because of the poor recovery of gametophyte-lethal mutants, additional strategies (for example, transcrip-tome profiling) have been utilized to identify gameto-phyte active genes in several species. Microarrays were used first to assess the transcriptomes of pollen [12-15] and embryo sacs (by comparing ovules with and without embryo sacs) [16-21] inArabidopsis. These studies iden-tified up to approximately 14,000 genes as expressed at some point in pollen development [13], with approxi-mately 6,500 to 7,200 expressed at the mature pollen stage [13,15] and 1,200 embryo sac-expressed genes. The identification of more expressed genes in pollen is likely due to the ease of isolating large populations of relatively pure material. Sperm cell purification and assessment of growing pollen tubes have extended these studies to pro-vide additional details of male gametophytic transcrip-tomes [22-25].
Enrichment of embryo sac cells (for example, by cell wall digestion and dissection [26] or laser capture micro-dissection [27]) facilitated the identification of additional genes expressed in the embryo sac. Isolation of gameto-phyte cells for expressed sequence tag sequencing or micro-array hybridization in maize, rice, and wheat [26,28-31] identified greater complexity for the egg transcriptome than that of sperm, and a preponderance of unknown,
hypothetical, and novel proteins encoded by these tran-scripts. Three of the cell types in the matureArabidopsis embryo sac (the egg cell, the central cell and the synergids; but not the antipodals) were analyzed by microarray, with 8,850/20,777 of the genes on the ATH1 chip identified as expressed [27], a number comparable to mature pollen. RNA-seq analysis removes some of the limitations associ-ated with sequencing individual cDNA clones or micro-array technology (for example, not all of the genes are present on the microarray), revealing both the expression of a higher fraction of known transcripts in the gameto-phytes and the existence of new genes and transcript iso-forms in mature pollen and the central cell of the female gametophyte [32-34]. RNA-seq has also identified gene families enriched in the central cell that were missed in microarray studies [35].
These studies have revealed a few broad themes. The pollen transcriptome is the most distinctive, although all gametophytic transcriptomes have some similar features to one another. Of sporophytic transcriptomes, the early embryo (heart and globular stages) is most similar to the gametophytes [15,24,27]. Some parallels for plant egg and sperm cell transcriptomes with animal gamete tran-scriptomes have also been detected, particularly with regards to the epigenetic regulation of gene function through small RNA pathways [27]. Within the embryo sac, the egg and central cell transcriptome are more similar to one another than to the synergids. Small sig-naling peptides of the DEFENSIN/LURE (DEFL) family are overrepresented in the female gametophyte (particu-larly the central cell), although only a subset of these was assayed in the whole embryo sac. Pollen grain tran-scriptomes are enriched for Gene Ontology (GO) terms related to signaling, vesicle trafficking, cell wall func-tions, and cytoskeletal functions thought to be important for tip growth [15,25]. Finally, putative connections be-tween epigenetic regulation, small RNA pathways, and re-activation and silencing of transposable elements (TEs) have been observed in gametophyte transcriptomes [23,27,36]. Preliminary RNA-seq analysis is available for maize mature pollen [37], which, as is the case inArabidopsis, is very dif-ferent from sporophytic tissues. Use ofde novotranscript as-sembly of RNA-seq reads in maize has also been used to study long non-coding RNAs in reproductive and vegetative tissues [38]. Reproductive tissues, including male and fe-male gametophytes, express more long noncoding RNA (lncRNA) loci than vegetative tissues.
peptides and several transcription factor (TF) gene fam-ilies as being overrepresented in gametophyte tran-scriptomes. The first genome-wide comparison of gene expression patterns on duplicate gene retention also reveals an effect of pollen gene function on genome evolution. This study also provides the first evidence for transposon expression in the male and female ga-metophytes of a plant with a large, complex genome containing many active transposon classes.
Results
Production of RNA-seq and mapping of reads to the B73 reference genome
To define the transcriptomes of mature maize male and female gametophytes, RNA-seq was performed on four tissue types: nine-day old, above-ground seedling (S); mature pollen (MP); embryo-sac-enriched samples with some remaining nucellar cells (ES); and ovules with em-bryo sacs removed (Ov). We generated between approxi-mately 54 million to approxiapproxi-mately 195 million mappable Illumina reads per B73 sample. The ES samples, which had the lowest amount of starting material and required additional amplification before sequencing, had the lowest percentage of reads that could be mapped back to the ref-erence genome, ranging from 54% to 62% of the total reads per replicate. Before mapping reads to the maize genome, reads were compared to the available maize
repeat database to remove reads with a high confidence match to maize repetitive elements [39]. Remaining reads were mapped to the maize genome sequence in two ways: (1) to the existing gene models to determine expression levels for annotated genes; and (2) to the reference gen-ome sequence independently of gene models to build em-pirical transcripts to aid the identification of novel genes. There are three gene sets for the maize B73 RefGen_v2: the filtered gene set (FGS), composed of high-confidence gene models; the rejected gene set (RGS), composed of lower-confidence gene models that include likely pseudo-genes and transposons; and the working gene set (WGS), which encompasses both FGS and RGS. To ensure that unknown gametophytic transcripts were not missed in this analysis, B73 RNA-seq reads were mapped to both the WGS (Additional file 1) and FGS (Additional file 2) gene models (summarized in Table 1).
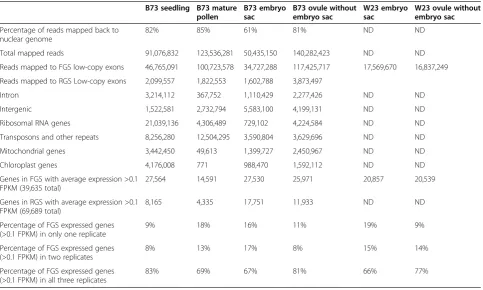
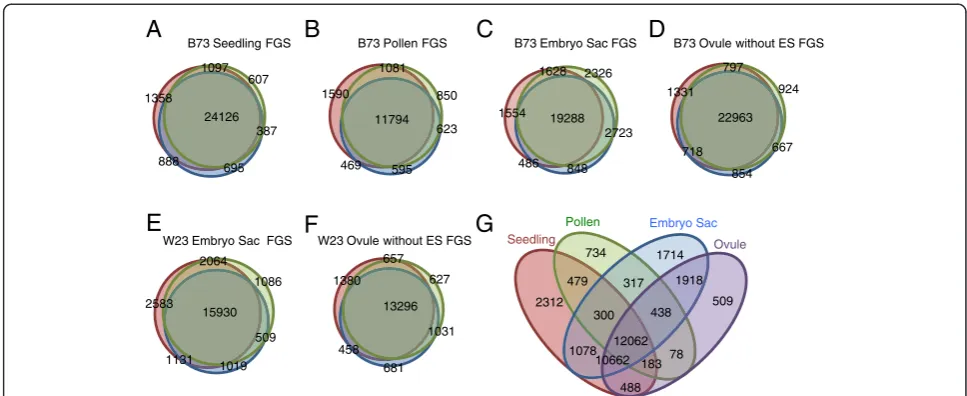
[image:3.595.57.541.437.727.2]The variability of samples can be seen in the percentages of gene models expressed above an arbitrary threshold (0.1 fragments per kilobase per million reads (FPKM)) that are shared between replicates (Table 1 and Figure 1). ES was the most variable. The percentage of genes shared across all three ES samples is lower than in the other tis-sues (67% versus 69 to 83%). Because of the variability of the ES samples, an additional set of ES and comparator Ov samples were analyzed to improve identification of genes enriched in the embryo sac. RNA-seq was performed
Table 1 RNA-seq reads mapped backed to the maize genome (5a.59)
B73 seedling B73 mature pollen
B73 embryo sac
B73 ovule without embryo sac
W23 embryo sac
W23 ovule without embryo sac
Percentage of reads mapped back to nuclear genome
82% 85% 61% 81% ND ND
Total mapped reads 91,076,832 123,536,281 50,435,150 140,282,423 ND ND
Reads mapped to FGS low-copy exons 46,765,091 100,723,578 34,727,288 117,425,717 17,569,670 16,837,249
Reads mapped to RGS Low-copy exons 2,099,557 1,822,553 1,602,788 3,873,497
Intron 3,214,112 367,752 1,110,429 2,277,426 ND ND
Intergenic 1,522,581 2,732,794 5,583,100 4,199,131 ND ND
Ribosomal RNA genes 21,039,136 4,306,489 729,102 4,224,584 ND ND
Transposons and other repeats 8,256,280 12,504,295 3,590,804 3,629,696 ND ND
Mitochondrial genes 3,442,450 49,613 1,399,727 2,450,967 ND ND
Chloroplast genes 4,176,008 771 988,470 1,592,112 ND ND
Genes in FGS with average expression >0.1 FPKM (39,635 total)
27,564 14,591 27,530 25,971 20,857 20,539
Genes in RGS with average expression >0.1 FPKM (69,689 total)
8,165 4,335 17,751 11,933 ND ND
Percentage of FGS expressed genes (>0.1 FPKM) in only one replicate
9% 18% 16% 11% 19% 9%
Percentage of FGS expressed genes (>0.1 FPKM) in two replicates
8% 13% 17% 8% 15% 14%
Percentage of FGS expressed genes (>0.1 FPKM) in all three replicates
83% 69% 67% 81% 66% 77%
on a set of samples from a different inbred line, W23, using the ABI SOLiD platform. These reads were mapped against the FGS genes, and FPKM values calculated for each gene (Additional file 2). The W23 ES samples had similar vari-ability between replicates as the B73 ES (66% of genes above 0.1 FPKM are shared in all three). For those FGS genes with an average signal above threshold in the W23 samples, there was a strong concordance with the same characteristic in B73 (94% for ES, 93% for Ov), arguing that the samples from the two inbred lines are indeed compar-able. All subsequent analysis of FGS gene expression values used a modified average of the W23 and B73 ES and Ov samples derived as described in the Materials and methods.
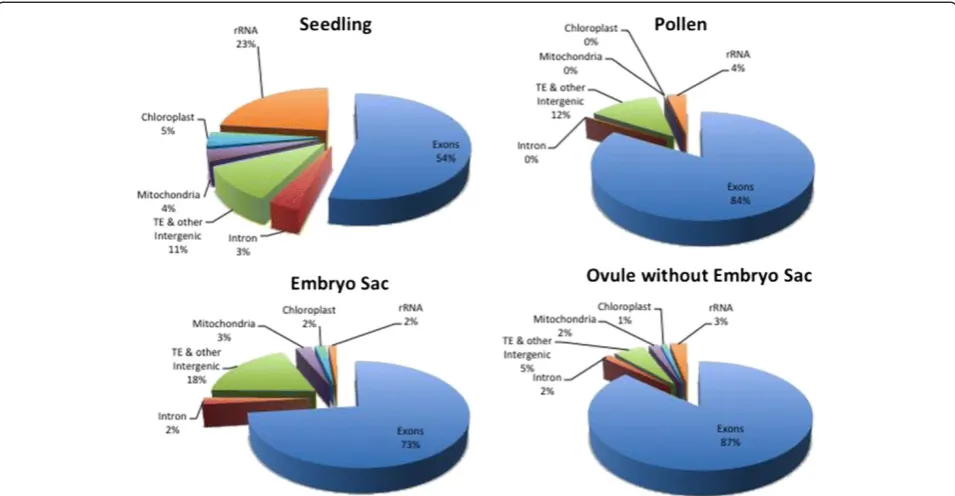
Several trends involving genomic regions were revealed when reads were mapped to the whole genome (Table 1 and Figure 2). For example, the reads mapping to riboso-mal sequences and the chloroplast genome were highest in seedling, whereas MP was nearly devoid of reads from both the mitochondrial and chloroplast genomes. Reads classified as intronic were also notably less frequent in MP (0.3%) than in the other tissues tested (2% to 3%). This is in contrast to Arabidopsis pollen, which has a high fre-quency of intron reads [33]. One possible explanation for the low representation of introns in MP is that, in contrast to the other sample types, mature pollen is in a somewhat quiescent state prior to contact with female tissue. Thus, this observation is consistent with the view that the vast majority of mRNAs in MP are fully mature (that is, com-pletely spliced), and stored for rapid translation upon pollen tube germination [40].
Non-exonic reads (intron, TE and other intergenic) were overrepresented in ES samples relative to the other transcriptomes (approximately 50% more frequent than in seedling and MP and three-fold more frequent than in surrounding Ov), raising the possibility that ES-specific genes have been systematically missed in the current WGS and FGS predictions. To identify genes ab-sent from the current WGS and FGS predictions, all reads were used to build empirical transcript models. The resulting dataset contains 31,015 models longer than 100 bp that are completely intergenic relative to the existing WGS gene models and are detected above 0.1 FPKM (Additional file 3). However, 27,685 of these intergenic models (89.3% of the total) were classified as TE-related or other repeat-related via BLAST, using pre-viously validated parameters [41], or via RepeatMasker (see Materials and methods) (Table S3C in Additional file 3). A small number of these repeat-related tran-scripts (1,174; 4.2%) overlap with lncRNA loci [38]; a lar-ger percentage of the non-repeat-related intergenic gene models (648 out of 3,330; 19.5%) show lncRNA locus overlap (Table S3A in Additional file 3).
Thus, most of the 3,330 non-repeat-related intergenic transcript models (Table S3B in Additional file 3) repre-sent potential novel protein-coding genes. Although many of these models are small (100 to 200 bp, possibly incom-plete transcripts), the overall average is 546 bp, with lengths extending up to 3.4 kb. The largest category of these did not show enriched expression in any one tissue (Table 2). However, both embryo sac and pollen samples were associated with significantly higher counts of
tissue-24126 1097
607 1358
387
695 888
B73 Embryo Sac FGS B73 Ovule without ES FGS B73 Seedling FGS B73 Pollen FGS
W23 Embryo Sac FGS W23 Ovule without ES FGS
A
B
C
D
E
F
G
11794 1081
850 1590
623
595 469
19288 2723
848 2326
486 1554
1628
22963 797
924 1331
667
854 718
15930 2064
1086 2583
509
1019 1131
13296 657
627 1380
1031
681
458 12062
2312
1078 479 317
300 734
438 1918
509
78 183 10662
488 1714 Embryo Sac
Pollen
[image:4.595.55.539.88.286.2]Seedling Ovule
Figure 1Similarity between replicates.The lists of genes with expression above 0.1 FPKM for each sample was compared between biological replicates. Overlaps between replicates within each tissue type are shown. The number of genes with an expression of at least 0.1 FPKM within each set or overlap between sets is indicated. The samples with the least overlap are the B73 embryo sacs.(A)B73 seedlings;(B)B73 mature pollen;(C)B73 embryo sac enriched;(D)B73 ovules without embryo sacs;(E)W23 embryo sac enriched;(F)W23 ovules without embryo sacs.
enriched (that is, two-fold higher than any other sample) intergenic transcript models than either sporophytic sample assessed. Non-enriched, ES-enriched, and MP-enriched transcript models show a similar likelihood to encode proteins, based on BLAST and InterProScan as-sessment (ES, 25.9%; MP, 24.2%; non-enriched, 29.8%; Table S3A in Additional file 3).
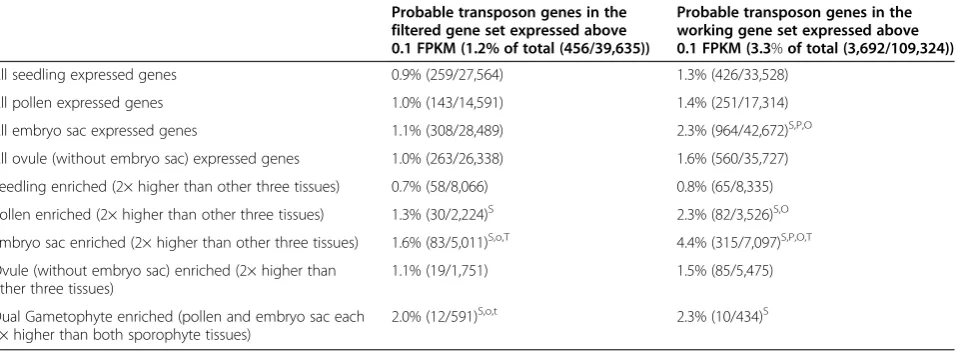
Transcripts from TE-related sequences were detected at a higher level in gametophytes than in sporophytic tis-sues (Table 2), consistent with results in Arabidopsis [36]. This is despite filtering out a large number of repeat-matching reads prior to transcript assembly. To further assess this trend, gene models in both the FGS and the WGS annotated as 'probable transposon' were
evaluated for expression in different tissues. Analysis of RNA-seq reads mapped to these gene models revealed that the gametophytes (particularly the embryo sac) are significantly more likely than the sporophytic tissues to express one of these (Table 3). A similar bias is found when focusing on gene models enriched in one tissue (de-fined as a two-fold signal increase over the other three tis-sues), with the set of ES-enriched genes overrepresented for 'probable transposon' genes compared with the two sporophyte samples and the total gene set.
Validation of RNA-seq by quantitative RT-PCR
[image:5.595.59.537.89.337.2]To verify the differential expression detected by the Illu-mina RNA-seq data, quantitative RT-PCR (qRT-PCR)
Table 2 Novel gene models identified by transcript assembly from RNA-seq data
Non-TE/repeat-related gene models
Average length (bp)
TE/repeat-related gene models
Average length (bp)
Seedling enriched (2× higher than other three tissues) 26 515 74 816
Pollen enriched (2× higher than other three tissues) 376 679 1,133 836
Embryo sac enriched (2× higher than other three tissues) 622 484 4,395 881
Ovule (without embryo sac) enriched (2× higher than other three tissues)
37 643 67 1,486
Not specific to any one tissue 2,269 540 22,016 939
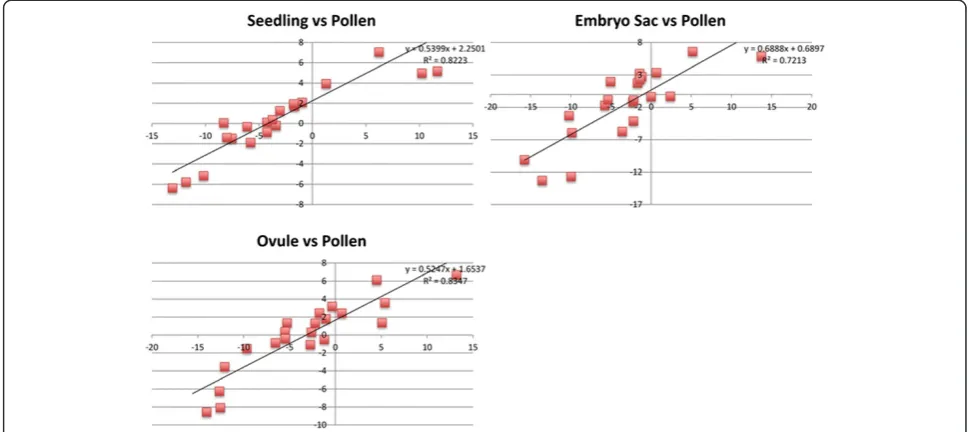
[image:5.595.57.541.631.733.2]was performed on a new set of three replicates for all four tissue types. A set of 46 genes was chosen ran-domly, based on the availability of Ds insertion alleles (see below). These genes had a range of average expression levels for each tissue: 0.16 to 537 FPKM for seedling; 0 to 6,635 FPKM for MP; 0.03 to 815 FPKM for Ov; and 0 to 417 FPKM for ES samples. One concern of the RNA-seq analysis was that amplification of cDNA of the ES and Ov samples prior to Illumina library construction may have in-troduced biases in composition of the library. To test the potential for biases, cDNA was prepared for all four tissues using similar quantities of RNA as was used in the original ES and Ov samples. The cDNA from these samples was then amplified prior to qRT-PCR. The qRT-PCR analysis from these samples was then compared with the RNA-seq expression data for all four tissue types. To corroborate the expression levels measured by RNA-seq, the ratio of ex-pression levels between tissues using RNA-seq was compared with the ratio of expression as measured by qRT-PCR. For all genes, expression of genes in seed-ling, Ov, and ES were measured relative to their ex-pression in MP, since MP is the least complex tissue of the four samples on a cellular level. As can be seen from the R2values (0.83, 0.82 and 0.72), the ratios of gene expression measured between tissues by RNA-seq and by qRT-PCR are highly correlated (Figure 3). The lowest correlation was seen with the ES samples, which had the least amount of starting material for RNA-seq, suggesting that there is some loss of fidelity with amplification from small amounts of starting RNA. However, these validation experiments support
the reliability of the relative values provided by the RNA-seq analysis.
Comparison of gametophytic and sporophytic gene expression programs
[image:6.595.61.540.112.288.2]Comparison of the lists of FGS gene models above an average expression threshold of 0.1 FPKM in each sam-ple type (Additional file 4) revealed a number of features (Figure 1G). The largest set, 12,062 genes, shows expres-sion above the threshold in all four tissue types. Seedling had the highest percentage of genes in its transcriptome above 0.1 FPKM that are not shared with any of the other samples at 8.4%, compared with ES samples at 6.0%, MP at 5.0%, and Ov with the lowest frequency of unique genes at 1.9%. The lower numbers of unique genes for Ov are not surprising given that the ES sam-ples also contain small amounts of contaminant nucellus cells. Corroborating earlier studies on maize pollen mRNA diversity [42], and similar to Arabidopsis [33], the MP transcriptome is the least complex of the four with half as many of the FGS genes expressed above a threshold of 0.1 FPKM as the other tissues (Table 2). This is consistent with the view that MP is highly specialized compared with the other three tissue types, as 10,662 genes shared by the other three tissue types are not detected in MP (Figure 1G). Thus, a picture emerges of a relatively large core of genes expressed across all four develop-mental stages, with functional specialization potentially due to the combination of differences in expression level for this core set, plus developmentally specific ex-pression of a smaller set of genes.
Table 3 Percentage of genes annotated as probable transposon genes expressed in gametophyte and sporophyte samples
Probable transposon genes in the filtered gene set expressed above 0.1 FPKM (1.2% of total (456/39,635))
Probable transposon genes in the working gene set expressed above 0.1 FPKM (3.3%of total (3,692/109,324))
All seedling expressed genes 0.9% (259/27,564) 1.3% (426/33,528)
All pollen expressed genes 1.0% (143/14,591) 1.4% (251/17,314)
All embryo sac expressed genes 1.1% (308/28,489) 2.3% (964/42,672)S,P,O
All ovule (without embryo sac) expressed genes 1.0% (263/26,338) 1.6% (560/35,727)
Seedling enriched (2× higher than other three tissues) 0.7% (58/8,066) 0.8% (65/8,335)
Pollen enriched (2× higher than other three tissues) 1.3% (30/2,224)S 2.3% (82/3,526)S,O
Embryo sac enriched (2× higher than other three tissues) 1.6% (83/5,011)S,o,T 4.4% (315/7,097)S,P,O,T
Ovule (without embryo sac) enriched (2× higher than other three tissues)
1.1% (19/1,751) 1.5% (85/5,475)
Dual Gametophyte enriched (pollen and embryo sac each 2× higher than both sporophyte tissues)
2.0% (12/591)S,o,t 2.3% (10/434)S
S
Higher than equivalent seedling frequency atP≤0.01.
P
Higher than equivalent pollen frequency atP≤0.01.
O
Higher than equivalent ovule frequency atP≤0.01.
o
Higher than equivalent ovule frequency atP≤0.05.
T
Higher than total in gene set atP≤0.01.
t
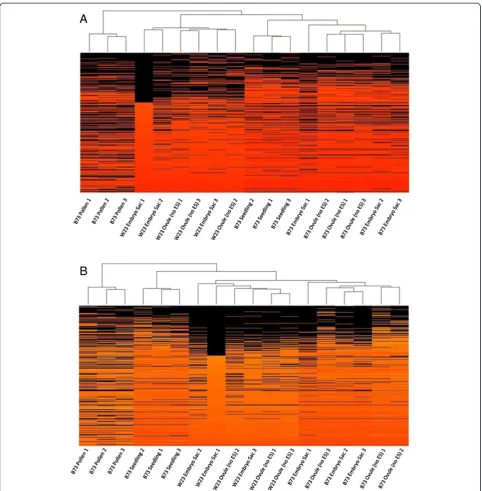
To determine the similarity of the transcriptomes of different tissues to one another, including between dif-ferent inbred lines (B73 and W23), hierarchical clustering was used to compare the 18 replicates across 6 tissues and/or genotypes (Figure 4). The first analysis used all FGS genes, only excluding genes that were below thresh-old in all samples (Figure 4A). Due to the possibility that polymorphisms between W23 and B73 could lead to in-accurate measurement of expression of some W23 genes, a second comparison was also made. This second analysis (Figure 4B) excluded the approximately 6,000 genes for which no reads were detected in any of the six W23 (ES and Ov) samples. As in Arabidopsis [14], these analyses supported the view that the MP transcriptome is the most distinct, clustering away from the other samples regardless of which gene set was used.
Relationship between gene expression pattern and duplicate gene retention
The maize genome consists of two subgenomes as a con-sequence of an ancient allotetraploidy event, and thus genes in the modern genome can be classified as either singletons (if the corresponding homeolog has been lost since tetraploidization), or duplicates (if both genes have been retained) [11]. Subgenome 2 is characterized by higher gene loss and lower gene expression of retained genes than subgenome 1. To determine if expression in the gametophytes is distributed differently in the two sub-genomes, two sets of gene lists were developed for each
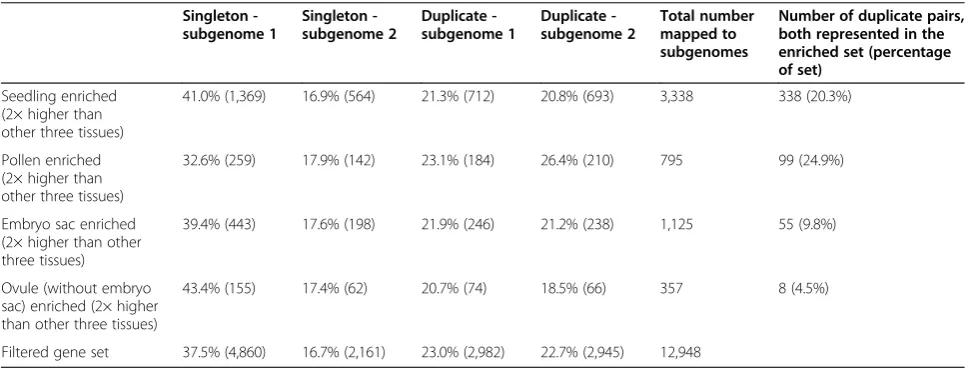
[image:7.595.55.540.90.306.2]sample type from B73. The first set (the total transcrip-tomes) included all FGS gene models above a threshold of 0.1 FPKM in that sample type; the second set (the tissue-enriched transcriptomes) included only those gene models from the total transcriptomes that were at least two-fold higher in a sample type relative to all three other sample types (see Materials and methods). These gene model lists were then mapped to high-confidence subgenome 1 and 2 sets [11] (Table 4). As expected, in all four tissues the per-centage of genes expressed above the threshold is higher for subgenome 1 than subgenome 2. However, for both the total MP transcriptome and the MP-enriched gene list, the percentage of genes in subgenome 2 is significantly higher than it is for the total gene list, or for the other tissue-focused gene lists. None of the other tissue tran-scriptomes show overrepresentation of subgenome 2 com-pared with the whole genome. A breakdown of how the tissue-enriched genes are distributed in the subgenomes (as either singletons or part of a retained duplicate pair) reveals the basis for this difference (Table 5; Additional file 5). Relative to the other expression categories, and to the en-tire FGS set, MP-enriched genes are more likely to be du-plicates, retained in both subgenomes. Furthermore, the MP-enriched set has a significantly lower distribution of subgenome 1 singletons, supporting the idea that this set of genes is less likely to have lost subgenome 2 homeologs. Finally, when focusing on the retained duplicate pairs in the four tissue-enriched gene sets, the MP set has a significantly greater proportion of pairs in which both Figure 3Verification of RNA-seq with qRT-PCR.The log2(expression relative to actin and ubiquitin genes in test tissue by qRT-PCR/expression
relative to actin and ubiquitin genes in pollen by qRT-PCR) is plotted on the y-axis and the log2(expression in test tissue by RNA-seq(FPKM)/expression
in pollen by RNA-seq(FPKM)). Although the slopes of the lines are not equal to one, the R2values show good correlation between measurements using
members are represented; in fact, one-quarter of the gene models in the MP-enriched set that could be assessed via subgenome mapping are a member of an expressed pair. These data are consistent with the idea that pollen places some exceptional requirement on gene function, such that selection pressure results in
retention and expression in pollen of a higher propor-tion of both genes of a duplicate pair.
Gene Ontology functional category enrichment
[image:8.595.57.540.87.579.2]Functional enrichment of GO terms was performed for lists of genes with particular expression patterns using Figure 4Hierarchical clustering of replicates based on expression profiles using the R statistical package.Genes are organized vertically based on expression in W23 ES sample 1.(A)Clustering based on FGS gene expression FPKM except for genes with 0 FPKM in all 18 samples.(B)
the online Agrigo GO Analysis Toolkit [43] using the modified average expression values of the FGS genes. GO term overrepresentation was performed for the full transcriptome above 0.1 FPKM for each tissue, and for the tissue-enriched gene lists (Additional file 6; see Materials and methods for description).
Comparison of the GO terms overrepresented in the full transcriptome of each of the four tissue samples revealed that the MP samples had the most GO terms (114) that were not shared with the other samples (Additional files 7 and 8). The largest number of overrepresented GO terms
were in the ES and Ov samples, but many of these were shared, with GO terms unique to the ES in large part re-lated to the DEFENSIN/LURE (DEFL) family (see below). By far the largest group of GO categories overrepresented in each of the four full transcriptome gene lists was shared by all four samples (212 GO terms), followed by the num-ber shared by ES, Ov, and seedling (90 GO terms). Thus, the overall analysis suggests that the distinctiveness of the pollen transcriptome is extended to the functional level.
Second, analysis of overrepresented GO terms was performed for tissue-enriched gene lists to identify po-tential tissue-specific functions (Additional file 9). A dual gametophyte-enriched gene set (enriched in both MP and ES, relative to both Ov and seedling) was also iden-tified. The Ov sample had the fewest overrepresented GO terms of all four tissue-enriched gene lists, with apoptosis-related terms being significantly increased (Table S8D in Additional file 9). In seedling genes, GO categories related to photosynthetic functions and environmental re-sponses were overrepresented (Table S7A in Additional file 6 and Table S8A in Additional file 9).
[image:9.595.56.293.113.308.2]For the MP-enriched genes, the most significantly overrepresented GO categories include functions related to the actin cytoskeleton, and GO terms potentially re-lated to pollen tube growth and penetration of the pistil (for example, the cell wall-loosening expansins; pectines-terases and glycosidases; Table S8B in Additional file 9). Additionally, there is significant overrepresentation of post-translational protein modification, driven in large part by an abundance of protein kinases. A few members of the DEFL family are also specifically overrepresented in the MP transcriptome. MP-enriched genes in subge-nome 2 (Tables 4 and 5), were also examined for over-represented GO terms (Additional file 10). In this subset
Table 4 Expression of subgenome 1 and subgenome 2 assigned genes in gametophyte and sporophyte samples
Subgenome 2 to subgenome 1 ratio (63.1% for all subgenome2/all subgenome1 (7,118/11,282))
All seedling expressed genes 62.6% (6,047/9,657)
All pollen expressed genes 67.5% (3,421/5,066)s,e,o,t
All embryo sac expressed genes 63.3% (5,820/9,195)
All ovule (without embryo sac) expressed genes
63.6% (5,541/8,716)
Seedling enriched (2× higher than other three tissues)
57.3% (1,749/3,054)
Pollen enriched (2× higher than other three tissues)
73.0% (465/637)s,t
Embryo sac enriched (2× higher than other three tissues)
63.4% (645/1,017)
Ovule (without embryo sac) enriched (2× higher than other three tissues)
62.7% (207/330)
s
Higher than equivalent seedling frequency atP≤0.01.
e
Higher than equivalent embryo sac frequency atP≤0.05.
o
Higher than equivalent ovule frequency atP≤0.05.
t
Higher than total gene set atP≤0.05.
Table 5 Tissue-enriched gene models mapped to singletons and duplicates in the maize subgenomes
Singleton -subgenome 1
Singleton -subgenome 2
Duplicate -subgenome 1
Duplicate -subgenome 2
Total number mapped to subgenomes
Number of duplicate pairs, both represented in the enriched set (percentage of set)
Seedling enriched (2× higher than other three tissues)
41.0% (1,369) 16.9% (564) 21.3% (712) 20.8% (693) 3,338 338 (20.3%)
Pollen enriched (2× higher than other three tissues)
32.6% (259) 17.9% (142) 23.1% (184) 26.4% (210) 795 99 (24.9%)
Embryo sac enriched (2× higher than other three tissues)
39.4% (443) 17.6% (198) 21.9% (246) 21.2% (238) 1,125 55 (9.8%)
Ovule (without embryo sac) enriched (2× higher than other three tissues)
43.4% (155) 17.4% (62) 20.7% (74) 18.5% (66) 357 8 (4.5%)
Filtered gene set 37.5% (4,860) 16.7% (2,161) 23.0% (2,982) 22.7% (2,945) 12,948
[image:9.595.56.539.524.708.2]of subgenome 2 genes, functions related to localization and transmembrane transport, as well as pectinesterase activity, were the most significantly overrepresented GO terms.
For the ES, biological processes and molecular func-tions related to transcriptional regulation were the most highly overrepresented (Table S8C in Additional file 9). Interestingly, as in the MP transcriptome, expansin gene expression is significantly overrepresented in the ES tran-scriptome, although a different set of expansins from those found in MP. These genes may facilitate the rapid expansion of the embryo sac within the surrounding nu-cellus. The other most significant GO terms in the ES-enriched genes include nucleotide metabolic processes. Enrichment of this category is entirely driven by the high number of ES-enriched members of the DEFENSIN/ LURE (DEFL) family, as these small proteins contain a knottin fold with a dinucleoside diphosphate kinase core. The shared gametophyte-enriched gene set shows similar GO category overrepresentation, again driven by DEFL proteins. Thus, in total, three different sets of DEFL genes were found, each overrepresented among the transcripts showing that expression character: ES-enriched; MP-enriched; and dual gametophyte-enriched. Some members of this family have previously been shown to be expressed in synergids in maize and to function as pollen tube at-tractants inTorenia[28,44-47].
Analysis of transcription factor gene families
Because transcriptional regulation GO terms were sig-nificantly overrepresented in the ES-enriched gene list, all known TFs in maize from the Grass Transcription Factor Database [48,49] were assayed for tissue-enriched expression in the gametophyte and sporophyte tissues (Additional file 11). Using this more comprehensive TF list, significant overrepresentation for the aggregate of all TF families was detected in the embryo sac. Five separ-ate TF gene families showed significant overrepresenta-tion (P< 0.05) in the ES-enriched gene list (in order of significance, AP2-EREB, WRKY, MYB-RELATED, NAC, and MADS-box), and no TF families were significantly under-represented in the embryo sac. This contrasts with MP, seedling, and Ov, where there was a global un-derrepresentation of TFs. In the MP-enriched gene list, only orphan TF genes and MADS box genes (including a previously identified MADS box gene specific to pollen [50]) are overrepresented. Neither seedling nor Ov had any TF gene families overrepresented by the criteria used.
Because the MADS gene family appeared in both MP and ES gene lists, it was analyzed in greater detail (Additional file 12). Ten MADS genes are in the MP-enriched gene set, and four are present in the dual gametophyte-enriched gene set (although three of these four are signifi-cantly higher in MP than ES and so are also present in the
MP-enriched set). Enrichment for different MADS family members in the ES and the MP is reminiscent of the dis-tribution of ES-specific and MP-specific MADS genes in Arabidopsis[17,27,51-54]. InArabidopsis, MIKC* MADS genes are overrepresented in the MP [13,15,55], whereas the type I classαand βgenes are overrepresented in the ES [53]. In maize, all MIKC* MADS genes are enriched in MP, supporting the conclusion for an ancient role for these genes in the male gametophyte [56]. Other MP-enriched maize MADS genes fall into the MIKC and the type 1 class α groups. Maize ES-enriched genes fall into the MIKC and the type 1 class αand γgroups, which is somewhat distinct from the pattern inArabidopsis. There are no clear type 1 classβMADS genes in maize, just as there are none reported in rice [57].
The phylogenetic relationships between ES-enriched genes were also determined for the other TF families overrepresented in the embryo sac. The NAC gene fam-ily was particularly striking, with 25 of 25 genes in one clade being ES-enriched and only one of the 109 genes in the other clade being ES-enriched (Additional file 13). For the AP2-EREB, WRKY and MYBR families, ES-enriched genes were broadly distributed across most clades, although differences between subgroups exist (for example, local over-representation of a few closely related genes; Additional files 14, 15, and 16). For many of these sub-family enrichments of TFs, the shared ES expression patterns are associated with syntenic regions, rather than tandem duplications, and may reflect an ancestral embryo sac function for these branches of the gene family.
Analysis of small peptide gene family expression
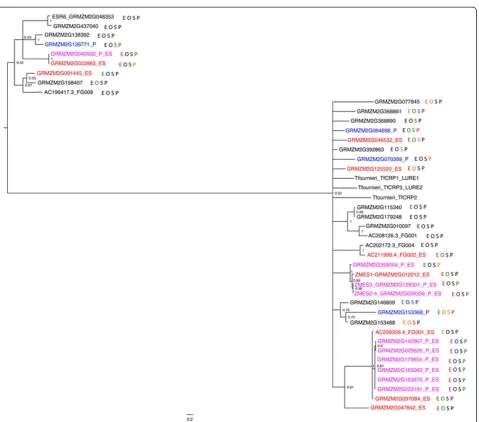
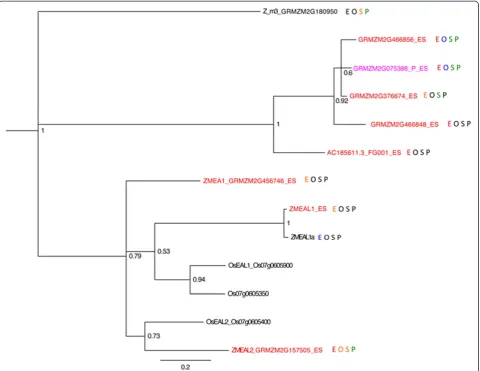
The expression pattern of small peptide gene families was investigated in greater detail based on three reasons: (1) GO analysis highlighted small peptide DEFL genes as overrepresented in all three gametophyte-enriched gene sets; (2) shorter transcripts were more prevalent in the ES transcriptome compared with the other three tissues (data not shown); and (3) probes for small peptide genes were often omitted from earlier microarray stud-ies. Characterization focused on two families with known gametophyte members: DEFENSIN/LURE (DEFL) [44], and Zm Egg Apparatus1 (ZMEA1)-LIKE (EAL) [58-61]; and two families that had not previously been shown to have gametophyte-expressed members, CLAVATA3-ESR (CLE) [62], and LITTLE ZIPPER (ZPR) [63] (Figures 5 and 6; Additional files 17 and 18).
that an additional duplication exists in A188. Using BLAST to identify similar genes in the B73 genome identified 39 DEFL gene models in the B73 v5a WGS, a larger DEFL family than in the AgriGO database. Ex-pression analysis shows clear bias for exEx-pression of these genes in the embryo sac. Twenty of these are expressed above 1 FPKM in ES, compared to five above 1 FPKM in MP, six in seedling, and four in Ov. In all, 23 of the 39 DEFL genes have tissue-enriched expression in one or both of the gametophytes. The strong embryo sac en-richment for DEFL gene expression contains genes in three clades within the DEFL family, one group including ZmES1throughZmES2/4, one clade with all members in
either the ES-enriched or dual gametophyte-enriched gene set, and a third clade more divergent from the rest of the DEFL genes, including the endosperm-expressed ESR6 gene (Figure 5). Many of the ES-enriched DEFL family members are found in tandem clusters of recently dupli-cated family members, as exemplified by theZmES1-3-2/4 cluster. The relationships within these clusters are more robust than those between the less recently diverged groups. Of the 19 DEFL genes in the ES, 10 are also dual gametophyte-enriched, although the level of expression in the MP is consistently lower than in the embryo sac.
[image:11.595.61.541.83.505.2]GRMZM2G456746), which encodes a protein that func-tions in the embryo sac as a pollen tube attractant [58]. This family is characterized by an EA1 box near the carboxyl terminus [59]. Three additional small peptide EAL genes have been described: ZMEAL1 (transcript maps upstream of and includes GRMZM2G576769) [64],
ZMEAL2(GRMZM2G157505) and GRMZM2G180950.
BLAST querying for other small peptide ZmEA1 ho-mologs in the B73 genome identified six additional genes (Figure 6). ZMEAL1 is expressed in the embryo sac and required for normal antipodal cell develop-ment [64]. Like the DEFL family,EAL genes also show family-wide enrichment in the embryo sac, with eight above 1 FPKM in ES, none in MP, two in seedling, one in Ov, and one with expression below 1 FPKM in all tissues tested. ZMEA1, EAL1, and EAL2 are part of a
cluster of four tandemly duplicated genes on chromo-some 7 with the fourth gene adjacent to and nearly identical toEAL1but with much lower expression. All members of this cluster are preferentially expressed in the embryo sac, albeit at different levels. A second clade including four tandemly duplicatedEALgenes located on chromosome 8 also has every member in the ES-enriched gene set.
[image:12.595.59.540.89.460.2]there were two above 1 FPKM in ES, one in MP, three in seedling, and one in Ov. Some of the ZPR family members are characterized by low expression in the ovule and no ex-pression in the ES, suggesting they are expressed in portions of the ovule excluded from the ES samples (for example, in-teguments). The expression of small peptides in the gameto-phytes is therefore not a general phenomenon; rather, the DEFL and EAL families are likely enriched in these tissues for critical roles in gametophyte biology.
Test of gametophyte-expressed genes for gametophyte function
Genes expressed in the gametophytes should be enriched for genes with gametophyte-critical functions. Such a function can be confirmed by observing reduced trans-mission of a mutation in that gene through the rele-vant gametophyte to the next generation. This reduced transmission is also predicted to result in reduced re-covery of mutations in gametophyte essential genes. Thus, there should be a bias against recovering muta-tions in the sets of MP-enriched and ES-enriched genes compared with sporophyte-enriched genes identified in this study. The large collections of sequence-indexed transposon insertions for both the Mutator(UniformMu and the Photosynthetic Mutant Library [65-67]) and Ac/ Ds [68] systems available in maize allowed a test of this prediction.
A baseline for transposon insertion rates in these col-lections was generated by assessing the frequencies for insertions into particular regions of the gene models of the FGS and the RGS. The regions were assessed separ-ately given the known bias in certain transposon insertion patterns (for example, Muis targeted near transcription start sites [69]), and the presumed likelihood of affecting gene function (for example, exons in coding sequence ver-sus introns). As expected, the FGS was associated with significantly higher rates of TE insertion than the RGS (which is also associated with significantly higher methyla-tion [70]) in the insermethyla-tion collecmethyla-tions assessed (Addimethyla-tional file 19). The higher methylation may be associated with a relative decrease in accessibility for these sequences, and thus a decrease in transposon insertion rates [69]. Notably, a set of FGS gene sequences identified as containing
TE/repeat sequences (see Materials and methods) was also associated with a bias toward fewer insertions relative to the non-TE FGS gene models (Additional file 19). There-fore, these TE/repeat-related gene models in the FGS were left out of further analyses of insertion frequency.
The frequency of associated Muand Ac/Ds insertions was then calculated for the seedling, mature pollen and embryo sac sets of tissue-enriched gene models (Table 6; Additional file 20). The UniformMu population is the largest currently available, with 41,543 flanking sequence locations (April 2012, release 5); in addition, the propa-gation scheme for this population relies on self- and sib-pollination, imposing selection against both male and female gametophytic functions. Consistent with the predicted bias, in this population Mu insertions into the MP-enriched and ES-enriched gene sets were significantly less common relative to the seedling gene set. The decreased prevalence of Mu insertions could not be explained solely by differences in gene size among the gene sets, as the bias remains detectable when normalized based on average size in base pairs for each region (Table 6). Although flanking sequence data for the Photosynthetic Mutant Library population (May 2013) is only approximately one-fourth that avail-able forUniformMu, a similar, significant decrease inMu insertions for the MP-enriched and ES-enriched sets is also discernible in this population (Additional file 20). Notably, the deficit appears to be strongest in the MP-enriched gene set for insertions in exons in both popula-tions, consistent with an effect associated with gene function. For the ES-enriched gene set, the strongest decreases appear to be in introns and the proximal promoter, in addition to exons, suggesting that factors in addition to gene function play a role in influencing insertion likelihood.
[image:13.595.56.539.624.717.2]The smaller number of available mapped Ac/Ds inser-tion locainser-tions limits the power to detect bias, but the largest population available (DsMutagenesis, 1,969 flank-ing sequence locations) is a useful comparison to theMu populations as new insertions are selected and propagated solely through the female. Therefore, male-specific gam-etophytic insertions should not be selected against in this population, in contrast to insertions in female
Table 6 Reduced frequency of insertion mutants in gametophyte- versus seedling-enriched genes
Expression characteristic
Total gene models tested
Percentage of gene models tested with a coding sequenceAc/Dsinsertion
Percentage of gene models tested with a coding sequence Muinsertion
Seedling-enriched genes
7,385 1.6% (0.70%) 19.9% (9.3%)
Pollen-enriched genes
2,042 1.9% (0.90%) 12.7% (6.1%)*
Embryo sac-enriched genes 4,238 0.8% (0.43%)* 13.2% (7.1%)*
gametophyte genes. Consistent with this prediction, a significant bias againstAc/Ds insertions is found asso-ciated with the ES-enriched gene set in exons, introns and the 3′end of predicted transcripts. Further, no sig-nificant difference in insertion bias was found between the seedling- and MP-enriched gene sets. However, the MP-enriched gene set is approximately half the size of the ES-enriched gene set, raising the possibility that the limited size prevents a robust assessment of any differences.
To address gametophyte function among these gene sets more directly, we also examined a set of 27 Ds in-sertions from the Ds Mutagenesis population in genes with a range of expression levels to see if the expression pattern would predict whether or not they would have transmission defects (Table 7; Additional file 21). Het-erozygous plants carrying the mutations were crossed reciprocally with homozygous wild type and their pro-geny tested for the presence of the Ds insertion using PCR. Transmission of theDsinsertion was called as re-duced if the frequency in progeny was significantly less than 50% using a χ2test with a cutoff of P< 0.05. Nine of the genes had highest expression in the MP (eight of these were in the MP-enriched set), eight of the test genes had highest expression in the embryo sac (four of them in the ES-enriched set), and the remaining ten genes had their highest expression in one of the sporo-phyte samples (six in one of the sporosporo-phyte-enriched sets). Note that the analysis of transposon insertion pat-terns shows that this population (Tables 7; Additional file 21) is biased against recovery of Ds insertions in genes highly expressed in the embryo sac; due to the propagation scheme for this population, mutations with
strong female transmission defects are likely to be sys-tematically excluded. All 27 mutations were tested for transmission as females; two of the eight Ds insertions in the genes with highest expression in the ES had slightly reduced transmission through the female, whereas none of the other 19 tested had reduced female transmission. Twenty-two were tested as males; of these, 9 were in the MP-enriched list and 13 were not. Two of the nine muta-tions in MP-enriched genes had significantly reduced pollen transmission, whereas none of the other 13 did. Notably, the two mutations with reduced male transmis-sion were in genes likely associated with cytoskeletal and signaling functions crucial for pollen:profilin3[71] and a potential calcium-binding (C2 domain) protein. The roles of the two genes associated with the female transmission defects, encoding a RING finger protein and a hypothet-ical protein, are less clear. Taken together, four of 17 tests of mutations in genes with highest expression in one of the gametophytes showed reduced transmission through that gametophyte, whereas none of the 32 tests without gametophyte enrichment of expression showed reduced transmission through that gametophyte, confirming that the probability of a gene being required for function in the gametophyte can be predicted on the basis of the relative expression between tissues.
Discussion
The ultimate function of the gametophyte is the produc-tion of viable offspring through the fusion of the male and female gametes. The process of double fertilization is unique to flowering plants and results in the forma-tion of a diploid (one maternal: one paternal) embryo and typically triploid (two maternal: one paternal) endo-sperm. Similarities between the male and female game-tophytes may result from conserved functions in gamete production or may have arisen from the inheritance of an ancestral condition of bisexual gametophytes found in many non-seed plants (for example, Physcomitrella) [72]. However, the developmental patterns and cellular functions of the gametophytes are quite distinct. Identifi-cation of the genes active in the gametophyte generation provides a better understanding of their function, simi-larities, and uniqueness. To better understand the function of the maize gametophyte generation we have performed a full transcriptome analysis of mature male and female game-tophytes using RNA-seq.
[image:14.595.58.291.516.649.2]Genome-wide expression analysis reveals several im-plications for maize genome organization. Analysis of expression of genes annotated as transposon-related, as well as analysis of intergenic transcript models with similarity to repeat sequences, reveals that repetitive DNA elements are more likely to be expressed in both the male and female gametophytes than in sporophytic tissues. These data agree with results inArabidopsisthat
Table 7 Transmission frequency ofDsinsertions in genes with high and low gametophyte expression
Dsinsertions with reduced transmission
Female transmission ofDsinsertions in genes with highest expression in embryo sac
2/8
Male transmission ofDsinsertions in genes with highest expression in pollen
2/9
Transmission through the opposite gametophyte for genes with highest expression in the embryo sac or pollen
0/16
Transmission through either gametophyte for genes with highest expression in one of the sporophyte tissues
0/16 (or 1/16*)
Reciprocal crosses were made between wild-type W22 plants and plants carryingDsinsertions in genes with varying expression patterns.Dsinsertions that were recovered in fewer than 50% of the progeny (P< 0.05) were scored as having reduced transmission. See Additional file21for supporting data. *One of theseDslines is on the borderline of being significantly lower than 50% (P= 0.0474).
gametophytes produce RNA from highly repetitive DNA elements [23,27,36]. Perhaps, as inArabidopsis, in maize this is done as a means for silencing mobile elements in the germline, although the data here do not resolve in which cells these transcripts accumulate or are synthe-sized. Future experiments are necessary to determine if these transcripts are present in the gametes, whether or not they are transcribed in the gametes themselves, or if, as is the case inArabidopsispollen, they are transcribed in subsidiary cells (that is, the antipodal cells and syner-gids of the female gametophyte and the vegetative cell of the pollen grain). Expression of repetitive elements is not identical between the male and female gameto-phytes, with a greater likelihood for their expression in the female than in the male.
In Arabidopsis central cells, non-exonic transcripts, in-cluding known transposon and other intergenic transcripts, are more common than in other tissues - approximately two- to four-fold more non-exonic transcripts are in central cells than in seedlings or immature floral buds [34,73,74] - raising the possibility that transcriptional activity in ‘intergenic’ regions is a common feature of angiosperm gametophytes. Arabidopsis pollen also has a high frequency of intron reads [33] as well as expres-sion of TEs [36]. In Arabidopsis, like maize, most pre-dicted intergenic transcripts in the gametophytes are less than 500 bp [33]. However, most of the non-exonic Arabidopsis central cell reads were intronic, suggesting that this is driven in large part by incomplete annotation [34]. In contrast, in maize 90% or more of these reads are intergenic, suggesting that both incomplete annotation and TE transcripts are responsible for the exceptional ES transcriptome. Consequently, true intergenic transcrip-tional activity may vary between species. The higher ex-pression of transposons and other intergenic sequences in maize embryo sacs may reflect either a higher activity of maize transposons than of those inArabidopsisor the dif-ference between sampling the whole embryo sac in maize versus the central cell inArabidopsis. Cell-specific analysis of these transcripts in maize is needed to resolve whether it is one of these two alternatives or a combination of the two. Two classes of transposons are also expressed in rice ovules but it is not known if these are in the embryo sac or the surrounding ovule tissue [75].
Like the pattern of TE transcripts, intergenic, non-repeat transcripts are more common in ES samples than other tissues. Potential novel genes were defined as gene models assembled directly from the RNA-seq data that lacked homology to known TEs and other repeats. More potential protein-coding novel genes were identified in ES-enriched and MP-ES-enriched gene sets than in sporophyte-enriched sets, with the greatest number present in the embryo sac. The relative inaccessibility of this tissue may have caused embryo sac-specific transcripts to be
underrepresented in the expression data used to help build maize gene models, and thus be omitted from annotated gene sets. The high number of gametophyte transcripts intergenic to the WGS may be an add-itional consequence of the genome-wide relaxation of silencing of repetitive elements (and sequences adja-cent to repetitive elements) in the gametophytes com-pared with the sporophyte. RNA-seq transcript assembly, including the samples in this study, identified lncRNA genes in the maize genome, and many of these were also found to be intergenic to WGS gene models [38]. Interest-ingly, reproductive tissues, including pollen and embryo sac, had more examples of lncRNA expression than any other tissues characterized.
The pollen transcriptome is also notable for its un-usual representation in the two subgenomes of maize. Maize consists of two subgenomes from an ancient allo-tetraploidy event, with subgenome 2 characterized by re-duced expression and rere-duced gene retention rates relative to subgenome 1 [11]. However, relative to the other three tissues assessed (which conform to expectations), pollen is associated with a significantly greater proportion of expres-sion associated with genes of subgenome 2. This increase in subgenome 2 expression is not due to over-representation of pollen singleton genes in subgenome 2 (that is, genes for which the corresponding subgenome 1 duplicate has been lost over evolutionary time), but rather due to a retention of more duplicate pairs (that is, both subgenome 1 and 2 genes are retained in the genome) and correspondingly fewer pollen singleton genes in subgenome 1. Moreover, both members of a duplicate pair are more likely to be in the MP-enriched transcriptome than duplicates are to be in the other three tissues, consistent with the idea that expression of both plays a functional role in pollen. Thus, selection could be acting to maintain functional copies of both mem-bers of pollen-expressed genes following tetraploidization.
germination, tip growth and fertilization processes. Con-sistent with this idea, pollen-specific genes in an out-crossing relative ofArabidopsis(Capsella grandiflora) are associated with stronger purifying selection and greater proportion of adaptive substitutions than sporophyte-specific genes [78]. In this interpretation of gene balance, one would expect to see a larger percentage of pollen-critical genes to be retained as duplicates in maize, and furthermore, that mutation of either copy should result in a deleterious phenotype. At least one such example has already been described, the rop2/rop9 duplicate pair, al-though the deleterious effect ofrop2 mutation is only re-vealed when competing with wild-type pollen [79]. This interpretation thus predicts that the MP-enriched dupli-cate genes identified herein are more likely to be associ-ated with such competitive defects. Consequently, it also suggests that the overrepresented GO category processes identified in the MP-enriched subgenome 2 set (localization, transmembrane transport, and pectin-esterase activity) are more likely subject to such dosage sensitivity.
Analysis of GO categories confirms previous results (for example, [10-13]) that regulation of a dynamic cyto-skeleton is an important aspect of pollen biology. Addition-ally, post-translational modification is also overrepresented in the pollen transcriptome. Protein modification (for ex-ample, protein phosphorylation) may facilitate the rapid growth reorientations in response to local cues necessary for pollen tube function. In the ES-enriched gene set, regulation of transcription and small peptide DEFLs were overrepre-sented. Because of the presence of the DEFL gene family in the embryo sac transcriptome, additional small peptide gene families were also analyzed, since they were mostly not in-cluded in the GO term analysis. A second family of small signaling peptides, the EAL family, is also overrepresented in the ES transcriptome. Some members of both of these families have previously been shown to have female gameto-phyte expression [28,58], and to be involved in cell identity [64] and species-specific interactions with the pollen tube [47,60,61]. Here we have expanded the analysis of these gene families and shown that many members are enriched in the female gametophyte transcriptome. Certain DEFL genes show enriched expression in Arabidopsiscentral cells [34], suggesting that at least some of the DEFL enrichment re-ported here is associated with the central cell of maize. Cor-relations of gametophyte expression with phylogenetic relationships, including their location in tandem arrays, sug-gests that female gametophyte expression is an ancestral fea-ture of some branches of both the DEFL and EAL gene families. The DEFL family also has members enriched in both male and female gametophyte transcriptomes. Mir-rored expression of these small peptides in the two gameto-phytes may indicate a mechanism for reciprocal signaling between them. Shared and reciprocal signaling pathways of
the male and female gametophyte will be easier to identify and resolve once it is known how cells perceive and respond to these small peptides.
Enrichment for transcriptional regulation in the em-bryo sac transcriptome was concentrated in five gene families: MADS, NAC, AP2/EREB, MYB-R, and WRKY. The MADS box gene family is also over-represented in Arabidopsis gametophyte transcriptomes. Maize and Arabidopsis both show a prevalence of pollen-expressed genes in the MIKC* family, suggesting that pollen function for MIKC* genes may predate the split between monocots and eudicots. Both maize andArabidopsisalso have mem-bers of the type 1 classαMADS genes. However, while in Arabidopsisthe type 1 classβ genes are overrepresented in female gametophytes, this clade is absent in maize. In maize, these functions may be taken over by other MADS gene clades (for example, the MIKC class, present in the ES-enriched gene set of maize, but not of Arabidopsis). The NAC, AP2, MYB-R, and WRKY gene families are also over-represented in the ES-enriched gene set. An overlap-ping set of TF families are over-represented in the tran-scriptome of whole rice ovules, including not only the AP2/EREB and MADS families but also the ABI3, AP2, YABBY, C2H2, HSF, LFY, MYB, and ZfHD families [75]. Many of these differences likely arise from the inability to compare the embryo sac to its surrounding ovule tissue in the rice study, but the shared groups may reflect gameto-phyte functions in the ancestor of maize and rice.
Analysis of mutants and mutant frequencies show that genes significantly enriched in the gametophyte transcriptomes are more likely to be required in the gametophyte than other genes. Mutant frequencies and transmission rates confirm that gametophyte-enriched expression is predictive of a requirement for gameto-phyte function without making additional accommoda-tions for genetic redundancy. Consequently, the entire transcriptomic dataset is expected to prove useful for identification of candidates for gametophyte mutants, as well as for additional broader analysis of gameto-phyte functions.
Conclusions
The gametophyte transcriptomes, particularly that of the male gametophyte, are distinct from those of sporo-phytic tissues, in agreement with results in Arabidopsis [12-15]. Analysis of RNA-seq data is useful for identify-ing previously unrecognized genes with gametophyte ex-pression, particularly for the less accessible female. The male and female gametophyte transcriptomes are quite distinct from one another in the specific content of expressed genes, but some similarities in trends can be de-tected. Both gametophytes are more likely to express transposons/repetitive DNA than the sporophytic tissues examined, a phenomenon that has been reported previ-ously in the pollen grain in maize [23] and Arabidopsis [36]. Male and female gametophytes are also both enriched compared with sporophyte tissues for expres-sion of MADS box TFs and small DEFL signaling pep-tides. Whether these shared patterns reflect conserved haploid generation functions or convergence of function is unclear. Reduced mutation frequency in gametophyte-expressed genes also confirms the utility of these expression-based gene sets in identifying genes that are critical for gametophyte function and/or develop-ment. Comparison of retention rates for duplicate genes expressed in the pollen grain versus other tis-sues suggests that pollen function and competitiveness are more sensitive to gene balance, affecting evolution of gene pairs after genome duplication events.
Materials and methods
Sample preparation and RNA isolation
Plants for RNA were grown under long day conditions in the greenhouse in Stanford, CA or in summer field conditions in Corvallis, OR. Samples were collected be-tween 11:00 and 11:30 am. Fresh mature pollen was col-lected upon shedding. For mature female gametophytes, ovules were dissected from ears and subjected to cell wall digesting enzymes to facilitate isolation of embryo sac tissue. ES and Ov samples were paired (that is, the ovule samples were produced from the tissue left over from embryo sac isolation). Three replicate RNA samples
of each type were used to prime cDNA synthesis and amplification, with a slightly modified protocol for embryo sac and ovule tissue, due to the limited amount of starting material. We constructed libraries and produced paired-end and single-paired-end sequence reads on the Illumina or SOLiD platform.
For isolation of ovule and embryo sac tissue whole ears were processed in the lab under a dissecting micro-scope. Ovules were isolated from ear florets with a silk length of approximately 10 cm by removing the silk and ovary wall with forceps and cutting the ovule at its base from the floret. Each ovule was immediately placed in a petri dish in a cell wall enzyme digesting mix of 0.75% pectinase, 0.25% pectolyase, 0.5% cellulase, 0.5% hemi-cellulase buffered in 0.55 M mannitol pH 5.0 for one hour after collecting the last ovule at 24 ± 1.0°C before embryo sac isolation according to Kranz et al. [81] and Yanget al. [26]. Embryo sacs (with some attached nucel-lus cells) were mechanically extracted from ovules using dissecting needles. The embryo sac samples and remaining ovule tissue (now lacking an embryo sac) were placed in separate microfuge tubes containing 500μl of 0.55 M man-nitol pH 5.0 until 15 to 20 embryo sacs and ovules lacking embryo sacs had been collected, and then samples were spun at 3,000 rpm for 1 minute and excess mannitol re-moved. Samples were homogenized in 400 μl of Trizol (Life Technologies, Grand Island, New York, USA) on a MixerMill300 (QIAGEN, Hilden, North Rhine-Westphalia, Germany) with a tungsten-carbide bead (QIAGEN) at high speed for 3 minutes, and RNA extracted according to man-ufacturer’s specifications to isolate total RNA. Mature, freshly shed pollen was collected from field-grown B73 plants, frozen in liquid nitrogen, and RNA extracted with Trizol (Invitrogen) and purified from the aqueous phase using RNEasy MinElute columns (QIAGEN). For whole seedling samples, all shoot tissue above the first leaf node was collected from 9-day-old B73 plants on the same day in liquid nitrogen, and RNA was isolated as for mature pollen.
(endosperm) tissue in any samples and no contaminating embryo sac tissue in the Ov samples, the resultant ampli-fied cDNA was tested for presence and/or absence of sev-eral test genes for both B73 and W23 samples. PCR was performed with primers for theEmbryo Sac1(ES1) (an em-bryo sac-specific gene) [28], Embryo surrounding region1 (ESR1) (an endosperm-specific gene) [82],EBE2(a central cell and endosperm-specific gene) [83],ubiquitin(a consti-tutive gene), andknox6(a constitutive gene) [84]. Samples with no detectableESR1transcripts in the ES or Ov sam-ples or detectableES1orEBE2transcripts in the Ov sam-ples were used for sequencing. The cDNA libraries from B73 inbred samples were prepared for Illumina sequencing using a nebulizer for fragmentation and the Illumina Paired-End Sequencing preparation kit per the manufac-turer’s protocol (Illumina catalogue numbers PE-102-1001 and PE-102-1002). Illumina sequencing was performed at the Oregon State University Center for Genome Research and Biocomputing. cDNA of the W23 samples was then used to prepare libraries and sequenced using the ABI SOLiD platform by Seqwright DNA Technology Services (Houston, TX, USA). Following mapping of reads to the maize genome and generation of FPKM values for all maize genes, a final round of quality control of the ES sam-ples was performed. Because of the potential for variability introduced by the amplification of cDNA before sequen-cing and by variation in the amount of nucellar tissue left attached to the embryo sacs, a set of high confidence em-bryo sac-specific genes selected from the literature were examined in all the ES samples to determine which were sufficiently robust for further analysis (Additional file 22). These high confidence embryo sac-specific genes have been confirmed as embryo sac-specific in the context of the ovule either by in situ hybridization or by transgenic reporter analysis.
Sequence analysis
80-mer paired-end reads were processed using the Illu-mina Genome Analysis Pipeline, version 1.5.0. TopHat, version 1.0.13, was used to align the RNA-seq reads to the maize genome (version ZmB73_5a.59) following sev-eral preprocessing steps, which included primer trim-ming, quality control filtering and length sorting [85]. Prior to aligning reads to the maize genome, reads matching maize repetitive sequences were filtered using the list available from the maize TE database [39]. Reads were aligned in paired-end mode when both reads of a pair passed all preprocessing steps, otherwise reads were aligned as singles. Empirical transcripts (etranscripts) were assembled from aligned data using Cufflinks, ver-sion 0.8.1, and FPKM expresver-sion data were generated using TopHat and Cufflinks [86]. All reads were then loaded into the gbrowse genome browser and a novel gbrowse plugin, QuantDisplay, was used to visualize the
data. The sequence data are available at the Sequence Read Archive at NCBI, accession number SRP006965.
Given that TE databases have improved since the ini-tial RefGen annotations were generated, BLAST was used to identify additional TE-related gene models in the FGS, WGS, and empirical transcript models [87]. All transcript model sequences were BLASTed against three different maize repeat databases (the MIPS Repeat Data-base, an updated version of the MTEC Transposable Element database [88], and the UTE database of unique TE sequences [89]). The top BLAST hit (ranked by bit score) for each was used to define whether a particular transcript model included TE-related sequences using a previously validated threshold (minimum hit length 50 bp, minimum identity 85%, minimum bit score 50) [41]. Sequences in the empirical transcript set not recognized as TE-related by this set of parameters were further screened by the RepeatMasker tool [90,91], which also detects simple sequence repeats. Sequences with lengths greater than 20% repetitive, or with >240 Smith-Waterman match score, were also classified as TE/repeat-related. Em-pirically predicted transcripts that did not correspond to annotated gene models and also were not recognized as TE- or repeat-related were subsequently analyzed by the BLAST2GO tool, to assess their potential protein coding capacity, either via BLAST or via a scan of the InterPro collection of protein signature databases [92].
Quantitative RT-PCR analysis
Two control primer pairs were chosen, one each for ubi-quitin and actin transcripts, each of which would target cDNA from multiple genes of each class to minimize ef-fects of tissue-specific isoforms. All primer pairs were designed using Primer Select of the DNASTAR software package (Madison, Wisconsin, USA). Primer pairs were selected based on the following criteria: (1) they had to amplify within the last two or three exons to avoid po-tential problems from truncated, non-full-length cDNA; (2) they had to span an intron to distinguish cDNA from genomic DNA amplicons; (3) they had to have ampli-cons less than 150 bp to increase efficiency; (4) and they had to have a Tm of 60.0 ± 1.5°C. Primer pairs were then tested for efficiency on a pool of cDNA from all 12 sam-ples. Primer pairs were only selected for further analysis if they produced a single amplicon and had an efficiency between 1.8 and 2.0. This produced a set of 22 genes for verification by qRT-PCR (genes and primers in Additional file 23).
Analysis of gene sets based on expression