Proposing an Optimization Algorithm for Employee
Competencies Evaluation using Artificial Intelligence
Methods: Bayesian Network and Decision Tree
Kamal Moh’d Alhendawi
PhD. Candidate, School of Computer Sciences, Universiti Sains Malaysia
Penang, Malaysia
Ahmad Suhaimi Baharudin
Senior Lecturer, School of Computer Sciences, Universiti Sains Malaysia
Penang, Malaysia
ABSTRACT
Recently, the multidisciplinary research has been highly considered by the computer sciences researchers as it contributes to the innovation in terms of concepts and practices. This paper keeps special focus on the employment of belief network including influence and Bayesian nets models in modeling the uncertainties and decision making process. It attempts to model and optimizes one of the most important functions of the human resources called Competency Based Evaluation (CBE). Consequently, the present study is concerned with modeling the uncertainties of the CBE through AI modeling approaches as well as developing a new optimization algorithm towards decreasing the evaluation features of the employee performance. The developed algorithm aims at finding the decision regarding the performance based on Pearl’s algorithms, where the conditional probabilistic is employed in order to decide regarding the employee performance based on his competencies. MATLAB is actually used for the implementation and empirical analysis purposes. The encouraging results of the study provide empirical evidence on the efficiency of the proposed algorithm as this algorithm minimizes the evaluation features. Thus, it would contribute to the enhancement of the competency based evaluation.
KEYWORDS
Artificial Intelligence (AI), business intelligence, uncertainty problem, Optimization, Pearl’s algorithm, Bayesian Net(BN), Inference Diagram (ID).
1.
INTRODUCTION
The belief networks are directed graphical models that represent the dependencies among a set of variables and also used for solving the influence diagram problem, where it also called Bayesian Networks [1, 2].
The arcs of this type of network signify direct dependencies between the linked propositions, and the strengths of these dependencies are quantified by conditional probabilities or percentage. In practice several Artificial Intelligence (AI) models are used to represent the knowledge extraction of expert systems depending on conditional probability computations, where belief network (BN) is one of these. In addition to the use of BN, the decision support tree is also employed as a decision support tool for filtering and minimizing the features that recognize the employee performance based on his competencies including 9 factors: loyality, self trust, commitment, recall knowledge,
concept knowledge, strategic, extended, interpersonal, technical/Task.
As a little is known regarding the employment of AI in maximizing business benefits, this study is considered as on of the fewest to explore and model ECE using several intelligent decision tools and models. Second, it highlights both the use of decision support and probabilistic models in hypothesizing the relationship among variable and taking decision. Finally this paper proposes a new optimization algorithm to enhance the competency based evaluation.
2.
PRELIMINARIES
The following sub sections express the basics and concepts of modeling using influence and probabilistic computation of uncertainties of problem variables [3].
2.1
Bayesian Networks and conditional
probability:
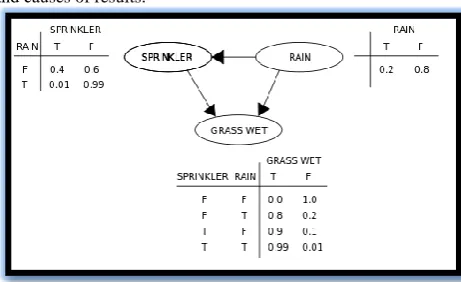
[image:1.595.319.550.530.671.2]As mentioned in [3], the Bayesian network is a probabilistic directed graphical model in which each node represents uncertain or decision variable, the following figure (1) illustrates an application on using conditional probability for checking the conditional dependency of problem variables and causes of results.
Fig 1: Bayesian network model
In addition, it is essential to mention the above figure notations including[4, 5]:
Arrow in the Bayesian network indicates the dependency relationship.
The fraction inside the Conditional Probability Table (CPT) represents the strength of the dependency relationship existed among variables.
Suppose that the names of the variables have been abbreviated to
G = Grass wet, S = Sprinkler, and R = Rain then the joint probability function is:
P(G,S,R) = P(G | S,R)P(S | R)P(R)
In probability theory, the conditional probability of A given B is the probability of A if B is known to occur. It is commonly notated P(A | B), and sometimes PB(A) where :
P(A | B) = PB(A) = P(A ∩ B) / P(B)
The probability of raining given grass wet is : P(R=T | G=T) = P(G=T | R=T) / P(G=T) ≈ 35.77%.
2.2
Belief Network and Influence Diagram
[image:2.595.342.506.504.710.2]Regarding the influence diagram (ID) [6,7,8,9,10] , It is also called decision diagram , a decision network, or a relevance diagram, is the graphical and mathematical representation of a decision problem. It is a generalization of a Bayesian network, through which both probabilistic inference problems, and decision making problems (following maximum expected utility criterion) can be modeled and solved. Moreover it is a directed acyclic graph with three types (plus one subtype) of node and three types of arcs (or arrows) between nodes. ID is used to represent and evaluate the decision making under uncertainty. The following explanation shown in figure 2 illustrates the most important concepts and notations that can be used to represent the problem:
Fig. 2. Example on influence diagram
Nodes: The diagram nodes are classified into:
Decision node (corresponding to each decision to be made) is drawn as a rectangle.
Uncertainty node (corresponding to each uncertainty to be modeled) is drawn as an oval.
Deterministic node (corresponding to special kind of uncertainty that its outcome is deterministically known whenever the outcome of some other uncertainties are also known) is drawn as a double oval.
Value node is drawn as an octagon (or diamond).
Arcs: The influence diagram has several types of arcs including:
Functional arcs (ending in value node) indicate that one of the components of additively separable utility function is a function of all the nodes at their tails.
Conditional arcs (ending in uncertainty node) indicate that the uncertainty at their heads is probabilistically conditioned on all the nodes at their tails.
Conditional arcs (ending in deterministic node) indicate that the uncertainty at their heads is deterministically conditioned on all the nodes at their tails.
Informational arcs (ending in decision node) indicate that the decision at their heads is made with the outcome of all the nodes at their tails known beforehand.
3.
METHODOLOGY
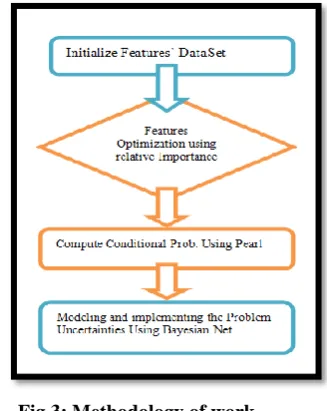
TO achieve the main objectives of this paper including the modeling of the uncertainties and competency based evaluation (performance appraisal), minimization of object (employee) features and taking decision regarding the specialization of the employee (Scientific /Art) depending on his competency based assessment including attitudes, knowledge and skills.As an important point, the research paper objectives are achieved through the following steps, where figure 3 shows these steps:
[image:2.595.76.293.587.697.2] Specifying the features that truly identify the performance of employee based on competency based approach (attitudes, knowledge and skills).
Creating and initializing a Dataset that represent the employees’ data randomly using MATLAB because the proposed model (Competency based evaluation) has not yet discussed in the field of AI.
Optimizing and modeling the employee features depending on relative performance (for optimization) and decision tree (for modeling).
Computing the conditional probability of each of optimized feature based on its dependencies using massage passing algorithm Pearl (sum product).
Modeling the optimized features with their conditional probabilities using Bayesian Net using MATLAB.
4.
OPTIMIZATION & Modeling
Using BN
This section discusses Optimization & Modeling Using decision tree and BN.
4.1
Decision Tree (DT)
[image:3.595.322.539.99.284.2]
As the decision Tree is considered as one of the mostly used tools for decision making purposes, it is not only used to modeling the initial data set features but also to decide regarding the optimization (minimization) of these features based on relative importance. Figure 4 shows the decision tree by which the features of the CBE are filtered.
Fig. 4. Decision Tree filtering features based on relative importance
The above mentioned figure 4 shows the results of the optimization process. The result provided by decision tree indicated that three out of nine factors are important to decide regarding performance. The resulted factors are Extended knowledge, recall knowledge and loyalty.
4.2
Influence Diagram
Concerning the modeling process of the employee evaluation’s uncertainties, the influence diagram is used to represent the real situation where a decision-maker is looking forward to expect the employee specialization (Scientific/Art)
according to the three uncertainties including attitudes, knowledge and skills:
Fig 5: Influence diagram of ECE
4.3
Bayesian Networks and conditional
probability:
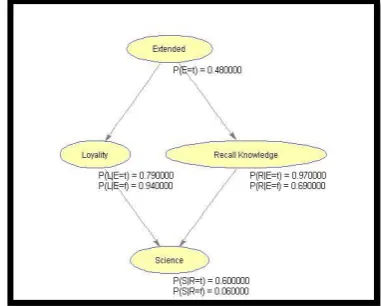
[image:3.595.328.519.405.558.2]In this study the Bayesian Net is employed to model and implement the uncertainty problem of employee’s competency based evaluation using the pearl algorithm for computing the conditional probability of each uncertain feature in term of other features. Figure 5 shows the model and conditional probabilities of the problem’s uncertainties.
Fig 6: Bayesian Net
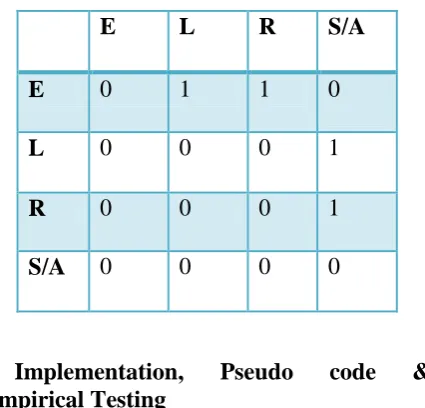
[image:3.595.56.299.409.603.2]Table 1. Adjacent matrix of nodes connectivity
E
L
R
S/A
E
0
1
1
0
L
0
0
0
1
R
0
0
0
1
S/A
0
0
0
0
5.
Implementation,
Pseudo
code
&
Empirical Testing
This study aims at making factor optimization, modeling the uncertainties and finally making decision through the utilization of AI tools including relative importance, conditional probability modeling and decision regarding uncertain situation.
Therefore, it seems more appropriate to discuss the implementation and testing through two sub sections reveal. First section provides a brief explanation of the practical implementation of the problem. In the second section, the development of the new optimization algorithm is discussed.
5.1
Practical Steps
It is clearly seen that decision tree (DT) is utilized as a decision tool for filtering and optimizing 9 factors including attitudes (Loyalty, Self Trust and commitment), knowledge including (recall, concept and extended, strategic) and skills (technical and task) into 3 factors (extended, recall and loyalty) based in relative importance. The second practical step that is followed by the researcher is to compute the conditional probability of the features depending on the randomly initialized data set, where this dataset includes 100 cases for employees’ evaluation (50 cases for the employees with scientific specialization and 50 for the employees with Art specialization).
The final step is to model and implement the optimized three factors in order to recognize any input probe signature or case.
5.2
Proposed Optimization Algorithm
(PSEUDO code)
The following PSEUDO code shows the proposed algorithm which is developed in order to optimize the Employees Competency based Evaluation problem ECE.
Fig 6: PSEUDO Code
6.
RESULTS
Based on the AI modeling and the empirical
testing of the developed algorithm, it is found that:
There is an essentiality to model the uncertainties in order to recognize and conceptualize the interaction among the system factors, and therefore the basic step toward the assessment is done [11].
Employing the artificial models such as Bayesian nets and decision tree leads to minimize the recognition features of competency based assessment from 9 features (loyalty, self trust, commitment, recall knowledge, concept knowledge, extended, strategic, technical and task) into 3 features including recall knowledge, loyalty and extended. Consequently, this will affect the satisfaction of the top level management positively [12].
The decrease in the features of the performance recognition will have a positive influence on the speed of evaluation, and also, it will minimize the size of data entry, and thus the efficiency of the system will be increased.
Utilizing the AI methods in the system planning and design has a positive impact on the level of user interaction, and therefore, the satisfaction and performance are increased as well [11,12].
7.
CONCLUSION
the uncertainty problem through using the aspect of decision support system. The results of the experimental testing indicated that this algorithm would have a positive impact on the quality and accuracy of decision making at the senior level. Thus, it is expected that the proposed optimization algorithm would increase the efficiency of the competency based evaluation.
8.
ACKNOWLEDGMENT
The authors of this paper would like to convey their sincere thanks to Universiti Sains Malaysia for providing the fund for this research through the Short-Term Research Grant Number: 304/PKOMP/6311028. Also we would like to express our thank our colleagues: Amjad AlBahnasawi, Raslan Siam, Marwan Abu Zayed, Mahmoud Abu Ghali, Nihal Saqer, Ayda Alnady and Iman Mukhariz for their help during the research.
9.
REFERENCES
[1] Pearl, J. (2000). Causality: models, reasoning and inference, Cambridge Univ Press.
[2] Pearl, J. (1986). Fusion, Propagation, and Structuring in belief networks, Artificial intelligence, 29 241-288. [3] Koski, T. and Noble , J. (2011). Bayesian networks: an
introduction. Wiley.
[4] Radlinski, L. (2010). A survey of bayesian net models for software development effort prediction. International Journal of Software Engineering and Computing 2(2): 95-109.
[5] Borsuk, M. E., C. A. Stow, et al. (2004). A Bayesian network of eutrophication models for synthesis, prediction, and uncertainty analysis." Ecological Modelling 173(2): 219-239.
[6] Henrion, M. (2013). Practical issues in constructing a Bayes' belief network. arXiv preprint arXiv:1304.2725. [7] Detwarasiti, A. and Shachter, R.D. (2005) Influence
diagrams for team decision analysis. Decision Analysis”, 2(4): 207-228.
[8] Shachter, R.D.( 1989). Probabilistic inference and influence diagrams. Operations Research 36: 589-604. [9] Marcot, B. G., J. D. Steventon, et al. (2006). "Guidelines
for developing and updating Bayesian belief networks applied to ecological modeling and conservation." Canadian Journal of Forest Research 36(12): 3063-3074. [10] Gustafsson, P., U. Franke, et al. (2009). Quantifying IT
impacts on organizational structure and business value with Extended Influence Diagrams. The Practice of Enterprise Modeling, Springer: 138-152.
[11] Alhendawi K., Baharudin A.(2013).Evaluating the Effectiveness of Web-based Management Information
System from the Perception of Educationalists: Exploratory Study. Information Technology Journal, 12: 1068-1078.
[12]Alhendawi K., Baharudin A.(2013). The Effects of Quality Factors of Web-based Information System on the Employee Contextual Performance. Journal of Theoretical and Applied Information Technology. [Accepted and on press]
AUTHOR BIOGRAPHIES
Kamal Moh’d Alhendawi is currently a Ph.D. candidate in school of Computer Sciences, Universiti Sains Malaysia (USM). He received Master degree from Islamic University, Gaza in Data Envelopment Analysis (DEA). He had received the B.Sc. in computer sciences from Abu Dies - Faculty of science and technology, Jerusalem University, Palestine. He has several publications in the field of information system, information technology, artificial information systems and applied data mining. Prior to joining USM, He has an academic experience in the fields of system analysis, information management, software engineering, object oriented programming, and network administration. His current research interests include information systems, knowledge management, data mining & business intelligence, and E-Learning.