A Gene Regulatory Network Prediction Method using
Particle Swarm Optimization and Genetic Algorithm
Abhishek Shailendra Singh
Department of Computer Science and Engg . Department of Computer Science and Engg, PEC University of Technology, Chandigarh PEC University of Technology, Chandigarh
ABSTRACT
Gene regulatory networks (GRNs) are complex control systems that deal with the interaction of genes, which eventually control cellular processes at the protein level. The investigation of GRN provides huge information on cellular processes and gene functions and at last contributes to knowledge in genetics and in turn quality of life. By understanding the dynamics of these networks using correct and representative methods and models, potentially cover the way for curing diseases, improving diagnostic procedures and producing drug designs with greater impact.
In this work a GRN prediction method based on TDCLR using PSO and GA is proposed to construct GRN from microarray datasets. TDCLR is used to find the directions of information flow between different gene pairs. The proposed method uses the particle swarm optimization (PSO) to find thresholds for discretizing the microarray dataset and genetic algorithm (GA) is used to generate a set of fit candidate gene pair from which GRN is constructed. The sub-network containing five genes of S.cerevisiae (yeast) is used to evaluate the accuracy of the proposed method. The experimental results show that the proposed method is better than TDCLR and other existing methods such as mutual information (MI) in terms of sensitivity and specificity.
Keywords
Gene Regulatory Networks (GRN), Particle Swarm Optimization (PSO), Genetic Algorithm (GA), Mutual Information (MI), Context Likelihood of Relatedness (CLR), Time Delay Mutual Information (TDMI), Time Delay Context Likelihood of Relatedness (TDCLR)
1.
INTRODUCTION
Microarray technology makes possible to monitor the expression levels of thousands of genes simultaneously under some condition. Microarray technology is used in research issues such as gene selections and prediction of gene regulatory networks (GRNs) from microarray datasets. The problem of gene selection is to select the group of genes which are most significant, while the problem of GRN prediction is to recreate a GRN for a living organism [1] from a microarray dataset. The GRN of a living organism can be inferred from its microarray dataset. Many methods have been proposed for predicting GRNs based on different techniques such as Boolean Networks [2], Perti Nets [3], Dynamic Bayesian Networks [4], and we also have other approaches which are based on soft computing approaches such as genetic programming [5], Fuzzy Rules [6].
Many methods are proposed to predict GRNs based on above techniques. In this paper we propose a novel hybrid method which is based on particle swarm optimization (PSO) and genetic algorithm (GA) to predict GRNs. The proposed method also uses TDMI and TDCLR to find the direction between different pairs of genes.
The remainder of this paper is organized as follows. Section 2 gives introduction to the related methods which are used in the proposed work. Section 3 introduces the proposed method to predict the GRNs. Section 4 reports the experimental results and Section 5 concludes this paper and provides future scopes
.
In Section 6 we have references.2.
RELATED WORK
2.1
Mutual Information (MI) and Time
Delay Mutual Information (TDMI)
The Mutual information (MI) measures the amount of information that can be obtained about one random variable by observing another one i.e. it measures the dependence between two variables. If the two variables are independent then MI between them is zero and if the two are strongly dependent then MI between them is large [7]. The mutual information between two random variables X and Y is calculated using the given formula:
; = , ,
∈ ∈
Where, p(x, y) is the joint probability of x and y, p1 (x) and p2
(y) are the marginal probabilities of x and y respectively, I(X; Y) is the Mutual Information score between variable x and y [8]. The value obtained by above formula is always non negative. If we want to represent the MI in terms of entropies then it can be defined as:
I(X, Y) = H(X) + H(Y) - H(X,Y)
Mutual Information (MI) performs extremely well in detecting both linear and nonlinear relationships [9]. But due to the fact that MI is a symmetric measure, it does not indicate the direction of information flow between pair of nodes in the network. So, we have TDMI which is extension of the concept of MI that allows measuring the direction of an information flow between pair of nodes. TDMI works by adding some time delay in one of the variable and then find mutual information (TDMI) using 1 and 2. Where, denotes time delay,
!"#= !"#$, + & = , + $& + , − (
1
!"#= !"#$, + & = , + $& + , − (
International Journal of Computer Applications (0975 – 8887) Volume 83 – No 12, December 2013
X(t) and Y(t) at (t= 1,…,T) are time series of random variable X,Y at T discrete points. TDMI represents the mutual information as a function of time delay is used as a measure information transmission between two time series. Since TDMIXY and TDMIYX are not symmetric, the difference between
them denotes the net vary of information which may be interpreted as the information flow between them [10].
The information flow between two random variables can be measured using the above equations, but it can also be represented as:
* → * = ∑ * (; ( − (; 0(.
(/ ( 3)
Where, XN denotes (X1, X2, X3, ….,XN) that is, a segment of the
random sequence of X, and 0Yn-1denotes the concatenation of 0 andYn-1,i.e.,(0,Y1,Y2,...,Yn-1). This concatenation is equal to considering pairs of (X2, Y1), (X3, Y2) ,..., (Xn,Yn-1) of random sequence values in which the X-values are shifted one time-step into the future [11].
If the value of * → * is positive then it denotes information flows from → ; so, there will be a directed edge between X and Y; and if its value is negative it means information flows from → . so directed edge will be present between Y and X.
2.2
CLR and Time Delayed CLR
The CLR algorithm is an extension of the relevance network (RELNET) approach. The relevance networks approach is used to infer a network in which pair of genes {X; Y} is linked by an edge if the mutual information (MI) between them is larger than some set threshold. The complexity of the relevance network approach is O(n2) since all pair wise interactions are considered [12]. CLR algorithm applies an adaptive background correction step to eliminate false connections and indirect influences which involved the computation of Z scores [8]. CLR calculates Z scores for each pair of genes according to the empirical distribution of the MI values. It calculates the
score as 123= 452+53 where, zi and zj are the mapped scores of the MI values and can be calculated as: 52=
60,7$8,9&.:8
;8 in which <2 and =2 stands for the mean and
standard deviation of the empirical distribution of the mutual information values 2, > where k = (1, 2, 3,…, n) [ 13]. If we replace the concept of mutual information (MI) with time delayed mutual information (TDMI) in the above computation then we have time delayed CLR [14].
2.3
Particle Swarm Optimization (PSO)
The particle swarm optimization (PSO) is a parallel evolutionary computation technique developed by Kennedy and Eberhart in year 1995 inspired by the coordinated motion of birds living in groups [15]. In PSO a number of particles are placed in the search space of some problem or function, and each evaluates the objective function at its current location. The change in direction and velocity of each individual particle is the effect of cognitive, social and stochastic influences. The next iteration takes place after all particles have been moved. Eventually the swarm as a whole like a flock of birds collectively foraging for food is likely to move close to an optimum of the fitness function. Each individual in the particle swarm is composed of three D-dimensional vectors, where D is the dimensionality of the search space. These are the current position@@@A?, the previous best position @@@A? and the velocity B@@@A?[16]. The position of particle i in D dimension is given by the vector @@@A? = (xi1, xi2, ..., xiD) and its velocity is given by the vector B@@@A?= (vi1, vi2, ..., viD). Let @@@A? = (pi1, pi2,……, piD) denote the best coordinate of particle i and @@@@AC = (pg1, pg2,….., pgD) denote the best coordinate of particle g in the search space. To migrate, the velocity and the coordinate of particle i at dimension d, where 1 ≤ d ≤ D, are updated according to equation (4) and (5), respectively
BA2D= E × BA2D+ G× HI × A2D− A2D + G×
HI × ACD− A2D (4)
A2D= A2D+ BA2D (5) where, w denotes an inertia weight; Rand( ) denotes a random
number between 0 and 1; c1 and c2 are two constants [17].
3.
PROPOSED METHOD
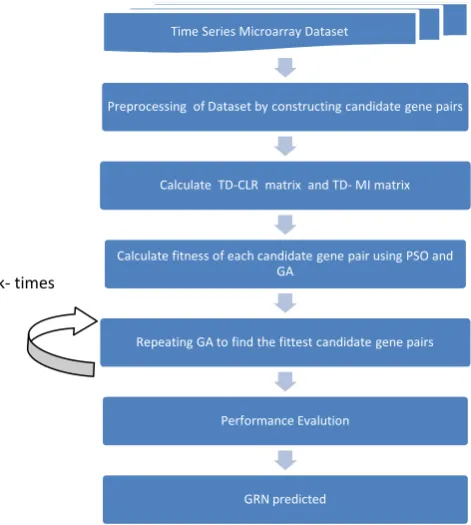
The block diagram of proposed method TDCLR using PSO and GA is given in Figure1. The proposed method has considered two types of regulatory interactions: activation and inhibition. These types of regulatory interactions can be found using TDMI and TDCLR. The steps of the proposed method are as follows:
Step 1. Preprocessing of dataset
The essential task of preprocessing of dataset is done by constructing the table of candidate gene pairs from time series gene expression data. For example, suppose a dataset of 6 genes named as {MBP1; CLN1; FAR1; CLN3; CDC53; SIC1} is taken. The candidate genes pair is shown in Table 1. The total number of candidate gene pairs for n genes dataset is given by (!
(.!! that’s why candidate gene pairs for 6 genes
is 15;
The purpose of constructing the gene pair is to build the fundamental gene regulatory networks i.e. GRN with two nodes and afterwards these networks can be merged into a final GRN.
Table 1. Candidate gene pairs for 6 genes GENE PAIR ID GENE 1 GENE 2
1 MBP1 CLN1
2 MBP1 FAR1
3 MBP1 CLN3
4 MBP1 CDC53
5 MBP1 SIC1
6 CLN1 FAR1
7 CLN1 CLN3
8 CLN1 CDC5
9 CLN1 SIC1
10 FAR1 CLN3
11 FAR1 CDC53
12 FAR1 SIC1
13 CLN3 CDC53
14 CLN3 SIC1
Figure 1. The block diagram of proposed method Step 2. Calculate TDMI and TDCLR matrices
In this step, TDMI matrix is generated which is then used to create TDCLR. In this paper, time delay is taken as = 1 to compute these matrices. TDCLR measures the dependence between two variables and give the direction of an information flow between pair of nodes. For example consider two genes as MBP1 and CLN1 with the given expression as shown in Figure 2. The TDMI is calculated using 1 and 2 and the self edges are not considered in our work so value of diagonal element is zero. The computed TDMI matrix for MBP1 and
CLN1 isK 0 0.0285
0.0265 0 O. The direction of information flow
between gene pairs can be found as TDMI (MBP1, CLN1) = 0.0285 and TDMI (CLN1, MBP1) = 0.0265. The value of TDMI (MBP1, CLN1) is greater than TDMI (CLN1, MBP1). Therefore, the information will flow from MBP1 to CLN1 or we can say that MBP1 activates the CLN1.
Figure 2.Gene Expression Sequences of MBP1 and CLN1 The size of TDMI considering n genes is equal to × . TDCLR matrix is calculated using TDMI. In work done, values which are greater than mean of TDCLR is considered so, there are some entries in the matrix which represents the best edges between different pair of genes.
Step 3. Calculating the fitness value
The fitness value of each candidate gene pairs is calculated after the dataset is transformed by PSO and GA. TDMI and TDCLR are used to determine the types of regulatory relationships between the different candidate gene pairs. Equation 3 can also be used to find the type of regulatory relation between gene X and gene Y, if the value of * →
* is positive it means X activates Y and negative means X
represses Y. After determining the type of regulatory relation, the expression levels of genes are discretized into -1, 0, 1. The pair of threshold is required to discretize the gene expression. These threshold values are used as follow [18]; to discretize the gene expressions.
23= P
1, Q23> S∶ BQU Q UQVV,
−1, Q23< S ∶ IQU Q UQVV,
0, ℎQUEVQ ∶ U6 Q UQVV,
Y
Where, Xij denotes the gene category of gene i at time j; geij denotes the gene expression level of gene i at time j; S and
[image:3.595.306.524.360.495.2]S are thresholds to discretize the gene expression levels. However, it is difficult to find proper thresholds for a candidate GRN. In our proposed method, PSO is used to find the thresholds (Sand S) for each candidate GRN to classify the expression levels of all the genes. While working with PSO different parameters are initialized according to Table 2.
Table 2. The parameters of PSO Fitness function Trimmed mean
(max(R(Gi1,Gi2),R(Gi2,Gi1))) for i = 1, 2, 3, 4, …., n
Numbers of particles 11
W 0.5
C1 1.5
C2 2
Number of iterations 30
Where, Gi1and Gi2 are the two genes of candidate gene pair whose gene pair id is i; R(Gi1,Gi2) and R(Gi2,Gi1) will be defined in the next steps of the proposed method.
Consider the gene pair MBP1 and CLN1 as shown in Figure 2, the discretized gene expression for the pair is shown in Table 3 based upon thresholds S= −0.3500 and S = 0.1375 which are calculated by PSO for the given gene pair .
Table 3. A discretized sequence pair (MBP1, CLN1).
MBP1 1 1 0 0 0 0 0 0 0 0 0
CLN1 -1 -1 0 0 0 1 0 0 0 0 -1
After determining the type of regulatory relations between different gene pairs and the discretized the sequence pairs of gene, the fitness value of each candidate GRN is calculated. Suppose gene pair i consists of gene Gi1 and Gi2 in a candidate GRN. Then we can rearrange the time series data of Gi1 and Gi2 into two sequence pairs, (Gi1, Gi2) and (Gi2, Gi1). Then, we can calculate R (Gi1, Gi2) and R (Gi2, Gi1) according to given Formulae:
Time Series Microarray Dataset
Preprocessing of Dataset by constructing candidate gene pairs
Calculate TD-CLR matrix and TD- MI matrix
Calculate fitness of each candidate gene pair using PSO and GA
Repeating GA to find the fittest candidate gene pairs
Performance Evalution
GRN predicted
-1 -0.8 -0.6 -0.4 -0.2 0 0.2 0.4
1 3 5 7 9 11
G
E
N
E
E
X
P
R
E
S
S
IO
N
L
E
V
E
L
mbp1
[image:3.595.69.271.550.683.2] [image:3.595.317.535.610.656.2]International Journal of Computer Applications (0975 – 8887) Volume 83 – No 12, December 2013
H\2, \2
= ] ^ _ ^
`a\2= 1 ∩ \2= 1
a\2= 1 +
a\2= −1 ∩ \2= −1
a\2= −1 ; EℎQ \2 GBQV \2
a\2= 1 ∩ \2= −1
a\2= 1 +
a\2= −1 ∩ \2= 1
a\2= −1 ; EℎQ \2 UQ UQVVQV \2
Y
H\2, \2
= ] ^ _ ^
`a\2= 1 ∩ \2= 1
a\2= 1 +
a\2= −1 ∩ \2= −1
a\2= −1 ; EℎQ \2 GBQV \2
a\2= −1 ∩ \2= 1
a\2= 1 +
a\2= 1 ∩ \2= −1
a\2= −1 ; EℎQ \2 UQ UQVVQV \2
Y
Where a\2= 1 denotes the probability that the discretized expression of Gi1 in sequence pair (Gi1, Gi2) is 1 i.e. it is the
ratio of number of 1’s of Gi1 in (Gi1, Gi2) to number of time
points and a\2= 1 ∩ \2= 1 denotes the probability that the discretized expressions of Gi1 and Gi2 are both equal to 1 at
the same time point in sequence pair (Gi1, Gi2). Similarly
a\2= 1 denotes the probability that the discretized expression of Gi2 in sequence pair (Gi2, Gi1) is 1 i.e. it is the
ratio of number of 1’s of Gi2 in (Gi2, Gi1).
Table 3 is the example to illustrate the formulae. In Table 3, probability P (Gene1=1) = 2/11.In this way we can find every term of the formulae and then finally the R-value of every candidate gene pairs. Having calculated the R values of all the gene pairs, the fitness value of the candidate GRN with n gene pairs can be calculated according to :
Fitness function = Trimmed mean (max(R(Gi1,Gi2),R(Gi2,Gi1))) for i = 1, 2, 3, 4, …., n
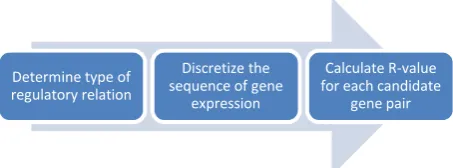
[image:4.595.54.305.72.206.2]In the proposed work, trimmed mean is used as the fitness function instead of arithmetic mean to remove the effects of outliers. To calculate the trimmed mean of the R values of a candidate GRN, we discard the first and the last 5% of the R values before calculating the fitness value. In Figure 3 shows all steps to find the fitness value of candidate gene pairs.
Figure 3. Steps to find the fitness value of candidate gene pairs
The calculated fitness values are introduced in genetic algorithm (GA) to optimize them where different operations are carried out such as elitist strategy, selection, crossover and mutation. First, the elitist strategy is used to ensure that the fitness value of the best chromosome in the next generation would not be less than that of the current generation. Second, the selection operation is used to select chromosomes with better fitness values to form the new population of the current generation. Third, single point crossover and uniform mutation operations are performed on the new population to generate the next generation.
Step 4. Repeat the genetic algorithm (GA)
The genetic algorithm (GA) is repeated to find the different candidate gene pairs which have the fittest value of all candidate gene pairs. Repeating the genetic algorithm (GA) prevents it from trapping into local optimum and helps to find important gene pairs as it would occur more frequently in the set of candidate gene pairs, we choose these genes pairs to predict the final GRN. The direction of regulatory relation between two genes (G1 and G2) in the final GRN is determined
using TDMI and TDCLR.
Step 5. Performance evaluation
In this step, the performance of TDCLR with the proposed method i.e. TDCLR using GA/PSO is compared. The performance is evaluated using two parameters: sensitivity and specificity. Sensitivity and specificity can be calculated using the given formulas:
cQVB = QIQV ℎQ UQ dQ QEUeGUUQG UQIGQI QIQV
c QGdG
= UQIGQI QIQV ℎQ U VQI 6QℎIGUUQG UQIGQI QIQV
4.
EXPERIMENTS AND RESULTS
4.1
Dataset
In this paper, the performance of our proposed method is tested by taking the microarray dataset of Saccharomyces cerevisiae from an online database Saccharomyces Genome Database. The approach is used to predict the sub network of GRN of yeast. The sub network contains 5 genes with 5 regulators (edges). To predict the GRN of sub network, the expressions of the genes which appear in the corresponding sub-network is chosen from S. cerevisiae dataset. In the proposed work 313 experimental time points for each gene is considered.
4.2
Performance measure
Here we have considered sensitivity and specificity as two performance measures for our proposed approach.
4.3
Analysis and performance comparison
In this section we report the performance of our proposed method. Since the sub network contains 5 genes given as {CLB5; BCK2; CDH1; CLB2; CLB1} so the size of candidate gene pair is 10 which is represented in the Table given below:Determine type of regulatory relation
Discretize the sequence of gene
expression
Calculate R-value for each candidate
[image:4.595.57.284.484.568.2]Table 4. Candidate gene pairs of 5 genes
GENE PAIR ID GENE 1 GENE 2
1 CLB5 BCK2
2 CLB5 CDH1
3 CLB5 CLB2
4 CLB5 CLB1
5 BCK2 CDH1
6 BCK2 CLB2
7 BCK2 CLB1
8 CDH1 C
9 CDH1 CLB1
10 CLB2 CLB1
The output of the proposed method and that of TDCLR is Table shown below:
Table 5. Result Comparison of both methods
TDCLR PROPOSED METHOD
Sensitivity 2/5=0.40 4/5=0.8
Specificity 2/7=0.29 4/6=0.67
Figure 4. The performance measure graph of both methods
5.
CONCLUSION AND FUTURE SCOPES
Microarray technology is the most powerful technique for studying gene expressions in bioinformatics.
done, TDCLR is used which is based upon Mutual information approach is most useful for prediction of GRN which contain large number of genes. The important benefit
is that the information flow between the pairs of gene can be predicted and it also applies an adaptive background correction step to eliminate false connections and indirect influences which involved the computation of Z scores. Using TDCLR the type of regulatory relations between different pair of gene can be found. In the work done, proposed method is hybridised with PSO/GA with TDCLR which are used to check the fitness of every edge predicted by TDCLR. Where PSO is used for
0 0.1 0.2 0.3 0.4 0.5 0.6 0.7 0.8 SENSITIVITY SPECIFICITY
V
A
L
U
E
S
Candidate gene pairs of 5 genes
GENE 2 BCK2 CDH1 CLB2 CLB1 CDH1 CLB2 CLB1 CLB2 CLB1 CLB1
The output of the proposed method and that of TDCLR is
Result Comparison of both methods
PROPOSED METHOD 4/5=0.8 4/6=0.67
The performance measure graph of both methods
AND FUTURE SCOPES
Microarray technology is the most powerful technique for studying gene expressions in bioinformatics. In the work is used which is based upon Mutual information approach is most useful for prediction of GRN which contain large number of genes. The important benefits of using TDCLR is that the information flow between the pairs of gene can be ies an adaptive background correction step to eliminate false connections and indirect influences . Using TDCLR the between different pair of gene can d method is hybridised /GA with TDCLR which are used to check the fitness of every edge predicted by TDCLR. Where PSO is used fordiscretization of gene expression and GA is used to find the optimal solution for given R values of all candidate gen in the proposed method. Repeating the GA helps it from trapping into local optimum and it helps to find important gene pair as it would occur more frequently in the set of candidate gene pairs.The results shows that, by taking PSO and GA into consideration, the proposed method TDCLR using PSO and GA method is better than the TDCLR in terms of the predicting sensitivity and specificity. To further improve the accuracy of the proposed method, this issue needs to be addressed in the future studies as the proposed method require computation and is time consuming.
many times the GA is to be repeated can be considered effects of the size of time-series microarray expression data in terms of the number of time-points ca
6.
REFERENCES
[1] S.P. Li, J.J. Tseng, S.C. Wang, Reconstructing gene regulatory networks from time
Physica A 350 (2005) 63–69.
[2] Harri Lahdesmaki, Sampsa Hautaniemi , Ilya Shmulevich ,Olli Yli-Harja “Relationships between probabilistic Boolean networks and dynamic Bayesian networks as models of gene regulatory networks”
[3] Raed I. Hamed, S. I. Ahson, R. Parveen “A New Approach for Modelling Gene Regulatory Networks Using Fuzzy Petri Nets” Journal of Integrative Bioinformatics, 7(1):113, 2010.
[4] Akther Shermin, Mehmet A.Orun” Using Dynamic Bayesian Networks to Infer Gene Regulatory Networks from Expression Profiles”acm 2009.
[5] R. Eriksson, B. Olsson, Adapting genetic regulatory models by genetic programming, Biosystems 76 (2004) 217–227
[6] R. Linden, A. Bhaya, Evolving fuzzy rules to model gene expression, Biosystems
[7] Wentian Li” Mutual Information Functions Versus Correlation Functions” Journal of Statistical Physics, 60(5-6):823-837 (1990)
[8] Vijender Chaitankar, Preetam Ghosh, et al. “sCoIn: A Scoring algorithm based on COmplex INteractions for reverse engineering regulatory networks” Proceedings of the 2012 IEEE 12th International Conference on Bioinformatics & Bioengineering (BIBE), Larnaca, Cyprus, 11-13 November 2012
[9] Yao Fu , Laura R Jarboe and Julie A Dickerson “Reconstructing genome-wide regulatory network Of E. coliusing transcriptome data and predicted transcription factor activities” BMC Bioinformatics 2011,12:233
[10] Seung-Hyun Jin, Peter Lin, and Mark Hallett” Linear and nonlinear information flow based on time delayed mutual information method and its application to corticomuscular interaction” Clin Neurophysiol. 2010 March ; 121(3): 392. doi:10.1016/j.clinph.2009.09.033
[11] Kaletaet al. “Integrative inference of gene
networks in Escherichia coli using information theoretic concepts and sequence analysis” BMC Systems Biology2010,4:116
[12] Patrick E. Meyer et al. “Information
of Gene Networks Using Backward Elimination PROPOSED
METHOD
TDCLR
discretization of gene expression and GA is used to find the optimal solution for given R values of all candidate gene pairs Repeating the GA helps it from trapping into local optimum and it helps to find important gene would occur more frequently in the set of candidate that, by taking PSO and GA into ideration, the proposed method TDCLR using PSO and GA method is better than the TDCLR in terms of the predicting sensitivity and specificity. To further improve the accuracy of the proposed method, this issue needs to be addressed in the he proposed method requires high computation and is time consuming. In future studies, how many times the GA is to be repeated can be considered and the series microarray expression data in
points can be addressed.
S.P. Li, J.J. Tseng, S.C. Wang, Reconstructing gene regulatory networks from time-series microarray data,
69.
Harri Lahdesmaki, Sampsa Hautaniemi , Ilya Shmulevich “Relationships between probabilistic Boolean networks and dynamic Bayesian networks as models of gene regulatory networks”Science Direct 2006.
Raed I. Hamed, S. I. Ahson, R. Parveen “A New Approach for Modelling Gene Regulatory Networks Nets” Journal of Integrative Bioinformatics, 7(1):113, 2010.
Akther Shermin, Mehmet A.Orun” Using Dynamic Bayesian Networks to Infer Gene Regulatory Networks from Expression Profiles”acm 2009.
R. Eriksson, B. Olsson, Adapting genetic regulatory enetic programming, Biosystems 76 (2004)
R. Linden, A. Bhaya, Evolving fuzzy rules to model gene
Wentian Li” Mutual Information Functions Versus Correlation Functions” Journal of Statistical Physics,
jender Chaitankar, Preetam Ghosh, et al. “sCoIn: A Scoring algorithm based on COmplex INteractions for reverse engineering regulatory networks” Proceedings of the 2012 IEEE 12th International Conference on Bioinformatics & Bioengineering (BIBE), Larnaca,
13 November 2012
Yao Fu , Laura R Jarboe and Julie A Dickerson wide regulatory network Of E. coliusing transcriptome data and predicted transcription factor activities” BMC Bioinformatics 2011,12:233
in, and Mark Hallett” Linear and nonlinear information flow based on time delayed mutual information method and its application to corticomuscular interaction” Clin Neurophysiol. 2010 March ; 121(3): 392. doi:10.1016/j.clinph.2009.09.033
grative inference of gene-regulatory networks in Escherichia coli using information theoretic concepts and sequence analysis” BMC Systems
International Journal of Computer Applications (0975 – 8887) Volume 83 – No 12, December 2013
[13] Nagwan M. Abdel Samee, Nahed H. Solouma , Yasser M. Kadah “Gene Network Construction and Pathways Analysis for High Throughput Microarrays” 29th National Radio Science Conference (NRSC 2012)
[14] Vijender Chaitankar et al. “Gene Regulatory Network Inference Using Time Lagged Context Likelihood of Relatedness” 2011 IEEE
[15] Ioan Cristian Trelea “The particle swarm optimization algorithm: convergence analysis and parameter selection” Information Processing Letters 85 (2003) 317–325 2002 Elsevier Science
[16] Riccardo Poli, James Kennedy, Tim Blackwell ” Particle swarm optimization: An overview” Swarm Intell (2007) 1: 33–57 DOI 10.1007/s11721-007-0002-0
[17] Chien-Pang Lee, Yungho Leu, Wei-Ning Yang “Constructing gene regulatory networks from microarray data using GA/PSO with DTW” Applied Soft Computing 12 (2012) 1115–1124, 2011 Elsevier.