Control of Urban Water Systems using SCADA System
Kousik Maity
Dept. Of E.C.E. Bengal Institute of Technology
WBUT
Sk . Ekram Ali
Dept. of I.T, Techno India College of
Technology, WBUT
Purnendu Chakraborty
Dept of E.C.E Future Institute of Engg. &
Management WBUT
Bidisha Goswami
Dept of E.C.E Future Institute of Engg. &
Management WBUT
Arkodyti Sarkar,
Dept of C.S.E
Bengal Institute of Technology WBUT
ABSTRACT
Effective ground water management often requires models that can accurately predict system responses simultaneously and due to urban areas where population is increasing rapidly the water supply system should be more effective manner. In this paper we propose a SCADA base complete water supply system. By simulation it is shown that it is more effective than other system.
Keywords
Scada, Pressure detector,Sensor, Valves.
1.
INTRODUCTION
Water networks are generally consist of a large number of interconnected pipes, reservoirs, pumps, valves and other hydraulic elements which carry water to demand nodes from the supply areas, with specific pressure levels to provide a good service to consumers. The hydraulic elements in a network may be classified into two categories: active and passive. The active elements are those which can be operated to control the flow of the water and the pressure of water in specific parts of the network, such as pumps, valves and turbines. The pipes and reservoirs are passive elements, insofar as they receive the effects of the operation of the active elements, in terms of pressure and flow, but they cannot be directly acted upon.
A supervisory control system in a water network generally includes a telemetry system which periodically updates some information from a selected set of passive elements and from most of (ideally all) the active elements. This information is generally composed of pressure and flow readings, as well as status of the active elements, and it reflects the instantaneous operating condition of the water network. It also includes the mechanisms to actuate the active elements in the network and to control their performance. However, it is not always obvious how to derive appropriate control strategies for the active elements, in order to use the resources efficiently and to meet the specific pressure and flow needs in the
whole network, at all times. Optimal control in water networks deals with the problem of generating control strategies ahead of time, to guarantee a good service in the network, while achieving certain performance goals, which may include one or more of the following, according to the needs of a specific utility:
1. minimization of supply and pumping costs,
2.maximization of water quality, pressure regulation for leak prevention, etc.
The implementation of optimization procedures may prove an extremely efficient measure to contribute to the correct management of water resources and to reduce operational costs, as well as to improve the service to consumers. this paper, the concepts of control in water networks are presented in Sections 1 and 2. Sections 3.
2. REALATED WORK
Water distribution systems are usually operated on the basis of pressure, flow rate, tank water levels, or combinations of the above. For an operator to know if he or she is operating the system in an acceptable manner, the parameters or indexes that form the basis of operations need to be measured. Accordingly, in many systems, instruments and equipment are used to measure, record, and store system wide pressures, flows, and tank water levels. Other quantities, such as pump vibration or motor temperature, also can be measured, but they typically do not factor directly into system operations as it relates to an acceptable level of service.
In the United States, flow measurements are generally taken at only a few selected locations, including water treatment plants, pump stations, and boundaries with other systems. Some systems do not even record plant and pump-station discharges. Like flow, pressures also are recorded at a few key locations, usually at pump stations. In addition, pressures may be recorded at the highest and lowest elevations within the system or at sites within a pressure zone to determine the lowest and highest pressures in the system. Almost all water systems in the United States record tank water levels. Many European systems, on the other hand, take pressure and flow rate measurements throughout the entire system. In Paris, for example, pressures and flows are measured at more than 30 locations, (Gagnon and Bowen, 1996). Not only can comprehensive system wide measurements assist in system operations, but these data can be used to help calibrate computer models of hydraulics and water quality in a distribution system.
measurements are in the form of pressure, flow, or tank water levels. If a system operator notices that a quantity, such as pressure, is not within acceptable limits, appropriate action is taken to remedy the situation.
However, consider that the system may have four or five pressure zones and that each pressure zone may have multiple storage tanks or multiple pumping stations. Also consider that the zones may be hydraulically connected so that actions taken in one pressure zone may have an effect on other zones. Finally, consider that water system operations are inherently time-dependent and one may quickly agree that although the operations of a water distribution system appear to be simple, they can require a great deal of skill, especially if a system is large and complex. Water distribution systems can be operated either manually or automatically. Many small systems in the United States have been operated automatically for years. Typically, operations are based on tank water levels. For example, a liquid-level switch senses the water level in a water storage tank. Field instrumentation sends a signal to a controller that will either turn a pump on or off, depending on the water level in the tank. Larger systems, because of their higher degree of complexity, normally have human operators whose primary function is to monitor the pulse of the system and initiate actions based on system behavior. The criteria that the operator uses to indicate whether the system is operating
properly largely depends on what is measured throughout the system. Put another way, for many systems in the United States, the quantities that factor directly into operator decision-making will be measured.
Control Strategies
Several methods of controlling water distribution systems are available, each representing an increasing level of automation. The American [1][2]Water Works Association Research Foundation (AWWARF) supported a study for water treatment facilities that identified three levels of control (Younkin and Huntley, 1996). The three levels of control also can be adapted to water distribution systems, as described in the following sections.
1. Supervisory control.
Many water utilities in the United States are operated today by supervisory control. A human operator monitors the behavior of the water distribution system 24 h a day, 7 days a week to make certain the system is operating properly.
2 .Automatic control.
This type of control represents the case where instrumentation and control equipment are used to control the distribution system automatically. Such control can be implemented either locally at the facility or throughout the system. Typically, simple operating rules are used to determine which component is operated and how it is operated. An example of automatic control described earlier is the use of liquid-level switches in tanks to control a pump's on/off status.
Coincident with automatic control is the idea of unattended operations. As the name implies, unattended operations have no human operator on duty. Smaller systems have used unattended operations for some time. In these cases, the on/off status of a pump usually is controlled by the water level in a storage tank. Because of their relatively simple nature, unattended operations seemed to be the natural way to operate small systems.Automatic control is not limited to unattended
automatically. In these cases, automatic control generally describes the use of computers and control logic to run the system while human operators remain on standby.
3 .Advanced control
Systems that rely on advanced control use optimization algorithms, decision support systems, artificial intelligence, or control logic to control the distribution system. Usually, the methodologies used to develop control logic are much more complex and sophisticated than are those used in automatic control. advanced control and automatic control can be combined with one another, with the advanced-control algorithms supplying operating rules and the automatic-control features implementing the rules. Given the capabilities of today's computer and control technology, a number of water utilities are investigating the possibility of completely automated and advanced control. Advanced control can reduce operating costs even further through the use of optimized pumping or operating schemes.
3. PROPOSED WORK
In our propose SCADA base water supply system can control total system by itself autonomously & effective manner.
Features of system
1.supervise the hole process in a single control room.
2.Total system has high efficiency and cost effective.
3.Imidiate action in fault detector and proper treatment.
3.1 On-line optimal control
3.1.1 Inputs from the network
In a supervisory control system for a water network, the optimal control procedure interacts with the real network through the SCADA (Supervisory Control and Data Acquisition) system. It must receive information about the current state of the network, in terms of water volumes in reservoirs, the status of pumps and valves, latest demand readings, pressure and flow readings at selected points. In order to compute optimal control strategies ahead of time, the optimal control procedure must contain a prediction model to generate forecasts of the next future demands, based on a record of a number of past values thereof. A number of methods for demand prediction may be used as described elsewhere (Quevedo, Cembrano,GutieHrrez & Valls, 1988; Grin8oH , 1991).[3][4] In this work, the demand prediction model was obtained using the Fuzzy Inductive Reasoning Methodology, as described in LoH pez, Cembrano and Cellier (1996). The demand information [5][6]from the SCADA is used to update the past-demand record and a forecast of the demand in the next period is performed. The demand forecasts are usually obtained with a horizon of the order of one day. The hourly data is obtained by modulation with appropriate demand patterns for each day in the week.
3.1.2. Optimization execution
involves the generation of controller strategies over a time period, called the optimization horizon, which may be of the order of one day, at hourly intervals, for a common case of water distribution utility.
3.1.3. Outputs to the remote units
The optimal control values are sent through the SCADA as set points to the local controllers in the remote stations that regulate the active elements. Optimization updates must be performed regularly during the day.
3.2 WORKING PRIENCIPLE
The SCADA base water supply system have Some important part and those are pump station, Reservoir station, main control station, sub control station , master station, server room, pipe & sub pipeline & home supply management.
3.2.1. Tank and pump station
Water tank is the container of store water that can be ready to supply to the city. This water tank should keep in such a height so that the speed and pressure of water is sufficient to reach topmost of a large building.
In the tank there are two sensor. Those sensor detect the water level and transient the data to the main master station and main control station. The main control station automatically start the pump when the water level is very low. The pump station taking the power supply from the main control station and start signal from the control station, start the pump And flow the water from the reservoir to the tank.
3.2.2. Reservoir system
In this station at first water are filtered and store in the larger area Then taken to the water tank sufficiently & quantify as per requirement.
In this reservoir a pressure detector and a sensor are attached. Those the use to detect the water level and the amount of water then those data are sent to the master station via substation through telemetry media.
3.2.3.Main control station
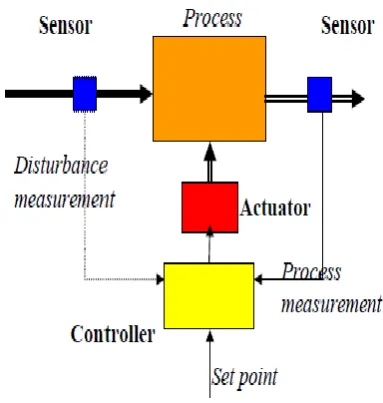
The main control of water supply can take place in this station .From the water tank the water is come in this station via a tank pipe and then distributed many main supply pipe, those pipe are divided by some valve and those valve are control by the master station via communication media server, and micro controller based system in the main control station.
[image:3.595.317.509.135.337.2]The pressure detector are place in beside the valve, those check the pressure and transit the data through substation to master station.
Fig 1:- Working diagram of main control station
In every main supply pipe starting point each has a water meter those meter are measure the amount of water that supply through the master station.
3.Sub control and transmission station
Sub control station is a kind of autonomous control station to the distribution system. the main fundamental process in the sub control station are control by programmable microcontroller. Any kind of distribution problem detection and solved is the task of this station .If any kind of leakage in the pipe is discover by the sub control system, it quickly close the conjegutive valve of the pipe. the sub transmission system are attach to the sub control station that receive data from the pressure detector in the pipe by water meter. Then the data transmitted to the master station via server .So this station work is divided in to two part, those are
1. Action and maintenance.
Fig 2:- Flowchat of the master station
Master station
The master station is the brain of the total control system. The master station has more number of control section and penal. Through the control panel it observe the hole processing of the system and control the system if any problem occur in the system then master station solve the problem.
The master station receiving the data from the server of all presser detector, all water meter and water level detector of reservoir, taking the hole data, the data are analysis and check whether any fault occur in the system .if any fault detect through analysis ,the master station take right action to solve the problem. In the master station many of expert engine are there to analysis the data and every time check out the hole system. In this way the whole process are control by the master station.
Home supply management
In the home water supply system the main home or domestic pipeline come in the home and enter in to a divider. In divider there are many water type lines connected for different location in the home. From those different type lines are supply water in different location of the home. In the top of the control switch there is a another switch ,this switch is use to prevent the waste water .when for 1 hours water patch is open then after 1 hour the switch is automatically closed unless anyone want to continue the flow of water. To continue water flow he have to press the switch and water again flow.
A additional control box is attach to divider and a program microcontroller system is attached in it. In home many place fire detector sensor is there and continuously a pipe is filled to it. When any kind of the big fire is breakout in the home then the fire sensor is detected the fire and through the microcontroller it solve the problem according the central instruction.
Actuators in urban wastewater systems include:
1.pumps(axial or screw) with constant or variable speed;
2.gates (sluice, radial or sliding) which restrict the flow in a sewer or at the outlet of a detention tank; they are usually activated by motors and used for generate in-line storage or for diverting flows into other parts of the system;
3.weirs (transverse, side spill) which can either be static structures, for example, to reduce overflow discharges over a combined sewer overflows, or which can be moveable and
adequately positioned in order to generate storage volume (Campisano et al., 2000, 2001).Inflatable dams can be used in large trunk sewers to activate in-line storage;
4.valves are used to restrict flows in pressure pipes;
5.other actuators, such as movable air-controlled siphons used for storage, and movable flow splitters which separate flow into two ore more paths.
6.chemical dosing devices that adjust the conditions in the tanks to achieve a certain performance, e.g. supply of readily biodegradable COD to enhance denitrification, injection of acid/base to control pH, addition of polymer or ballasting particles to enhance settling offlocs;
7.aeration devicesare an essential and very cost-determining part of most of the wastewater treatment plants. Oxygen is indeed necessary for some of the important biological pollutant removal processes, e.g. nitrification. Many different types exist with the more cost-effective ones being the fine bubble aeration systems.
Mathematics Model:-
Calculation sub pipeline cross section
If the total pressure of main line is P and velocity of water is V, and the pressure of sub pipeline are P1,P2,P3…..Pn respectively and the velocity of the sub pipeline are V1,V2,V3…Vn respectively.
Then , P+(1/2)*d*V2 = (p1+1/2*d*V1 2
) +(p2+1/2*d*V2 2
)+……+(Pn+1/2*d*Vn2 )
d= Density of water (= 1).
V= velocity of the water in the main pipe.
Now when one pipe line divided in two sub pipe line, then
p1+1/2*d*V12 = p2+1/2*d*V22 ; ……… (1)
And the amount of water flow through the sub pipe per second is ,Q= A1 * V1 ;
If we assume all sub pipe are same cross sectional area then,
P + (1/2)*d*V2 = (N*P1 + 1/2*N*d*V12 )
= N*(P1 + 1/2*d*V12 ) ; ……….(2)
From that equation we know P& V, then keeping P1 in a sweetable and safety and then V1 can be calculated. Now the
water flow in one second at that pipe is
Qs=As*Vsp ; ………(3)
Vsp =water velocity of sub pipe line.
As= cross sectional area of sub pipeline.
Qs= water flow through sub pipe per second.
Now if we assume one sub pipe line is connected to n number of House and VH liter in average in one second. then the total
water required for one sub line for one second duration is
Qst = n * VH ; ……….(4)
Now the cross section area of the sub pipe line will be As.
Then,
Pi * As2 * Vsp = n* VH ;
As2 = n*VH/(pi * Vsp) ;
As = squrt (n*VH/(pi*Vsp)); ………..(4)
Now let assume N no of sub pipe line are connected to a single main pipe line.
Vm= velocity of main pipe line.
Pm= pressure of main pipe line.
Am= cross section area of main pipeline.
So N*(As * Vsp) = Am*Vm ;
So the water supply per second through one main pipe line.
Qm = Am * Vm; ……….(5)
Now ,the cross section area of the main pipe line is,
(Am) 2
*pi*Vm = N*As*Vsp ;
Am = squrt ((N*As*Vsp)/pi*Vm) ;
Again, As= squrt (( N*VH/pi*Vsp) ;
So. Am = squrt((N*squrt((N*VH/pi*Vsp)*Vsp) )/pi*Vm) ;
So the cross section area of the main pipe is
Am = squrt(N*squrt(n*VH*Vsp)/(pi*squrt(pi)*Vm) ) ; ……….(6)
Now if M number of main pipe line are connect to main control station so in one section water flow from tank
QT= M*( Am * Vm );….. (7)
[where QT= water flow In one second from the tank.
Vm= velocity in one second through the main pipe line]
Tank size Calculation
If VH liter water required for one home in one second
(Average).
Then water flow from tank will be
QT = m *(Am * Vm).
Suppose in one day 4 time the tank will be fill up.So the tank will design in such way that the tank store the water for 6 hours supply.
So total water for 6 hours
= QT * 6*3600;
If the height of the tank is H,and it’s cross section area of the tank = A,Then
Pi *A2*H = QT * 6*3600
Pi *A2*H = m*(Am * Vm )*6*3600
A = squrt((m*Am*Vm*6*3600)/H2) ……..(8)
So the
cross section area of the tank is = squrt((m*Am*Vm*6*3600)/H2
).
4. S
IMULATION
R
ESULTS
In order to evaluate the performance of the water supply using SCADA system The comparison done in between Rasistance of the pipe due to surface tension to Distance from the main supply. The simulation results were run on MATLAB 7.8 in a designed virtual environment.
Fig- 3 Simulation results of how the Resistance of the pipe increase due to surface tension
Fig 4: Total water control system using SCADA system
5. CONCLUSIONS
Control in water networks is an efficient means of scheduling water transfer operations to achieve management goals, such as cost minimization, quality improvement, pressure regulation, etc. So far, only very few water utilities have incorporated optimal control procedures in their supervision systems. The optimal control module described in this paper is applicable to a broad class of water networks and incorporates a number of improvements over previous optimization applications.
6. REFERENCES
[1] Bechmann, H. (1999). Modelling of Wastewater systems. PhD thesis. Technical University of Denmark. Lyngby
[2] Beck, M.B. (1987). Water quality modeling: A review of the analysis of uncertainty. Wat. Res. Res., 23, 1393-1442.
[3] Butler, D., Lau, J., and Schütze, M. (submitted). Is combined sewer overflow spill frequenc/volume a good indicator of receiving water quality impact? submitted to Urban Water.
[4] Butler, D., and Schütze, M. (2001). Integrating simulation models with a view to optimal control of urban wastewater systems. Workshop on Vulnerability of
Making the case for High-performance integrated control. Athens, Georgia, USA. 14 -16 May 2001.
[5] Berry, J. W., Fleischer, L., Hart, W. E., Phillips, C. A., and Watson, J. P.2005_. “Sensor placement in municipal water networks.” J. Water Resour. Plann. Manage., 131_3_, 237–243.
[6] Boccelli, D. L., Tryby, M. E., Uber, J. G., Rossman, L. A., Zierolf, M. L., and Polycarpou, M. M. _1998_. “Optimal scheduling of booster disinfection in water distribution systems.” J. Water Resour. Plann. Manage.,124_2_, 99–111. Ding, W. and Marchionini, G. 1997 A Study on Video Browsing Strategies. Technical Report. University of Maryland at College Park.
7. A
UTHORS
PROFILE
Kousik Maity,currently pursuing B.Tech in Electronics & Communication Engineering at Bengal Institute of Technology under West Bengal University of Technology. His research interest includes robotics & wireless Communication.
Purnendu Chakraboty, currently pursuing B.Tech in Electronics & Communication Engineering at Future Institute of Engineering & Management under West Bengal University of Technology. His research interest includes robotics & wireless Communication.
Bidisha Goswami, currently pursuing B.Tech in Electronics & Communication Engineering at Future Institute
of Engineering & Management under West Bengal University of Technology. Her research interest includes robotics & wireless Communication.
Sk . Ekram Ali, is presently an employee of TCS. He has completed his B.Tech in I.T at Techno India College of
Technology under West Bengal University of Technology. His research interest includes robotics & artificial intelligence.