Lossless Compression of Medical Images using
Multiresolution Polynomial Approximation Model
Ghadah Al-Khafaji,
Ph.D Dept. of Computer Science,Baghdad University, College of Science.
Haider Al-Mahmood
Dept. of Computer Science,Al-Mustansiriya University, College of Science.
ABSTRACT
In this paper, a simple fast lossless image compression method is introduced for compressing medical images, it is based on integrates multiresolution coding along with polynomial approximation of linear based to decompose image signal followed by efficient coding. The test results indicate that the suggested method can lead to promising performance due to flexibility in overcoming the limitations or restrictions of the model order length and extra overhead information required compared to traditional predictive coding techniques.
General Terms
Multiresolution and polynomial approximation within high synthetic coding architecture for lossless image compression.
Keywords
Medical images, lossless image compression, multiresolution coding and polynomial representation.
1.
INTRODUCTION
Medical imaging it also known as diagnostic imaging lie at the heart of healthcare. Various medical digital images available either in 2D or 3D forms depending on the application such as magnetic resonance (MR), ultrasound (US), computerized tomography (CT), nuclear medicine (NM), positron emission tomography (PET), digital subtraction angiography (DSA) and X-rays images. Today the 2D medical imaging dominates the use due to its simplicity, lowest cost and resolution efficiency, but unfortunately comes with large number of bits required. Reducing the medical image size would allow much more effective use of space (storage) and/or time which represent the core of lossless image compression type that characterized by preserving the information; where the image can be reconstructed exactly as the original in which no information is lost. Generally, it is possible to do lossless compression with techniques such as Huffman coding, Arithmetic coding, Lempel-Ziv, Differential Pulse Code Modulation and Multiresolution techniques; but most of these methods leads to limited compression rate results. Reviews of medical image compression techniques can be found in [1]-[7].
Multiresolution similar to pyramids techniques [8] utilized efficiently for medical image compression due to its simplicity, higher compression rates, fast and easy to implement [9]-[11]. Its implementation is generally composed of two basic steps filtering and decimation (i.e., sub-sampling)
traditional means of predictive coding, and multi-resolution predictive coding versus other lossless techniques, on a number of medical images. The multiresolution predictive coding techniques, in spite of its proven effectiveness, still affected by the modelling order and formula utilized (i.e., number of neighbours and the dependency form of causal/acausal with 1D or 2-D structure), coefficient estimation techniques (i.e., linear/nonlinear) and also the need to code the seed pixel values that represent the heavy load that strongly decreases the compression rate. Efforts have been devoted by a number of researchers that have exploited the polynomial approximation representation technique to compress images [16,17] to overcome seed problems, along with improving the compression rates where there is no need to code the overhead information compared to the traditional predictive coding techniques.
In this paper, a simple and fast lossless method for compressing medical images is introduced that based on exploited the multiresolution for obtains images of different frequencies, and utilized first order polynomial representation to remove the redundancy between neighbouring pixels that efficiently improve compression rate. The rest of the paper is organized as follows, section 2 contains comprehensive clarification of the proposed system; the results of the proposed system is given in section 3.
2.
THE PROPOSED SYSTEM
The main concerns in the proposed system are:
Get the benefit of multiresolution techniques of wavelet transforms that characterized by high image quality with high compression ratios, due to exploits both the spatial and frequency correlation of data by contractions and translations of mother wavelet on the input data, supports the multi-resolution analysis of data and symmetric nature.
By incorporating the linear polynomial representation to remove the spatial redundancy embedded on the approximation band (LL) of the second layered multiwavelet that corresponds to low resolution image which contains low variation part of the image data that significantly increase the efficiency of the compression rates.
Run length coding is used to efficiently compress the coded information along with Huffman coding.
Step 2: Perform multi-wavelet transforms that decompose image into two layers, in other words in the first layer the image decomposed into approximation and detail sub bands (LL1, LH1, HL1 and HH1) which corresponds to medium
resolution image each of size (N/2×N/2), only the approximation sub-band (LL1) of the first layer is exploited as
an input to create the second layer that also decomposed into approximation and detail sub bands (LL2, LH2, HL2and HH2)
which corresponds to low resolution image each of size (N/4×N/4).
Step 3: Partition the low level approximation sub-band (LL2)
into nonoverlapping blocks of fixed size n×n, and performs the polynomial representation according to equations (1,2,3) [16].
1 0 1 0 20 (, )...(1)
1 n i n j j i LL n n a ) 2 ...( ) ( ) ( ) , ( 1 0 1 0 2 1 0 1 0 2 1
n i n j c n i c n j x j x j j i LL a ) 3 ...( ) ( ) ( ) , ( 1 0 1 0 2 1 0 1 0 2 2
n i n j c n i c n j y i y i j i LL aWhere LL2(i,j) is the low resolution approximation sub-band
of original image block of size (n×n) and ) 4 ...( ... ... 2 1 yc n xc
Step 4: Create the approximated or predicted image value 2
~
L L
of low resolution using the estimated polynomial coefficients for each block representation:
) 5 )...( ( ) ( ~ 2 1 0
2 a a j xc a i yc
L
L
Step 5: Find the residual or prediction error as difference between the original low resolution approximation sub-band
(LL2) and the predicted one 2
~ L L . ) 6 )...( , ( ~ ) , ( ) ,
(i j LL2i j LL2 i j
R
Step 6: Apply entropy encoder on the compressed information using run length code which is passed through Huffman coding to remove the rest of redundancy. The coded information composed of the residual image values that characterized by less correlation with smaller variance than the original pixel values, and with highly packing information around the zero. In addition to polynomial coefficients (a0,a1,a2) and the details sub bands of first and second layers
(LH1, HL1, HH1, LH2, HL2 and HH2).
To reconstruct the decompressed image all the above mentioned steps are reversed as shown in Figure 2, where the decoder exploits the information received from the encoder to reconstruct the low resolution approximation subband image (LL2), by first utilizing the polynomial coefficients to build a
predicted approximated subband image, and then adding the residual to the prediction, such that:
) 7 )...( , ( ~ ) , ( ) , ( 2
2i j Ri j LL i j
LL
The low resolution level that represent the last or bottom layered in terms of reconstructed approximation subband (LL2) and detailed sub bands coded information (LH2, HL2
and HH2) exploited to build or construct the approximation
subband of up-sequence layer (LL1) that corresponds to
medium approximation resolution subband. Finally, all the medium resolution sub bands utilized to reconstruct the compressed or high resolution decoded image I. The process is worked in reverse to build or construct the up-sequence layer, using the subsequent layer where each down-layered information is used to build the consecutive up-layer information.
3.
EXPERIMENTS AND RESULTS
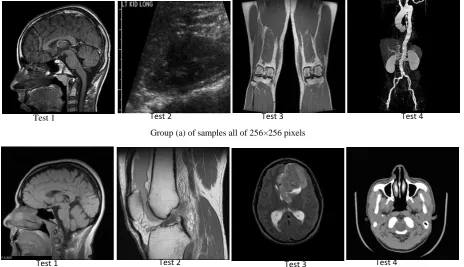
Experiments were performed to test the system performance on a number of medical images of different types (see Figure 3 for an over view), all the images are gray of 256 gray levels (8 bits/pixel) with two sizes either 256×256 pixels or 512×512 pixels.
The compression ratio, which is the ratio of the original image size to the compressed size, was adopted as a packing measure. Since, there is no degradation need to be evaluated in lossless compression where the decoded compressed image is identical to the original image, so the only guide here to the efficiency of proposed system is compression efficiency. The total compressed size information is given by:
TCS=[no. bits for coding the low residual image R(i,j)+ no. bits for coding the coefficients (a0,a1,a2)+ no. bits for coding the low detail sub bands (LH2, HL2 and HH2)+ no. bits for coding the medium detail sub bands(LH1, HL1, HH1)] …….…(8)
The results shown in Tables 1 and 2, illustrates that the high compression rate is attained of the proposed system due to utilization of effective multiresolution along with the efficient linear polynomial model of three coefficients (a0,a1,a2) in
which no need to extra information to be used like seed values (i.e., sometimes referred to as overhead information or side information) compared to the traditional predictive coding method. It is clear that the compression rate generally varies according to the block size, where a small block size has large number of coefficients with small residual, and as the block size gets bigger the coefficient highly decreased versus no or small slightly change in residual size, since utilization of only the approximation subband of low-frequency domain of low variation information. Implicitly meaning that the compression rate is directly affected by coefficients size compared to residual size. Also the result illustrates that the size of low and medium resolution detail sub bands represent the consumption of bytes compared to the polynomial part. Lastly, the techniques does not suffering from the blocking effects as the block gets bigger, which differs from other compression techniques due to dominating residual image.
4.
ACKNOWLEDGMENTS
Fig 1: Encoder structure of the proposed system
[image:3.595.103.463.83.331.2]
Fig 2: Decoder structure of the proposed system
Fig 3: Overview of the medical test images
Image
LL1 HL1
LH1 HH1
Polynomial approximation on LL2
Entropy Encoder Original Image
Apply 1st DWT on
the image Apply 2nd DWT on
the LL1 subband
LL2 HL2
LH2 HH2
Coefficients and residual part
Compressed information
Reconstruct approximation subband LL2
Reconstruct 2nd DWT sub bands
Compressed information
Entropy Decoder
LL2 HL2
LH2 HH2
LL1 HL1
LH1 HH1
LH1 HH1
Compressed Image Reconstruct 1st
DWT sub bands
Group (a) of samples all of 256×256 pixels
Test 1 Test 2 Test 3 Test 4
Test 1 Test 2 Test 3 Test 4
[image:3.595.63.528.364.631.2]Table 1: Compression performance of the proposed system of block size 4×4 on the tested medical image.
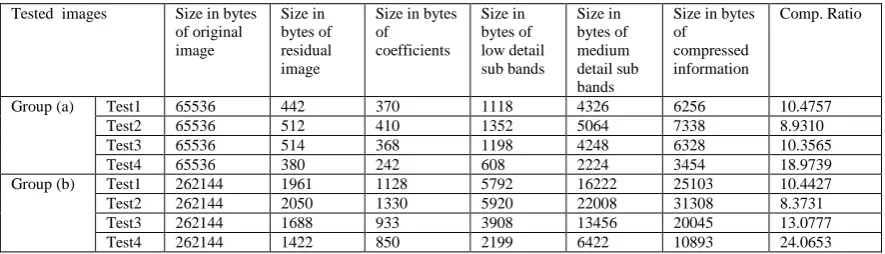
Table 2: Compression performance of the proposed system of block size 8×8 on the tested medical image.
Tested images Size in bytes
of original image
Size in bytes of residual image
Size in bytes of
coefficients
Size in bytes of low detail sub bands
Size in bytes of medium detail sub bands
Size in bytes of
compressed information
Comp. Ratio
Group (a) Test1 65536 438 1470 1118 4326 7352 8.9140
Test2 65536 508 1692 1352 5064 8616 7.6063
Test3 65536 512 1468 1198 4248 7426 8.8252
Test4 65536 380 956 608 2224 4168 15.7236
Group (b) Test1 262144 1950 4435 5792 16222 28399 9.2307
Test2 262144 2048 5312 5920 22008 35288 7.4287
Test3 262144 1680 3935 3908 13456 22979 11.4079
Test4 262144 1420 3182 2199 6422 13233 19.8248
Tested images Size in bytes of original image
Size in bytes of residual image
Size in bytes of
coefficients
Size in bytes of low detail sub bands
Size in bytes of medium detail sub bands
Size in bytes of
compressed information
Comp. Ratio
Group (a) Test1 65536 442 370 1118 4326 6256 10.4757
Test2 65536 512 410 1352 5064 7338 8.9310
Test3 65536 514 368 1198 4248 6328 10.3565
Test4 65536 380 242 608 2224 3454 18.9739
Group (b) Test1 262144 1961 1128 5792 16222 25103 10.4427
Test2 262144 2050 1330 5920 22008 31308 8.3731
Test3 262144 1688 933 3908 13456 20045 13.0777
5.
REFERENCES
[1] Bramble, J. M., Huang, H. K. and Murphy, M. D. 1988. Image Data Compression. Radiology, 23, 707-712.
[2] Wong, S., Zaremba, L., Gooden D. and Huang, H. K. 1995. Radiologic Image Compression – A Review. Proceedings of the IEEE, 83(2), 194-218.
[3] Shukla, J., Alwani, M. and Tiwari, A.K. 2010. A Survey on Lossless Image Compression Methods. International Conference on Computer Engineering and Technology (ICCET), 136-141.
[4] Bhavani, S. and Thanushkodi, K. 2010. A Survey on Coding Algorithms in Medical Image Compression. International Journal on Computer Science and Engineering (IJCSE), 2(5), 1429-1434.
[5] Ferni Ukrit, M., Umamageswari, A. and Suresh, G.R. 2011. A Survey on Lossless Compression for Medical Images. International Journal of Computer Applications (IJCA), 31(8), 47-50.
[6] Alagendran, B. and Manimurugan, S. 2012. A Survey on Various Medical Image Compression Techniques. International Journal of Soft Computing and Engineering (IJSCE), 2(1), 425-428.
[7] Venkatraman, B., Vaithiyanathan, V. and Karthikeyan, B. 2013. Review on Lossless Image Compression Techniques for Welding Radiographic Images. Research Journal of Applied Sciences, Engineering and Technology 5(1), 167-170.
[8] Burt, P. J. and Adelson, E. H. 1983. The Laplacian Pyramid as a Compact Image Code. IEEE Transactions on Communications, 31(4), 532-540.
[9] Bramble, J. M. 1989. Comparison of Information Preserving and Information-Losing Data-Compression Algorithms for CT Images. Radiology, 170, 543-455.
[10]Heer, V. K. and Reinfelder, H.E. 1990. A Comparison of Reversible Methods for Data Compression. SPIE Medical Imaging, 1233, 254-365.
[11]Viergever, M. A. and Roos, P. 1993. Hierarchical Interpolation. IEEE Engineering in Medicine and Biology Magazine, 12(1), 48- 55.
[12]Antonini M., Barlaud M., Mathieu P. and Daubechies I. 1992. Image Coding using Wavelet Transform. IEEE Trans. on Image Processing, 1(2), 205–220.
[13]Sadashivappa, G. and Ananda Babu, K., 2008. Performance Analysis of Image Coding Using Wavelets. International Journal of Computer Science and Network Security, 8(10), 144-151.
[14]Grigorios D. , Zervas N., Sklavos N. and Costas E. 2008. Design Techniques and Implementation of Low Power High-Throughput Discrete Wavelet Transform Tilters for JPEG 2000 Standard. WASET , International Journal of Signal Processing 4(1), 36-43.
[15]Das, M. and Burgett, S. 1993. Lossless Compression of Medical Images Using Two Dimensional Multiplicative Autoregressive Models. IEEE Transactions on Medical Imaging, 12(4), 721-726.
[16]George, L. E. and Sultan, B. 2011. Image Compression Based on Wavelet, Polynomial and Quadtree. Journal of Applied Computer Science & Mathematics, 11(5), 15-20.