Resources Allocation in Higher Education based on
System Dynamics and Genetic Algorithms
Sherif E. Hussein
Computer and Systems Department Mansoura University
Egypt
Mahmoud Abo El-Nasr
Minister of Education Egypt
ABSTRACT
Market economy simulation is used to understand economic phenomena and to analyze social systems. Simulation is also used as a method for conducting virtual experiments or to test hypotheses in the real market. System Dynamics simulation was used here in order to understand the relationships between different design factors that emerged in the behavior of the education quality model. Education quality control is considered a difficult task, as few policy-makers have adequate tools to aid their understanding of how various policy formulations affect this complex, socio-technical system. Thus, the model of each factor was kept simple and complexity arose from the interaction between those factors. The research also compared between normal quality management for budget distribution and optimized budget distribution and their effect on quality.
General Terms
Modeling, Simulation, Artificial Intelligence.
Keywords
Education quality, Total Quality Management, Supply Chain Management, System Dynamics, Genetic Algorithms.
1.
INTRODUCTION
The lack of an underlying structural model that can help in strategic planning can become a problem if one wants to go beyond the task of simply analyzing whether progress has been achieved and, instead, wishes to assess rewards or penalties on the basis of the outcomes. If targets are achieved, there is less of a problem (although one could wonder whether the targets were sufficiently ambitious). The problem is more serious if targets are not met and one has to consider imposing a penalty. If no explicit structural model had been developed, it is difficult to know whether the targets set were, in fact, achievable [1].
Quality management that varies greatly from the researchers’ point of view is focused not only on product/service quality, but also the means to achieve it. Quality management therefore uses quality assurance and control of processes as well as products to achieve more consistent quality. The research of Harris and Baggett classified quality management principles into three main principles. The first of them focused on the customer by improving the service quality through improving and training employees. The second principle concentrates on the employees themselves through improving their contribution to increase the education effectiveness. The third principle deals with the contracted service and aims to achieve the standards agreed upon [2]. Williams explained the necessity to have quantitative measures for performance. That can help the organization to measure how far is the achieved progress by applying the quality management program from the point of view of the provided service compared to the
service expected from customers. He believed that there are another two directions for the quality management. The first direction provides a tool for the management to increase the productivity and provide customer satisfaction while reducing the unnecessary expenses. The second direction provides a tool that can be used to improve the way we are doing our work [3]. While Mehralizadeh and Safaeemoghaddam considered quality as the quality from the point of view of customers especially in higher education [4]. As the product of the higher education institutes is not visible, the end product can not be analyzed or checked against defects. Thus, when customers are happy with the service provided from the education institute, the quality is acceptable.
To identify the impact of top management commitment on Total Quality Management (TQM) in education, Tribus discussed the core philosophy of customer focus and discussed the application of this concept to schools. He made a compelling case for the application of Total Quality Management to schools. As a result, many aspects of educational process are integrating the TQM philosophy to address concerns of all stakeholders about the quality of education [5].
On the other hand, Ardi et. al examined the emerging paradigm of TQM and summarized its implications for higher education. Rather than prescribing a set of generic implementation steps, they suggested that there are other, more significant, factors to be considered related to the timing of the initiative rather than where it should begin. They discussed four necessary issues: the removal of abstraction from the concept of quality in higher education; organization-wide understanding of the customer; the importance of assessing the current quality level; and the need for strategic quality planning. Also they cited classical organizational facets such as structure, culture, human resource management and leadership as being among the determinants of TQM success. Concentration on these key matters attenuates the importance of the method of implementation. They argued that to disregard these harbingers of success is to risk long term damage to the organization and considerably reduce the likelihood of sustained and self generating organizational improvement [6].
While SWOT analysis is a tool for current situational analysis, there is a drawback because it is weak in traceability. It is weak because in the search process till the problem is found, you can only trace what is left behind from discussions [7].
The impact of EQC is far-reaching, impacting the regional economy, environment, and society through many interactions. The effect of a policy meant to improve one aspect of education quality is not always known a priori, and the interactions of that policy with other policies are seldom understood well. Additionally, there are not always clearly-defined objectives that all policy planners use as described by Abukari and Corner [8]. Thus, the goal in this research was to develop a proof-of-concept model of the EQC, extended to include the different resources and utilities of the education institute, which can be analyzed to provide insight to policy-makers by comparing the relative effectiveness and interactions across policies. Once the model was developed and tested, a system optimization was performed. So, this paper aimed to better understand the interactions and behaviors of the effect of the resources distribution on the total quality achieved, and to understand and quantify tradeoffs that must be made when choosing a final policy to be implemented.
2.
SUPPLY CHAIN MANAGEMENT
One of the classical business problems is supply chain management. The purpose of supply chain management is to provide the right quantity of the right product at the right time to the right customers at an optimal cost. The performance of supply chain management has become more important in modern manufacturing and business processes. Recent advances in technology, especially in information technology and widespread usage of web-based systems, are changing strategies of how companies manage their operations, supply change structures and strategic alliances [9]. Today, many companies exploit new technologies and strategies to improve their supply chain operations. Moreover, collaboration and exchanging information through the near real-time networks have also changed the way companies carry their inventories and manage their production plans. However, some of the new strategic policies may cause unexpected and undesirable consequences [10].
The performance of supply chain management directly affects the organization's overall performance. For the past several years, supply chain management has been a growing concern in modern manufacturing and business processes because of the complexity of products and new technologies. A supply chain network by nature is a large and complex, engineering and management system. To understand its structure and to design effective policies, the internal dynamic behavior of the supply chain must be studied. On the other hand, system dynamics is an effective tool for understanding the structure and internal dynamic behavior of a large and complex system. For several decades, system dynamics has been used as a management tool for understanding real world behavior and implementing strategic policies. It is an approach for exploring the nonlinear dynamic behavior of a system and studying how the structure and parameters of the system lead to behavior patterns. Another fundamental purpose of system dynamics is to design effective and robust policies, which enhance performance in managed systems. Undoubtedly, poor policies can give poor performances and potentially
manages his inventories and resources [12]. System dynamics is therefore considered a powerful tool for studying the dynamics of the supply chain and its policy design. Supply chains involve multiple chains of stocks and flows. Three major characteristics of the supply chain are oscillation, amplification and phase lag. These behaviors frustrate people who manage supply chains and attempt to maintain the level of inventories. As these downstream stakeholders, such as customers and retailers, changes their orders, those upstream stakeholders, such as vendors and manufacturing, responds by balancing the rate of using their resources and the rate of production. These balancing policies are always controlled by negative feedback. With the time delays in the supply chains, such as lead-time in manufacturing, transportation delay and information delay, the systems are prone to oscillation. From that perspective, the research methodology used was to apply system dynamics on education quality supply chain problem to find optimized budget distribution that maximizes education quality.
3. MODEL IMPLEMENTATION
Simulation is a powerful tool used to study complex systems. It is the development of a model of a complex system and the experimental manipulation of that model to observe the results. The essence of constructing a model is to identify a small subset of characteristics or features that are sufficient to describe the behavior under investigation. So, a model is an abstraction of a real system; it is not the system itself. Therefore, there is a fine line between having too few characteristics to accurately describe the behavior of the system and having more characteristics than you need to accurately describe the system. The goal is to build the simplest model that describes the relevant behavior.
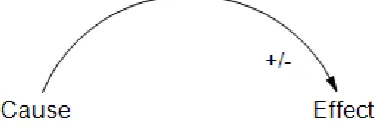
[image:2.595.335.527.584.649.2]System dynamics, created during the mid-1950s by Professor Jay Forrester, is considered a way of thinking about the future which focuses on ‘stocks’ and ‘flows’ within processes and the relationships between them [13]. The way in which real systems evolve over time is often bewilderingly complex. System dynamics enables us to tame that complexity, offering an explanation of why a system behaves as it does, and providing insights into the system’s likely behavior in the future. The key is to understand the chains of causality, the sequence and mutual interactions of the numerous individual cause-and-effect relationships that underlie the system of interest. These chains of causality are captured in a causal loop diagram (CLD), in which each cause and effect relationship is expressed by means of a link represented by a curly arrow as shown in Figure 1.
Fig. 1: Cause and effect relationship
must identify exactly what information is needed to ensure that one is on track to achieve the desired results. Third, there should be an on-going review of a program’s outcomes, comparing expected outcomes to actual outcomes and, if actual outcomes fell short of expected outcomes, why this occurred. The expected outcomes may not have been achieved because the planned policy actions were not carried out. Or it may be the case that the actions were carried out, but certain key parameter values were misestimated. If the actions were carried out and the key parameter values were, indeed, correct, it may be that the underlying structural model was incorrect and needs be reconsidered. With the system dynamics approach, the model is constantly being reconsidered and appropriate modifications and adjustments are expected in the course of one’s work [14].
As one can imagine, taking a more structural approach through system dynamics is much more intensive in the use of information and requires more work than with a reduced-form approach. Although collecting information and allocating the necessary human resources all involve significant burdens, there are certainly ways of reducing these information costs. For example, by identifying the key drivers of desired outcomes within a given system, one can focus efforts on generating the necessary data only for those particular areas. This also helps to reduce the financial costs of collecting information which can be considerable. In doing this, one can thus develop a work program which concentrates work efforts only in certain areas.
There are a number of modeling and simulation environments which provide some support for building system dynamics models and one of these is NetLogo which is a programmable modeling environment for simulating natural and social phenomena. It was authored by Uri Wilensky in 1999 and is in continuous development at the Centre for Connected Learning and Computer-Based Modeling [15]. NetLogo is particularly well suited for modeling complex systems developing over time. Besides being able to use the system dynamics tool integrated into the software, modelers can give instructions to hundreds or thousands of "agents" all operating independently. This makes it possible to explore the connection between the micro-level behavior of individuals and the macro-level patterns that emerge from the interaction of many individuals [16].
3.1 Model design
[image:3.595.328.528.84.348.2]CLD is considered the first step in system dynamics design and it enables complex systems to be described in terms of cause-and-effect relationships. CLD is a visual method of capturing the system complexity providing a powerful means of communication, and its use can ensure that as wide a community as you wish has a genuinely, and deeply, shared view. This is enormously valuable in building high-performing teams and can also help identify the wisest way of influencing the system of interest [17].
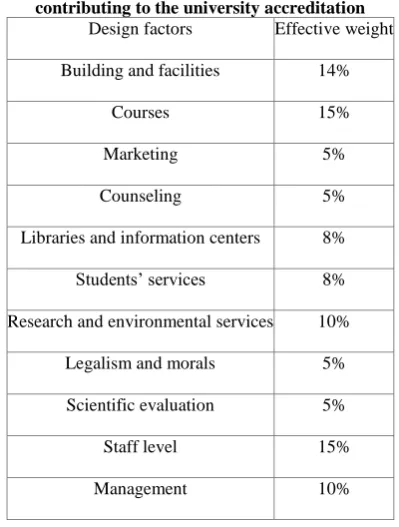
Table 1. The design factors along with their weights contributing to the university accreditation
Design factors Effective weight
Building and facilities 14%
Courses 15%
Marketing 5%
Counseling 5%
Libraries and information centers 8%
Students’ services 8%
Research and environmental services 10%
Legalism and morals 5%
Scientific evaluation 5%
Staff level 15%
Management 10%
All real systems are composed of interlinked networks of reinforcing loops and balancing loops, often in conjunction with a usually small number of dangles, which represent items that determine the boundary of the system of interest, such as the output of the system or the targets or goals that drive it. Compiling a good CLD for a real system requires deep knowledge of the system. It also encourages the explicit articulation of relationships that we all know are present but are rarely talked about, and the recognition of fuzzy variables, which are important but difficult to measure, such as the effect of having good staff on attracting and retaining customers. The original intent for the education quality model was to model large scale regional behavior and pin point the different factors that affect quality. Some of those factors are naturally the ones set by the standardization committees responsible for ranking the educational organizations. Other factors are equally important such as students and employees satisfaction and even they are not very tangible, they can definitely guide the optimization of budget distribution.
Costs in the quality requirements are attributed to salaries and expenses and include building and facilities, courses, marketing, counseling, libraries and information centers, students’ services, legalism and morals, research and environmental services, and scientific evaluation. The total budget is therefore the sum of these costs.
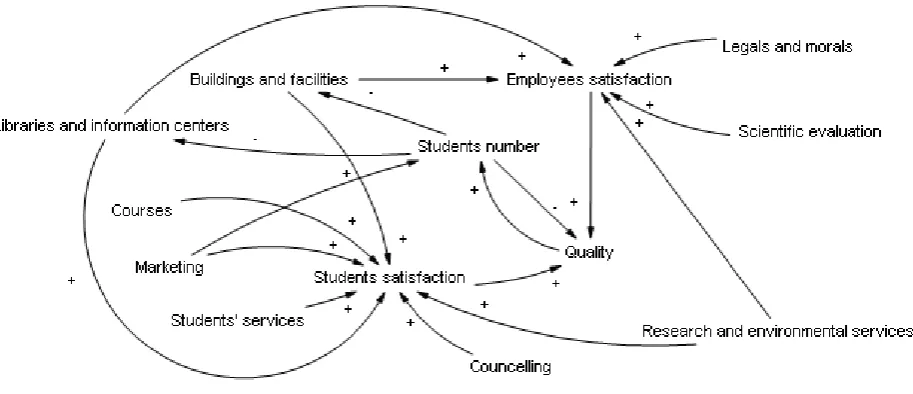
Fig. 2: Supply Chain Causal Loop Diagram for the education quality control model
The model based on a view of the EQC, Kennedy [19] and Hussein [20] has been represented and simplified in Figure 2. In this model, the main factors affecting quality are included for optimization. Quality is mainly affected by both students’ satisfaction and employee’s satisfaction. In addition, students’ number that join the institute can increase or decrease depending indirectly on the education quality. Both students’ satisfaction and employees’ satisfaction are affected by different factors that are improved and maintained by allocating suitable financial resources. The spending can be scheduled on a yearly basis to maximize the total quality of the institute and is based on the effective weight of each factor on quality improvement. As accreditation is considered another way of evaluating the institute performance, the accreditation criteria plays an important role of weighing the importance of the different institution spending. That spending need to keep the institution facilities within a certain value if not increased. In other words, if some facilities such as libraries and information centers are not improved consistently, they will be obsolete and decrease in value with time. The number of students affects as well the effective value of the libraries and information centers as its increase will definitely decrease their effective value. On the other hand, buildings can increase in market value when lands and building materials goes up. In that sense many institutes direct their initial attention toward buying lands that are suitable for future expansion. The diagram was designed in a way that combines students and employees satisfaction with the accreditation factors in order to improve the overall quality of the institute.
As can be seen from the view in Figure 2, the EQC model must encompass many factors in order to provide useful data to policy planners. In addition to the more apparent factors such as students’ satisfaction, employees’ satisfaction and policy planning, a good model must consider the regional economics, and environmental assessment. To address these
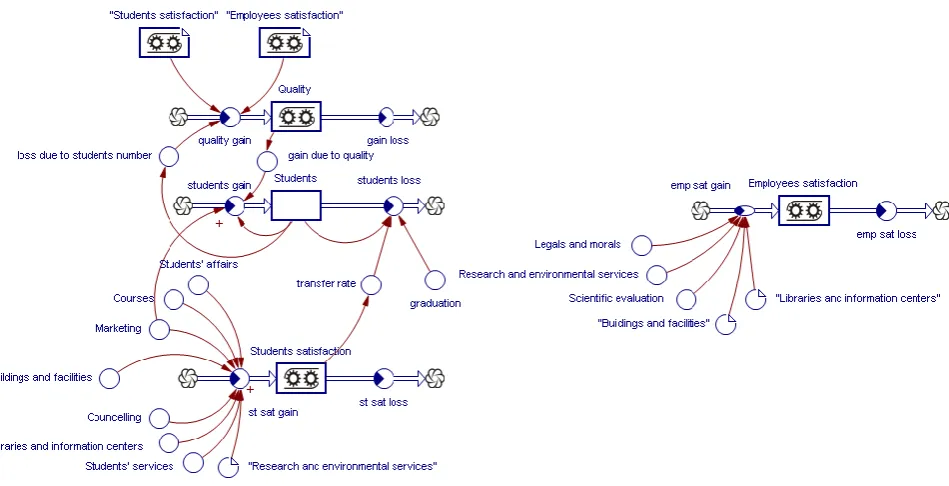
above has been implemented into the stock-flow diagram as shown in figure 3. At the highest level, there is a quality module that contains the direct factors that affect its values, such as students’ satisfaction, employees’ satisfaction, and students’ number. At a lower level, there are multiple modules that model a particular aspect such as the courses, marketing, buildings and facilities, counseling, libraries and information centers, students’ services, legal and morals, research and environmental services, and scientific evaluation with their effect on both the students’ satisfaction and the employees’ satisfaction while additional modules can be added if needed.
Quality, students’ satisfaction and employees’ satisfaction are all treated as conveyers while students’ number and the rest of the factors are treated as stocks. Stocks are accumulations. They collect whatever flows into them, net of whatever flows out of them. While in the conveyor, material gets on and rides for a period of time, and then gets off. The transit time can be either constant or variable. That selection was done to be close to the nature of the system as variables that need to keep track of previous values were modeled with stocks while variables that can change periodically independent on the previous values were modeled with conveyors.
Fig. 3: The stock flow diagram for the education quality control model
3.2 Model validation
[image:5.595.63.538.79.322.2]In order to verify the accuracy of the model, real data that cover three years has been used. That limited duration was chosen as the adoption of new techniques may require a special set of data that is difficult to obtain in a longer time frame. The model performance is the yearly estimated quality value derived using the EQC equations and the performance values are shown in Table 2 to illustrate the simulated results for the quality along with the real quality values achieved by the policy makers with traditional methods. It can be derived from the results that the trend of improvement for both the real and the estimated qualities are similar for the three simulated years. That in turns reflects the potential of the model to capture details that can be of great importance in the planning process.
Table 2. The estimated qualities of the model along with the real qualities
Estimated quality Real quality
Year 1 0.43 0.45
Year 2 0.48 0.51
Year 3 0.52 0.54
4.
EVOLUTIONARY COMPUTATION
AND MODEL OPTIMIZATION
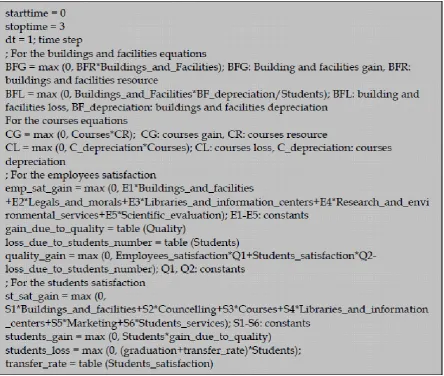
Fig. 4: Sample equations for the education quality model
4.1 Variables selection
The objective of this research is to optimize the model design factors (leverage points). That objective has been selected to reflect the task of EQC with long-term sustainability in mind: to maximize the quality of the institution as a function of the design vector calculated over a predetermined number of years.
The System Dynamics Modeler in NetLogo allows for drawing a diagram that defines "stocks" and “conveys”, and how they affect each other. The Modeler read the EQC diagram and generated the appropriate NetLogo code: global variables, procedures and reporters. The next step was to optimize the model using genetic algorithms on the proposed model. That was done by encoding each variable by a binary string with an arbitrary size chosen to be 12 bits. After a series of genetic operators to maximize the quality of each year over three years; the best value for each variable can be found. Genetic algorithm is then implemented in the NetLogo environment to search for a quasi optimal solution (best budget distribution over a period of three years) that increases the model quality. The genetic algorithms implemented here works by generating a random population of solutions to a
The design vector represents the spending on each design factor that in turns affect the education quality. The relationship between each design variable and the corresponding design factor is based on an estimated formula that was derived from either statistical or economical evaluation for the true values of the utilities.
The design vector which is composed of the nine variables that contribute to improve the nine design factors, as explained earlier in Table 1, has been constrained to have a total greater or equal to zero and less than or equal to the total budget. Although the limits of the constraints are not necessarily realistic, they give the program the ability to cover all the possible solutions.
4.2 Optimization
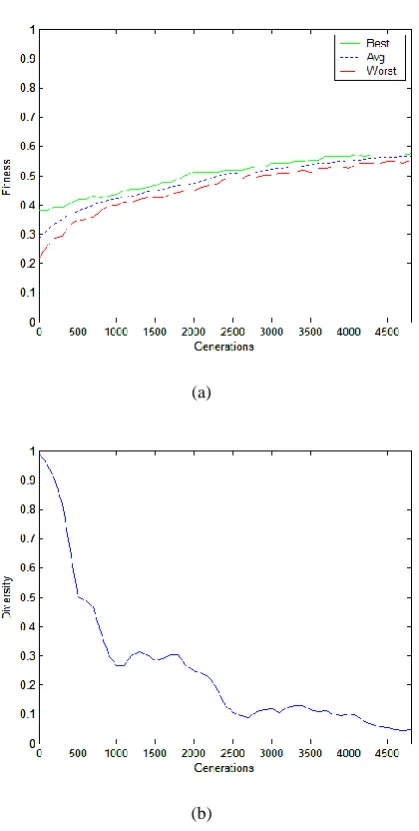
(a)
[image:7.595.66.276.91.507.2](b)
Fig. 5: Fitness (a) and diversity (b) curves for the optimization process
The first step was to randomly generate many individual solutions to form an initial population. The population size was of 300 possible solutions. During each successive generation, a proportion of the existing population was selected to breed a new generation. Individual solutions were selected through a fitness-based process, where fitter solutions were typically more likely to be selected. The used selection method, roulette wheel selection, rated the fitness of each solution, which was based on the average quality over the three years, and preferentially selected the best solution.
The next step was to generate a second generation from population of solutions selected through crossover, and mutation. For each new solution to be produced, a pair of "parent" solutions was selected for breeding from the pool selected previously. By producing a "child" solution using the above methods of crossover and mutation, a new solution was created which typically shared many of the characteristics of its "parents". New parents were selected for each child, and the process continued until a new population of solutions of appropriate size was generated. These processes ultimately resulted in the next generation population of chromosomes
that was different from the initial generation. This generational process was repeated until a termination condition had been reached; the highest ranking solution's fitness had reached a plateau such that successive iterations no longer produced better results as shown in Figure 5.a.
Diversity was measured using the Hamming distance which is the number of positions at which the corresponding symbols are different between the bit strings representing each structure (i.e. the number of bits which do not match). Thus at the start of the search the space was sampled over a relatively coarse ``grid,'' and as the search progressed, the grid size was gradually reduced until adjacent points were considered as shown in Figure 5.b. Table 3 shows how the optimization technique could improve the quality of the institution compared to the estimated quality found from the model using traditional techniques over the selected years of simulation.
Table 3. Optimized qualities against estimated qualities from the model
Estimated quality Optimized quality
Year 1 0.43 0.53
Year 2 0.48 0.57
Year 3 0.52 0.61
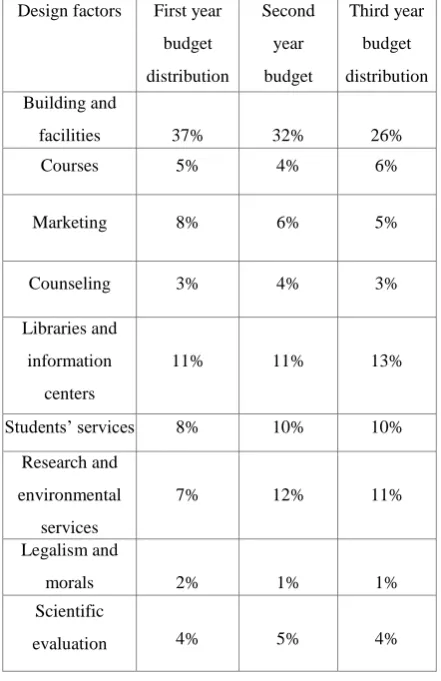
The best solution is therefore, the best budget distribution over the three years period and aims to give the organization managers an indication for the priority of spending in order to better utilize their resources and provide the best affordable quality of education. Table 4 summarizes the best possible budget distribution which depends on the initial resources of the institution and their financial budgets over the years.
5.
DISCUSSION AND CONCLUSION
Education quality is a massive challenge since it deals with the human being. Industrial products are finished goods while education has no such finished product. Accordingly, quality of education has been seen with reference to excellence in education, value addition in education, fitness of educational outcome and experience for use, conformance of education output to planed goals, specifications and requirements, defect avoidance in education process and meeting or exceeding customer’s expectation of education. Commitment to quality makes student proud to learn and work hardly for improvement. Quality improvement is a never ending process. Education quality leads to a prospective future. Hence, insight on quality indices and virtual implementation need to be given top priority and due attention should be paid to the category in the wide range of educational strata e.g. school, university, educational management, and the staff. In all fields, especially education quality has an important matter. Total Quality Management as a necessary element always has a direct influence on the human improvement. It can be also led to high commitment and sprit in work environment. Managerial and decision makers in education should be encouraged towards positive aspect of TQM and to take active participation to render quality education.
[image:7.595.313.543.263.383.2]for different techniques to be utilized. The modular design also allows for an evolutionary model that can change to capture additional influential factors.
The modeling of the system itself, before to be used in optimizing the budget distribution, needed a great involvement in the design of the model from different parties to achieve advanced levels of prediction. That involvement proves more useful for the policy makers and helps to integrate them with system formulation and interrelated causalities.
[image:8.595.57.278.355.696.2]This research provided as well a comparison between normal quality management for budget distribution and optimized budget distribution and their effect on quality. For comparison reasons, it was important to use realistic values which were obtained from traditional management methods and compare the results with the estimated values for quality. Contrary to SWOT analysis and TOWS matrix, system dynamics could offer current and future analysis, causal relationship between variables, and quantitative measures. The proposed model can give an idea to the quality management planers of what the outcome can be if they changed the leverage points of the EQC system and how to optimize the solution to achieve maximum education quality.
Table 4. Optimized resources distribution proposed for the three years duration
Design factors First year
budget
distribution
Second
year
budget
distribution
Third year
budget
distribution Building and
facilities 37% 32% 26%
Courses 5% 4% 6%
Marketing 8% 6% 5%
Counseling 3% 4% 3%
Libraries and
information
centers
11% 11% 13%
Students’ services 8% 10% 10%
Research and
environmental
services
7% 12% 11%
Legalism and
morals 2% 1% 1%
Scientific
evaluation 4% 5% 4%
6.
REFERENCES
[1] Atilgan, C., & McCullen, P. (2011). Improving supply chain performance through auditing: a change management perspective. Supply Chain Management: An International Journal, 16, 11 – 19.
[2] Harris, J.W., & Baggett, J.M. (1992). Quality Quest in the Academic Process, Samford University, Birmingham, AL, and GOAL/QPC, Methuen, MA.
[3] Williams, P. (1993). Total quality management: some thoughts. Higher Education, 25, No. 3, 373-5.
[4] Mehralizadeh, Y., & Safaeemoghaddam, M. (2010). The applicability of quality management systems and models to higher education: A new perspective. The TQM Journal, 22, 175 – 187.
[5] Tribus, M. (1986). TQM in education: the theory and how to put it to work, in Quality Goes to School. Readings on Quality Management in Education, American Association of School, 61, No. 5, 404-6.
[6] Ardi, R., Hidayatno, A.,& Zagloel, T. (2012). Investigating relationships among quality dimensions in higher education. Quality Assurance in Education , 20, 408 – 428.
[7] Schmidt, T. (2009). Strategic Project Management Made Simple: Practical Tools for Leaders and Teams, Wiley.
[8] Abukari, A., & Corner, T. (2010). Delivering higher education to meet local needs in a developing context: the quality dilemmas?. Quality Assurance in Education, 18, 191 – 208.
[9] Bai, C. , Sarkis, J. , Wei, X., & Koh, L. (2012). Evaluating ecological sustainable performance measures for supply chain management. Supply Chain Management: An International Journal, 17, 78 – 92.
[10]Rodney, W. T., Defee, C. C., Randall, W. S., & Williams, B. (2011). Assessing the managerial relevance of contemporary supply chain management research. International Journal of Physical Distribution & Logistics Management, 41, 655 – 667.
[11]Gazizova, A. (2012). From Turkey to Russia with love: a comparative study of higher education policy strategies in light of ongoing reforms. European Journal of Higher Education, 2, Issue 2-3, 198-204.
[12]Mayo, D. D., & Wichman, K. E. (2003). Tutorial on business and market modeling to aid strategic decision making: system dynamics in perspective and selecting appropriate analysis approaches, Proceedings of the 2003 Winter Simulation Conference, 2, Dec. 7-10, pp. 1569 – 1577.
[13]Forrester, J.W. (ed) (2004). MIT System Dynamics Group Literature Collection DVD, System Dynamics Society, Albany, NY, USA.
[16]Berkel, S. V., Turi, D., Pruteanu, A., & Dulman, S. (2012). Automatic discovery of algorithms for multi-agent systems. The Proceedings of the fourteenth international conference on Genetic and evolutionary computation conference companion, Philadelphia, Pennsylvania, USA. July 7-11, 337-344.
[17]Sherwood, D. (2002). Seeing the Forest for the Trees: A Manager's Guide to Applying Systems Thinking, Nicholas Brealey.
[18]Arab Organization for Quality Assurance in Education. (n. d.). Retrieved from http://www.arqaane.org
[19]Kennedy, M. (2009). A Review of System Dynamics Models of Educational Policy Issues. The 2009 International Conference of the System Dynamics Society. Albuquerque, NM.
[20]Hussein, S. (2010). Education Quality Control Based on System Dynamics and Evolutionary Computation, Modeling Simulation and Optimization - Focus on Applications, Shkelzen Cakaj (Ed.), InTech, DOI: 10.5772/8963.
[21]Floreano, D. (2008). Bio-Inspired Artificial Intelligence: Theories, Methods, and Technologies, The MIT Press.
[22]Barski, T. (2006). The Assurance of Quality of Education in Context the Higher Education Reforming Process (Bologna Process), Microwave & Telecommunication Technology, 16th International Crimean Conference, 1, 65 – 67.
[23]Coate L. E. (1991). Implementing total quality management in a university setting. Total Quality Management in Higher Education, New-Directions-for- Institutional- Research, 71, Autumn, 27-38.
[24]Kasperska, E., Mateja-Losa, E., & Slota, D. (2006). Comparison of Simulation and Optimization Possibilities for Languages: DYNAMO and COSMIC & COSMOS – on a Base of the Chosen Models, Springer Berlin / Heidelberg.
[25]Michael, R. K., & Sower, V. E. (1997). A comprehensive model for implementing total quality management in higher education. Benchmarking for Quality Management & Technology, 4, No. 2, 104-120.
[26]Motwani, J., & Kumar, A. (1997). The need for implementing total quality management in education. International Journal of Educational Management, 11, No. 3, 131–135.
[27]Producing Indicators of Institutional Quality in Ontario Universities and Colleges: Options for Producing, Managing and Displaying Comparative Data (Educational Policy Institute, July 2008).
[28]Pidd, M. (1994). An introduction to computer simulation, Proceedings of the 1994 Winter Simulation Conference, 7 – 14, Orlando, Florida, United States.
[29]Robert, G. S. (2007). Verification and validation of simulation models. Winter Simulation Conference 2007, 124-137.
[30]Shannon, R. E. (1998). Introduction to the art and science of simulation, Proceedings of the 1998 Winter Simulation Conference, 1, 7-14, USA.
[31]Taylor, W.A., & Hill, F.M. (1992). Implementing TQM in higher education. International Journal of Educational Management, 5, No. 5, 4-9.
[32]The Arab Administrative Development Organization. (30 Nov. 2012). Retrieved from http://www.arado.org.eg
[33]Tian, H. (2008). A New Resource Management and Scheduling Model in Grid Computing Based on a Hybrid Genetic Algorithm. International Colloquium on Computing, Communication, Control, and Management, 113-117.
[34]Learning and Computer-Based Modeling, Northwestern University. Evanston, IL.