Performance Evaluation of Improved Skew Detection
and Correction using FFT and Median Filtering
Neha Watts
Student, Department of CSE Giani Zail Singh, PTU CampusBathinda, India
Jyoti Rani
A.P, Department of CSE Giani Zail Singh, PTU CampusBathinda, India
ABSTRACT
This paper presents a new skew detection and correction technique using FFT & median filtering. It is found that there are many techniques based on skew correction which have been proposed so far by different researchers. It has been found that the most of existing techniques introduce artifacts while doing the skew correction. So to overcome this problem an integrated approach is presented in this research work. The proposed algorithm is planned and implemented in MATLAB using Image processing toolbox. To illustrate the algorithm 25 skewed images are taken for experimental purpose. The proposed algorithm has shown quite active results than previous techniques . The accuracy of the proposed algorithm is 99%.
General Terms
Skew detection, Fourier transformation,Hough transform, Cross-correlation, Moments.
Keywords
Optical character recognition (OCR) systems, Document analysis systems (DAS), BER.
1.
INTRODUCTION
Skew detection [1] – [20] plays an important role in vision applications. During scanning of documents, skew is certainly introduced into the incoming document.Skew denotes to the text which neither seems at right angles nor seems parallel to a specified line.Optical character recognition is very sensitive to the skewed page. Before layout analysis, skew detection and correction in document images play an important role. Skews in a document image can be divided into following categories, like Global Skew, assuming that image has the similar angle skew, Multiple-Skew, when certain area of the page have dissimilar diagonal , and Non- Uniform text line skew, when the slant swings (such as straight lines having a wavy form).While scanning , skew is certainly presented into the incoming document image. Skew detection is one of the major operations to be applied to scanned documents during converting into digital form. Its target is to align an image before processing because text segmentation and recognition methods require properly aligned next lines.
Most of the times, document analysis systems require prior skew detection and correction before the images are forwarded for character recognition, layout analysis, document image mosaicing and many other applications. An efficient and accurate method for determining document image skew is therefore an essential need. A number of methods have previously been proposed for identifying document image skew angles. However, most of the methods are designed mainly for machine printed documents. Many approaches of skew detection can process pure textual
document images successfully. But it is not an easy task process documents with large areas of non-textual contents.
Skew detection [1] – [20] is used for text line position determination in Digitized documents, automated page orientation, and skew angle detection for binary document images, in compensation for Internet audio applications and in the correction of scanned documents. The largest classes of methods for skew detection are based on projection profile analysis, nearest-neighbor clustering, Fourier- transformation, Hough transform, histogram analysis, moments and other methods. Rezaei et al. (2013) [1] has described a technique for skew detection. There are two steps for detecting the skew. The first step is dimension reduction; it is the process of decreasing the size of image pixels of features and finding another feature with lower dimensions. It includes transformation of initial set to other set for retaining maximum information. This will extract the initial set first and will generate missing information in it. After transformation, select an optimal subset of features based on an objective function. There are different dimension reduction methods, which we can use in skew detection of document images. In the second step, skew is estimated. Here, the deviation corresponding to the highest and the lowest value of the function is usually considered as the skew.
2.
SKEW DETECTION TECHNIQUES
2.1 Skew detection and correction using
nearest- neighbor
Hassan [2] has described that the document spectrum for page analysis based on the technique of bottom-up, nearest neighbour clustering of page components. This method does not depend on skew angle and give accurate results in case of multi-line and multi-column documents. This technique can be applied to an image containing sub regions of different document characteristics. Gregory et al. [3] has studied that a method for detecting skew based upon chain, in this the chains with a largest possible numbers of N-N pairs are selected, and their slopes are figured to give the skew angle of document images. It is also able to deal with different scripts and even different text orientations appearing on the same image. It is able to deal with documents of different scripts.
2.2 Skew detection and correction using
Moments
Ghosh et al. [5] has found that the primary axis of every object in the document rather than the Hough transform and handles angles. The object can be either halftone image or a text line. Lines are described using the chain code. The technique is based on the idea that in order to find the skew angle of a line, the line is considered as a solid object. The orientation of the object between the principal axis and horizontal axis gives an exact estimation of the skew angle. It is simple, and fast. Both multiple line skew and global skew can be detected, but the angle must be in the range of -30 degrees to +30 degrees.
Brodic et al. [6] has used the bounding boxes and inside the longest connected component, the gravity centres are determined for each bounding box. They signify the reference points, which are useful for the calculation of the initial skew rate. The comparative analysis of the origin and estimated skew rate is used to evaluate. It is suitable for multiline and multi-column without any segmentation. The technique shows the skew estimation accuracy for the document images in standard and low resolutions.
2.3 Skew detection and correction using
Hough transformation
Paunwala [7] has described that a new and fast approach for skew angle detection. It takes advantage of information found using the page orientation algorithm which is accomplished using local analysis. Skew angle detection is based on the processing of pixels of the last black runs of binary image objects. The non-textual data in a binary image constitutes the main source for the page orientation classification and the document skew angle faults. By dividing a binary image into squares in the page orientation case and using the bottom pixels of candidate objects in the skew angle case.Our system of algorithms is able to decrease the inclusion of non-textual data and thus to increase the detection accuracy rate.
Zahour et al. [8] has detected that the skew angle for different document images with high accuracy in case of bar codes, handwritten text, postal cards, technical articles, etc. The skew angle corresponds to the location of the highest peak in the Hough space. The algorithm is not dependent on algorithmic parameters and can detect the skew in the range of 0 to 180 degrees. Jeong et al. [9] has studied and proposed a fast skew estimation and correction algorithm for English and Korean documents based on a Block Adjacency Graph representation. This method uses a coarse /refine strategy based on Hough transformation of connected components in the image. Speed and accuracy has been achieved as this confine the region of interest to a small and plausible text area, and confine the search range of Hough transform to Q coarse skew angle.
Bhabatosh et al. [10] has considered some selected characters of the text which may be subjected to thinning and Hough transform to estimate skew angle accurately. The results show that it works well in case of different documents like Text-Book,English Documents, Journals. Different Languages and Document with different fonts, documents with different resolutions. This method is superior with respect to accuracy, computational time and suitability. But fail for document images containing text with picture. The method has two stages. In the first stage, selected characters from the document image are blocked and thinning is performed over the blocked region. In the second stage, the thinned
coordinates are fed to Hough transform (HT) to estimate the skew angle accurately.
2.4 Skew detection and correction using
Cross-correlation
Malemath [11] has described a robust yet fast algorithm for skew detection in binary document images. This does not need prior segmentation of the document into text and visuals regions. The maximum median of cross-correlation is used as the standard to find the skew, and a Monte Carlo sampling technique is chosen to determine the number of regions over which the correlation have to be calculated. This can be beneficial to different linguistic scripts. Basu et al. [12] has introduced a technique based on the information existing on a set of equidistant vertical lines. The text document consists mainly of horizontal text lines. This further chooses from all the image pixels those lying on a set of equidistant vertical lines.By taking pixels, on these vertical lines we construct a correlation matrix, which evaluates the angle of the skew with high accuracy. This gives good results in case of mixed type documents with accuracy and also requires very less computational time. Cao [13] has modified cross-correlation method uses horizontal and vertical cross-correlation simultaneously to deal with vertically placed text, which is normally used in Japanese or Chinese documents. Here, small randomly regions are selected to speed up the procedure. The area verification stage and further processing of auxiliary peaks make the method robust and reliable. Lu et al. [14] has described a new a skew angle estimation algorithm for binary document images based on (Fuzzy C-Regression models) clustering method with the aim to increase the accuracy rate of detecting the skew angle. It includes processes in it. Firstly, it analysis the image using run-length smoothing and black-white transition to produce parallel straight lines.
3.
LITERATURE SURVEY
Kumar et al. (2012)[15] has discussed that in optical character recognition and document image analysis skew is introduced in coming documented image. which lower the performance of OCR and image analysis system so to detection and correction of skew angle is important step of preprocessing of document analysis. There are many methods given by researchers for the detection of skew in binary image documents. Mostly are based on Projection profile, Fourier transform, cross-correlation, linear regression analysis, Hough transform, Nearest Neighbor connectivity, and mathematical morphology .
Singh et al. (2008) [16] has studied that the Hough transform provides a robust technique for skew detection in document images that face problem of high time complexity which becomes prohibitive for detecting skew in large documents. Time complexity analysis at several stages of skew detection process is carried out in this paper. A skew detection and correction process is divided into three parts: a preprocessing stage using a simplified form of block adjacency graph (BAG), voting process using the Hough transform and de-skewing the image using rotation.
are decomposed by the wavelet transform. The matrix covering the total values of the horizontal sub-band coefficients, which conserves the text’s horizontal structure, iis then pivoted through a scope of points. At each angle projection profile is computed and the angle that maximizes a standard function is regarded as the skew angle.
Yin (2001) [19] took a study and proved that the number of daily-received paper-based office documents is devastating, the development of document image analysis, that transforms the paper-based documents into automated forms.This paper defines a skew detection technique which first smoothes the black runs and locates the black–white transitions to emphasize the text lines and skew angle is determined by developed Hough transform. A rule-based classifier is presented for the block classification step, The classification rules are derived from run length analysis,the gray level entropy and block aspect ratio.
Kapoor et al. (2004) [20] have proposed two algorithms. The first one notices the skewing of words and the second corrects the skewing from handwritten words. Both algorithms follow procedure of the Radon transform based projection profile technique. The process does not need pre-processing as it works equally good with noise. This method is good. The algorithms have been tested on words taken from more than 200 writers and the results obtained confirm the overall accuracy of proposed system.
Egozi et al. (2011) [21] has presented a statistical approach to skew detection, in which distribution of textual features of document images is modeled as a mixture of straight lines in Gaussian noise. The Expectation Maximization (EM) algorithm is used to estimate the parameters of the statistical model and the estimated skew angle is extracted from the estimated parameters. Experiments show that our technique is favorably comparable to other existing methods in terms of accuracy and efficiency.
Shivakumara et al. (2006) [22] has shown that skew angle estimation is an important component of optical character recognition (OCR) systems and document analysis systems (DAS). A novel and an efficient method to estimate the skew angle of a scanned document image is proposed with two stages.
Makridis et al. (2010) [23] has proposed a new technique for global and local skew detection complex color documents. The proposed technique applied to grayscale and binary document that comprises of four phases as color reduction, text localization, text binarization and skew correction. Color reduction restrict the initial number of colors to a small number, commonly lesser than 10 colors.
Mascaro et al. (2010) [24] has shown that Skew correction of scanned documents is a crucial step for document recognition systems. Due to high computational problem costs of the state-of-the-art we present herein a variation of a parallelograms covering algorithm. This variation strongly decreases the computational time and works over noisy documents and documents containing handwritten components ,non-textual elements, like vertical bar and stamps.
4.
PROPOSED ALGORITHM
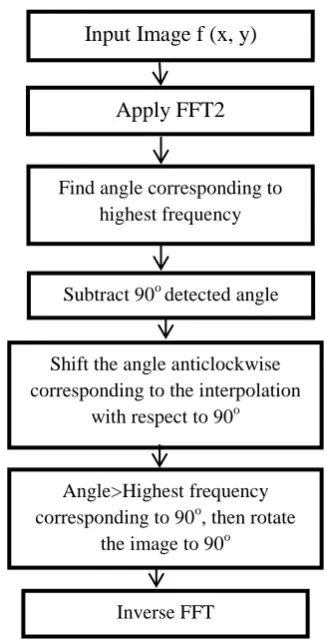
In order to reduce the computation time problem of the existing algorithms we have used DCT based compression and also merge it with the FFT based de-skewing algorithm to improve the speed of the de-skewing algorithm. Figure 1 is
showing the proposed algorithm. It consists the various steps required to accomplish the proposed work.
Following are the different steps required to correct the skewed images.
Step 1: Input an Image in 2D or 3D Plane. Step 2: Do preprocess it like RGB2GRAY.
Step 3: Find the Skewness angle by taking highest frequency of Fourier Transformation.
Step 4: Subtract 90o from the detected angle.
Step 5: Shift the angle anticlockwise corresponding to the interpolation with respect to 90o.
Step 6: If the calculated angle is highest frequency corresponding to 90o ,then rotate the image to 90o.
Step 7: Now, apply inverse FFT.
Figure 1: Proposed algorithm
5.
EXPERIMENTAL SETUP AND
RESULTS
[image:3.595.312.476.245.566.2]To verify the proposed algorithm we have taken a set of 50 scanned images with different size and also with different formats. These images are passed to the proposed algorithm one by one and based upon the results the accuracy is calculated. Whenever the input image is de-skewed correctly we call it as hit otherwise miss is calculated.
Figure 2 is showing the input image. It is clearly shown in the figure is that image is skewed by certain angle. It has been clearly shown that the image is skewed and it need to be de-skewed.
Input Image f (x, y)
f
Apply FFT2
Find angle corresponding to highest frequency
Subtract 90o detected angle
Shift the angle anticlockwise corresponding to the interpolation
with respect to 90o
Angle>Highest frequency corresponding to 90o, then rotate
the image to 90o
Figure 2 Input Image
Figure 3 has shown the four parts of skewed image which are clearly showing he input image is skewed by certain angle.
Figure 3 Four parts of the input image
[image:4.595.58.277.547.710.2]Figure 4 is demonstrating the four quadrants of an image to measure the angle of skewness. These quadrants give the angle from each of the quadrant and the mean of these quadrants are used to de-skew the given image.
Figure 4 Four quadrant of input image
Figure 5 has shown the final output of the de-skewed image. It is clearly shown that the angle of this image is 90 degree which is expected.
Figure 5 De-skewed image
6. PERFORMANCE ANALYSIS
Table 1 is showing the comparative analysis between the proposed and the existing technique. Recall in digital images retrieval is the fraction of the documents that are relevant to the query that are successfully retrieved. It lies between 0 - 1 or close to 1 means effective results. Table 1 has shown that the new technique is better than the existing as the recall value is more in the proposed algorithm and proposed has either 1 or close to 1 value ; thus proposed has shown quite effective results.
Table1: Recall evaluation
Image Name Old result New result
1 0.81129 0.99994
2 0.78422 1.00000
3 0.80031 1.00000
4 0.81800 1.00000
5 0.80143 1.00000
6 0.78355 1.00000
7 0.78422 1.00000
8 0.73307 1.00000
9 0.77842 1.00000
10 0.79177 1.00000
11 0.77846 1.00000
12 0.80721 0.93100
13 0.90209 0.93741
14 0.82240 0.94625
15 0.78194 1.00000
16 0.78707 1.00000
17 0.77571 0.93279
18 0.80595 1.00000
19 0.79216 1.00000
20 0.70648 1.00000
21 0.80200 1.00000
22 0.82777 1.00000
23 0.83838 1.00000
24 0.84664 1.00000
25 0.78444 1.00000
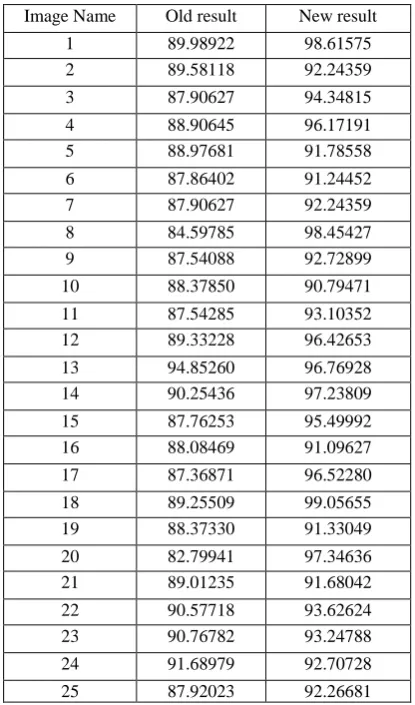
new technique is better than the existing as the value is more in the proposed algorithm; therefore proposed algorithm has shown fairly effective outcomes.
Table 2: F-Measure (%)
Image Name Old result New result
1 89.98922 98.61575
2 89.58118 92.24359
3 87.90627 94.34815
4 88.90645 96.17191
5 88.97681 91.78558
6 87.86402 91.24452
7 87.90627 92.24359
8 84.59785 98.45427
9 87.54088 92.72899
10 88.37850 90.79471
11 87.54285 93.10352
12 89.33228 96.42653
13 94.85260 96.76928
14 90.25436 97.23809
15 87.76253 95.49992
16 88.08469 91.09627
17 87.36871 96.52280
18 89.25509 99.05655
19 88.37330 91.33049
20 82.79941 97.34636
21 89.01235 91.68042
22 90.57718 93.62624
23 90.76782 93.24788
24 91.68979 92.70728
25 87.92023 92.26681
Table 3 is demonstrating the comparative analysis between the proposed and the existing technique.. Sensitivity (also called the true positive rate, or the recall rate in some fields) measures the proportion of actual positives which are correctly identified as such (e.g. the percentage of sick people who are correctly identified as having the condition). It needs to be increased. Table 3 has shown that the new technique is improved than the existing as the value is more in the proposed algorithm; therefore proposed algorithm has shown fairly effective outcomes.
Table3: Sensitivity
Image Name Old result New result
1 0.81129 0.99994
2 0.78422 1.00000
3 0.80031 1.00000
4 0.81800 1.00000
5 0.80143 1.00000
6 0.78355 1.00000
7 0.78422 1.00000
8 0.73307 1.00000
9 0.77842 1.00000
10 0.79177 1.00000
11 0.77846 1.00000
12 0.80721 0.93100
13 0.90209 0.93741
14 0.82240 0.94625
15 0.78194 1.00000
16 0.78707 1.00000
17 0.77571 0.93279
18 0.80595 1.00000
19 0.79216 1.00000
20 0.70648 1.00000
21 0.80200 1.00000
22 0.82777 1.00000
23 0.83838 1.00000
24 0.84664 1.00000
25 0.78444 1.00000
[image:5.595.63.271.132.485.2]Table 4 is representing the comparative analysis between the proposed and the existing technique with respect to the balanced classification rate. It is required to increase it. Table 4 has shown that the new technique has improved balanced classification rate than the existing as the value is more in the proposed algorithm; therefore proposed algorithm has shown fairly effective outcomes.
Table 4: BCR
Image Name Old result New result
1 0.90564 0.99901
2 0.89211 0.99559
3 0.90016 0.99723
4 0.90900 0.99479
5 0.90071 0.99489
6 0.89177 0.99589
7 0.89211 0.99559
8 0.86653 0.99923
9 0.88921 0.99644
10 0.89588 0.98049
11 0.88923 0.99683
12 0.90361 0.96550
13 0.95105 0.96870
14 0.91120 0.97312
15 0.89097 0.99095
16 0.89353 0.99600
17 0.88785 0.96640
18 0.90298 0.98499
19 0.89604 0.97929
20 0.85324 0.99929
21 0.90100 0.99169
22 0.91389 0.98526
23 0.91888 0.98237
24 0.92332 0.98903
[image:5.595.328.528.394.747.2]The balanced error rate is the average of the errors. Table 5 is demonstrating the comparative analysis between the proposed and the existing technique with respect to the BER. It is required to decrease it. Table 5 has shown that the new technique has minimum BER than the existing as the value is less in the proposed algorithm; therefore proposed algorithm has presented justly operative outcomes.
Table 5: BER (%)
Image Name Old result New result
1 9.43573 0.09937
2 10.78895 0.44098
3 9.98432 0.27669
4 9.09982 0.52066
5 9.92872 0.51081
6 10.82256 0.41056
7 10.78895 0.44098
8 13.34650 0.07740
9 11.07880 0.35595
10 10.41153 1.95082
11 11.07724 0.31672
12 9.63941 3.45018
13 4.89541 3.12961
14 8.88021 2.68767
15 10.90319 0.90512
16 10.64672 0.39997
17 11.21473 3.36036
18 9.70240 1.50089
19 10.39602 2.07112
20 14.67620 0.07083
21 9.89988 0.83080
22 8.61138 1.47384
23 8.11228 1.76327
24 7.66840 1.09694
25 10.77784 0.42329
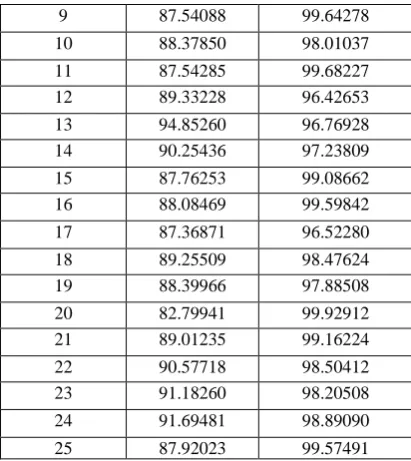
[image:6.595.324.533.71.301.2]In the fields of science, engineering, industry, and statistics, the accuracy of a measurement system is the degree of closeness of measurements of a quantity to that quantity's actual (true) value. Table 6 is demonstrating the comparative analysis of Accuracy between the proposed and the existing technique. Accuracy is statistical measures of the performance of a binary classification test Accuracy need to increase. Table 6 has shown that the new technique is improved than the existing as the value is more in the proposed algorithm; therefore proposed algorithm has shown fairly effective outcomes.
Table 6: Accuracy (%)
Image Name Old result New result
1 89.58118 99.90055
2 87.90627 99.55706
3 88.90827 99.72254
4 89.98922 99.47661
5 88.97681 99.48657
6 87.86402 99.58774
7 87.90627 99.55706
8 84.59785 99.92254
9 87.54088 99.64278
10 88.37850 98.01037
11 87.54285 99.68227
12 89.33228 96.42653
13 94.85260 96.76928
14 90.25436 97.23809
15 87.76253 99.08662
16 88.08469 99.59842
17 87.36871 96.52280
18 89.25509 98.47624
19 88.39966 97.88508
20 82.79941 99.92912
21 89.01235 99.16224
22 90.57718 98.50412
23 91.18260 98.20508
24 91.69481 98.89090
25 87.92023 99.57491
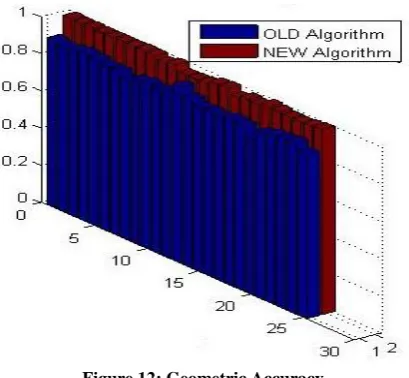
[image:6.595.64.272.154.513.2] [image:6.595.326.531.401.762.2]Table 7 is demonstrating the comparative analysis of Geometric Accuracy between the proposed and the existing technique. Geometric Accuracy is statistical measures of the performance of a binary classification test. Geometric Accuracy need to increase. Table 7 has shown that the new technique is improved than the existing as the value is more in the proposed algorithm; therefore proposed algorithm has shown fairly effective outcomes.
Table 7: Geometric Accuracy Image Name Old result New result
1 0.90071 0.99901
2 0.88556 0.99558
3 0.89460 0.99723
4 0.90444 0.99478
5 0.89522 0.99488
6 0.88518 0.99589
7 0.88556 0.99558
8 0.85620 0.99923
9 0.88228 0.99643
10 0.88981 0.98030
11 0.88230 0.99683
12 0.89845 0.96488
13 0.94979 0.96820
14 0.90686 0.97275
15 0.88427 0.99091
16 0.88717 0.99599
17 0.88074 0.96581
18 0.89775 0.98488
19 0.89000 0.97907
20 0.84052 0.99929
21 0.89555 0.99166
22 0.90982 0.98515
23 0.91534 0.98221
24 0.92013 0.98897
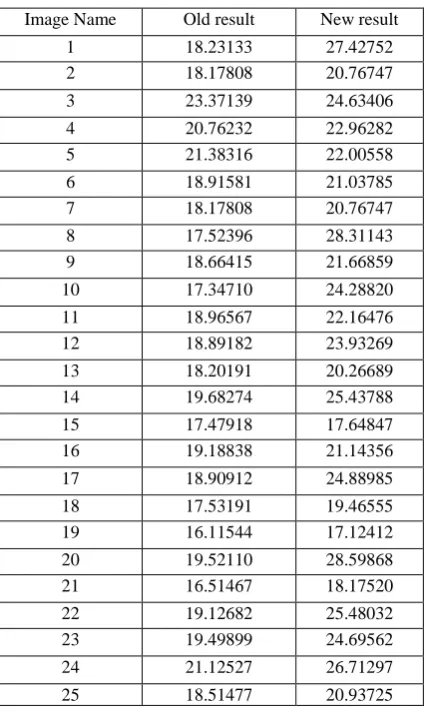
[image:6.595.64.271.638.769.2]Table 8 is showing the comparative analysis of the Peak Signal to Noise Ratio (PSNR). As PSNR need to be maximized; so the main goal is to increase the PSNR as much as possible. Table 3 has clearly shown that the PSNR is maximum in the case of the proposed algorithm therefore proposed algorithm is providing better results than the available methods.
Table 8: PSNR
Image Name Old result New result
1 18.23133 27.42752
2 18.17808 20.76747
3 23.37139 24.63406
4 20.76232 22.96282
5 21.38316 22.00558
6 18.91581 21.03785
7 18.17808 20.76747
8 17.52396 28.31143
9 18.66415 21.66859
10 17.34710 24.28820
11 18.96567 22.16476
12 18.89182 23.93269
13 18.20191 20.26689
14 19.68274 25.43788
15 17.47918 17.64847
16 19.18838 21.14356
17 18.90912 24.88985
18 17.53191 19.46555
19 16.11544 17.12412
20 19.52110 28.59868
21 16.51467 18.17520
22 19.12682 25.48032
23 19.49899 24.69562
24 21.12527 26.71297
25 18.51477 20.93725
Figure 6 is showing the comparative analysis between the proposed and the existing technique. Recall in digital images retrieval is the fraction of the documents that are relevant to the query that are successfully retrieved. It lies between 0 - 1 or close to 1 means effective results. Figure 6 has shown that the new technique is better than the existing as the recall value is more in the proposed algorithm and proposed has either 1 or close to 1 value ; thus proposed has shown quite effective results.
Figure 6: Recall evaluation
[image:7.595.61.274.163.520.2]Figure 7 is showing the comparative analysis between the proposed and the existing technique. A measure that combines precision and recall is the harmonic mean of precision and recall. It needs to be maximized. Figure 6 has shown that the new technique is better than the existing as the value is more in the proposed algorithm; therefore proposed algorithm has shown fairly effective outcomes.
Figure 7: F-Measure (%)
[image:7.595.323.533.379.557.2]Figure 8: Sensitivity
[image:8.595.323.529.71.273.2]Figure 9 is representing the comparative analysis between the proposed and the existing technique with respect to the balanced classification rate. It is required to increase it. Figure 9 has shown that the new technique has improved balanced classification rate than the existing as the value is more in the proposed algorithm; therefore proposed algorithm has shown fairly effective outcomes.
Figure 9: BCR
Figure 10 is demonstrating the comparative analysis between the proposed and the existing technique with respect to the BER. It is required to decrease it. Figure 10 has shown that the new technique has minimum BER than the existing as the value is less in the proposed algorithm; therefore proposed algorithm has presented justly operative outcomes.
Figure 10: BER (%)
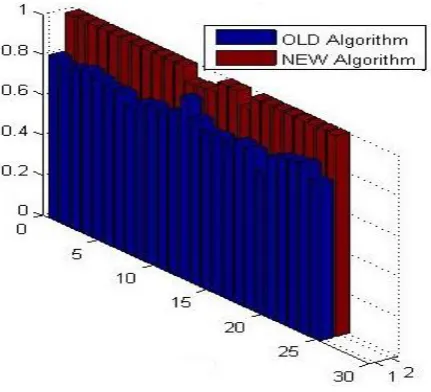
[image:8.595.327.540.375.586.2]Figure 11 is demonstrating the comparative analysis of Accuracy between the proposed and the existing technique. Accuracy is statistical measures of the performance of a binary classification test Accuracy need to increase. Figure 11 has shown that the new technique is improved than the existing as the value is more in the proposed algorithm; therefore proposed algorithm has shown fairly effective outcomes.
Figure 11: Accuracy (%)
[image:8.595.64.273.388.602.2]Figure 12: Geometric Accuracy
[image:9.595.61.275.351.534.2]Figure 13 is showing the comparative analysis of the Peak Signal to Noise Ratio (PSNR). As PSNR need to be maximized; so the main goal is to increase the PSNR as much as possible. Figure 8 has clearly shown that the PSNR is maximum in the case of the proposed algorithm therefore proposed algorithm is providing better results than the available methods.
Figure 13: PSNR
7. CONCLUSION
This research work has proposed a new skew detection and correction technique using FFT & median filtering. It has been originated that there are many procedures on skew correction which have been projected so far by different researchers. It has been originated that the most of existing methods comes up with the artifacts while doing the skew correction; so it is required to filter or restore the images. So to overcome this problem an integrated approach has been presented in this research work. The proposed algorithm has been designed and implemented in MATLAB using Image processing toolbox. To justify the algorithm 25 skewed images are taken for experimental purpose. The comparison has shown that the proposed algorithm has shown quite effective results. The accuracy of the proposed algorithm is 99%.
In near future this research work will be extended by integrating the skew correction technique with other filters. Fuzzy if then rules will also be used to improve the decision making for skew correction
8. REFERENCES
[1] Rezaei, Sepideh Barekat, Abdolhossein Sarrafzadeh, and Jamshid Shanbehzadeh. "Skew Detection of Scanned Document Images." In Proceedings of the International MultiConference of Engineers and Computer Scientists, vol. 1. 2013.
[2] Hassan, Tamir. User-guided information extraction from print-oriented documents. Diss. PhD thesis, Technische Universität Wien, 2010.
[3] Srihari, Sargur N., and Gregory Ball. "An assessment of Arabic handwriting recognition technology." In Guide to OCR for Arabic Scripts, pp. 3-34. Springer London, 2012.
[4] Kapogiannopoulos, George, and Nicholas Kalouptsidis. "A fast high precision algorithm for the estimation of skew angle using moments." Proceedings of Signal Processing, Pattern Recognition, and Applications– SPPRA’02, Crete, Greece (2002): 275-279.
[5] Ghosh, Debanjan, Raj Sharman, H. Raghav Rao, and Shambhu Upadhyaya. "Self-healing systems—survey and synthesis." Decision Support Systems 42, no. 4 (2007): 2164-2185.
[6] Brodic, Darko, and Dragan R. Milivojevic. "An Algorithm for the Estimation of the Initial Text Skew." Information Technology And Control 41, no. 3 (2012): 211-219.
[7] Paunwala, Chirag N., Suprava Patnaik, and Manoj Chaudhary. "An efficient skew detection of license plate images based on wavelet transform and principal component analysis." In Signal and Image Processing (ICSIP), 2010 International Conference on, pp. 17-22. IEEE, 2010.
[8] Likforman-Sulem, Laurence, Abderrazak Zahour, and Bruno Taconet. "Text line segmentation of historical documents: a survey." International Journal of Document Analysis and Recognition (IJDAR) 9, no. 2-4 (2007): 123-138.
[9] Jeong, C. B., and S. H. Kim. "A document image preprocessing system for keyword spotting." In Digital Libraries: International Collaboration and Cross-Fertilization, pp. 440-443. Springer Berlin Heidelberg, 2005.
[10] Das, Amit Kumar, and Bhabatosh Chanda. "A fast algorithm for skew detection of document images using morphology." International Journal on Document Analysis and Recognition 4, no. 2 (2001): 109-114.
[11] Dhandra, B. V., V. S. Malemath, H. Mallikarjun, and Ravindra Hegadi. "Skew detection in Binary image documents based on Image Dilation and Region labeling Approach." In Pattern Recognition, 2006. ICPR 2006. 18th International Conference on, vol. 2, pp. 954-957. IEEE, 2006.
[12] Basu, Subhadip, Chitrita Chaudhuri, Mahantapas Kundu, Mita Nasipuri, and Dipak Kumar Basu. "Text line extraction from multi-skewed handwritten documents." Pattern Recognition 40, no. 6 (2007): 1825-1839.
[14]Lu, Yue, and Chew Lim Tan. "A nearest-neighbor chain based approach to skew estimation in document images." Pattern Recognition Letters 24, no. 14 (2003): 2315-2323.
[15]Deepak Kumar, Dalwinder Singh, "Modified Approach of Hough Transform for Skew Detection and Correction in Documented Images". International Journal of Research in Computer Science, 2 (3): pp. 37-40, April 2012.
[16]Chandan Singh, Nitin Bhatia, Amandeep Kaur, “Hough transform based fast skew detection and accurate skew correction methods”, Pattern Recognition, Volume 41, Issue 12, December 2008, Pages 3528–3546.
[17]Yang Cao, Shuhua Wang, Heng Li “Skew detection and correction in document images based on straight-line fitting”, Pattern Recognition Letters, Volume 24, Issue 12, August 2003, Pages 1871–1879
[18]Shutao Li, Qinghua Shen, Jun Sun “Skew detection using wavelet decomposition and projection profile analysis”, Pattern Recognition Letters, Volume 28, Issue 5, 1 April 2007, Pages 555–562
[19]P.-Y Yin “Skew detection and block classification of printed documents”, Image and Vision Computing, Volume 19, Issue 8, 1 May 2001, Pages 567–579
[20] Rajiv Kapoor, Deepak Bagai, T.S. Kamal “A new algorithm for skew detection and correction”, Pattern Recognition Letters, Volume 25, Issue 11, August 2004, Pages 1215–1229
[21] Amir Egozi, Its’hak Dinstein “Statistical mixture model for documents skew angle estimation”, Pattern Recognition Letters, Volume 32, Issue 14, 15 October 2011, Pages 1912–1921
[22] P. Shivakumara, G. Hemantha Kumar “A novel boundary growing approach for accurate skew estimation of binary document images”, Pattern Recognition Letters, Volume 27, Issue 7, May 2006, Pages 791–801
[23] Michael Makridis, Nikos Nikolaou, Nikos Papamarkos “An adaptive technique for global and local skew correction in color documents”, Expert Systems with Applications, Volume 37, Issue 10, October 2010, Pages 6832–6843