Analyzing and Predicting the Green House Parameters
of Crops
P. S. Asolkar
PG student E&TC Department SSBT’s COET, Bambhori,
Jalgaon
U.S.Bhadade, Ph.D
Professor & Head E&TC Departmet
SSBT’s COET, Bambhori Jalgaon
ABSTRACT
As it is well known, Monitoring and controlling of green house parameters plays a crucial role for quality production of crops. Different techniques have been developed in past for actual monitoring and controlling of major green house parameters such as temperature, humidity, soil moisture, light intensity and CO2 in atmosphere. Controlling of parameters is done by means of relays. The main target of proposed system is to develop hardware implementation module which is capable of measuring temperature, humidity, soil moisture, light intensity and CO2 concentration of crops in green house. This paper also presents the analysis and prediction of green house parameters. Crops selected for analysis and prediction are namely Cucumber, Tomato, Brinjal, Papaya and Chilies. The wireless media of communication used is global system for mobile communication (GSM) technology to assist the control and monitoring of process plants. Five samples of crops are taken as mentioned above and the system had been tested for these crops in green house environment. Finally estimation of total power consumption and total expense consume per annum has been done for controlling devices. This will be helpful for farmers as he will be able to predict the total expense of controlling action for crops. At the same time, it is seen that quality and quantity of products with controlling action is increased than crops grown without controlling action. .
Keywords
green house parameters, controlling devices, GSM, sensors .
1.
INTRODUCTION
Greenhouses are framed like transparent structure for growing crops under suitable and controlled environmental conditions for proper growth and productivity. It is know that, open field cultivation of crops suffer from adverse climatic conditions resulting poor growth of crops. Hence greenhouses are particularly needed to grow plants under natural environmental conditions. At the same time, greenhouses can provide yields 10-12 times higher than that of outdoor cultivation depending upon the type of greenhouse, type of crop, environmental control facilities. Greenhouses are also suitable for vegetables and flower crops production. By using control techniques off season production of crops is also possible using green houses.The necessity of environmental parameters like temperature, humidity differs for different variety of crops. Due to adverse weather conditions, the crops cannot get its required parameter in proportion like temperature hence there is need of the monitoring of these parameters. [18] Crop cultivation has been around for a longtime. It plays a crucial role in the continuous development of human civilization. It is seen that, old and traditional methods of crop cultivation requires a tremendous amount of
hard work and attention. This leads difficulty in implementing traditional cultivation techniques. The green houses provide automatic and effective controlling techniques for improvement in crop growth over old growing methods. This will reduce human efforts required for growing crops in open field.
Certain environmental factors are responsible for development of plant growth. Environment composed of various factors like light, temperature, humidity, CO2 gas which are directly or indirectly plays important role in successive growth of plants. In some cases, poor or weak environment can damage plants by providing disease. Hence better understanding of climatic factors is necessary that may affect the development of the plants and appropriate actions can be drawn to prevent these problems. To overcome these problems, environmental parameter effects that are temperature effects, humidity effects, light effects, moisture effects and CO2 effects are needed to be taken in to consideration.
In this system, microcontroller based GSM approach has been developed for the real time monitoring, controlling, analysis and prediction of green house environmental parameters. The system comprises of both hardware and software. The necessary hardware used in this project is microcontroller (At-mega32) as central processing unit, sensors for sensing the physical parameters, relays for controlling output devices and LCD for displaying the parameters under control. The software used is Mikro C pro for AVR and protocol for communication is TCP/IP. The sensors, constitute the data acquisition system, sense the change in parameters and provide information to the microcontroller. The controller then performs needed action and activates relays for controlling action by means of ventilation, heating, pump, slider and exhaust fan. The parameter range can be controlled by the keypad option and programmer controller. Thus a graphical user interface (GUI) has been developed using advanced TCP/IP data logger for the local acquisition, monitoring with PC and storage of all data for the future purpose. Section 2 describes related work of system. The proposed method is presented in section 3. Section 4 describes crop analysis of each of five crops. Experimental results and analysis has been performed in section 5. Finally section 6 ends with conclusion. At last references are presented in section 7.
2.
RELATED WORK
in tough environments, it is widely used in agricultural industry. [11].
WSN has wide range of applications which [12] reviewed in recent survey of advances in WSN applications and identified the agriculture industry as a potential area of deployment, together with a review of the factors influencing the design of sensor networks for this application. Intel Corp was found as one of the main players in the early implementation of wireless sensor networks in the agriculture industry. [13] A trial installation of 18 temperature sensor nodes for a period of several weeks in an Oregon vineyard was conducted by Intel Corp. The aim of their experiment was to monitor the temperatures during the winter nights and to determine the time to pick the grapes. Research and implementation of WSN in greenhouses climate management was carried out all over the world over the last few years. One of such applications was the use of a web- based WSN platform for greenhouse climate monitoring and control.
Qiang et al. [14] developed a web-based monitoring and control WSN platform for greenhouse climate monitoring. The system consists of 3 nodes; sink node, wireless sensor node and wireless control node. The wireless sensor node’s main job is to collect greenhouse climate information. The task of the sink node is to analyze and process the information received from each sensor. The responsibility of the control node is to control the climate inside the greenhouse based on the collected greenhouse data.
The research work presented by the Rinnovando group [2] in a tomato greenhouse in the South of Italy. They make use of Sensicast devices for the air temperature, relativity humidity and soil temperature measurements with wireless sensor network. They have also developed a Web-based plant monitoring application. According to their experiment, Greenhouse grower can read the measurements over the Internet, and an alarm will be sent to his mobile phone by SMS or GPRS if some measurement variable changes rapidly. The Rinnovando group has a test bed in 20 x 50 meters tomato greenhouse. In their test bed, six nodes are deployed into two rows 12.5 m apart from each other. One mesh node works as a repeater and improves the throughput of the communication. Bridge node gathers data from other sensor nodes, which transmit the measurements of temperature and relative humidity in one minute intervals [2].
The interpretation obtained from Liu et al is presented. [3] They have developed and tested a WSN prototype for environmental monitoring inside the greenhouse. They are using a star topology network of Crossbow MICAz motes. The motes measure temperature, humidity and soil moisture, and send their measurements to the sink node in five minutes intervals. Sink node is a combination of MICAzmote and MIB510 board with data terminal. The terminal with ARM processor module shows the latest measurements in LCD-screen inside the greenhouse and delivers the data to the main PC by using GSM module. The central PC located further apart from the network takes care of data logging and processing. Mote programming and data receiving is possible through the RS-232 serial interface provided by MIB510 board. The Received Signal Strength Indicator (RSSI) values over the distance between nodes with different antenna heights and polarization angles were compared to each other. Based on the results it was possible to conclude that the longest communication range was achieved when nodes had same orientation and maximal antenna height. The temperature difference in experimental measurement between two nodes, where one node was placed in the center of the
greenhouse and another near the greenhouse wall, indicates the existence of the microclimate layers [3].
Hybrid wired/wireless approach for green house management was described by Orazio Mirabella and Michele Brischetto. They have developed a solution based on a hybrid wired/wireless network, where Controller Area Network and ZigBee protocols are used along with all the related problems that this integration involves. They concluded that the deployment of sensors and their localization on the ground makes the system highly scalable. They have tested the system in an open-air field, and found its flexibility and its ability to operate in different environments. [6].
Rangan, K. and Vigneswaran, T. had presented an embedded systems approach to monitor green house” based on the measuring of parameters like Humidity, Water pH, Soil wetness, Light intensity and temperature by sensors are located at different places, where measured, processed, controlled and updated to owner through SMS using GPS modem. [15]
Wireless communication module nRF905 was used by Zhisong Wang and some more authors which have high radio frequency and low power consumption and built the wireless sensor network based on Client/Server. They have developed the embedded web server bases on microprocessor S3C2440 and Linux operation system, and some more functions including remote monitor, remote control greenhouse device and voice prompt. They used the system for data acquisition and device control in different agricultural fields. [16]
3.
PROPOSED METHOD
3.1
Block Diagram of Proposed System
Fig 1: Block Diagram of the System
The proposed system of this project is described in this section. The hardware unit of the prototype of the system is represented by the block diagram shown in figure 1. The proposed system is based an embedded system which will closely monitor and control the microclimatic parameters of a greenhouse which are temperature, humidity, soil moisture, light intensity and CO2 for cultivation of crops or specific plant species which could maximize their production over the whole crop growth season and to eliminate the difficulties
A
D
C
Temperature Sensor Humidity Sensor Soil Moisture Sensor Light SensorCO2 Sensor
At-mega
32Mi
cro-contro
ller
GSM Modem Cooler Heater Water PumpSlider
Exhaust Faninvolved in the system by reducing human intervention to the best possible extent. The green house parameters are first set to threshold value as per requirement of crops and then monitoring of parameters is performed.
When any of the above mentioned climatic parameters cross a safety threshold which has to be maintained to protect the crops, the sensors sense the change and the microcontroller reads this from the data at its input ports after being converted to a digital form by the ADC. Microcontroller then performs needed action by employing relays with respective sensor. The system design basically consists of two units, the hardware and software units. The sensors constitute the data acquisition system that is mainly used for the measurement of temperature, humidity, soil moisture, light intensity and CO2 content in the green house system. Actuators are mainly used to modify the environmental conditions through the activation of cooler, heater, water pump, slider and exhaust fan. It contains an Atmega32 microcontroller as the main processing unit and it gets inputs from the temperature sensor (LM35), Humidity sensor (SY HS220), soil moisture sensor (Two copper probes), Light sensor (LDR), and CO2 sensor. From the data obtained from the sensors the program controls the actuator components such as fan, heater, pump, slider on green portion and exhaust fan to achieve the system requirements.
A microcontroller is used as the heart of the system; it makes the set-up low-cost and effective nevertheless. As the system also employs an LCD display for continuously alerting the user about the condition inside the greenhouse, the entire set-up becomes user friendly.
3.2
Hardware used in System
Microcontroller (AT mega32) Liquid crystal display (16×2LCD) Sensors (Data acquisition system) Temperature sensor (LM35) Humidity sensor (SY-HS220)
Soil moisture sensor (Two copper probes) Light intensity sensor (LDR)
CO2 sensor (MQ5 gas sensor) Actuators (relays)
Control devices Cooler Heater Water pump
Slider mechanism on green shade Exhaust fan
Keypad (4 pin micro switch) GSM modem SIM 300
3.3
Actual Experimental Setup
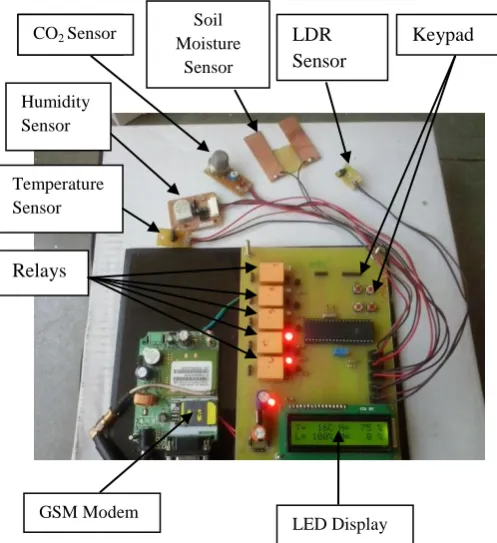
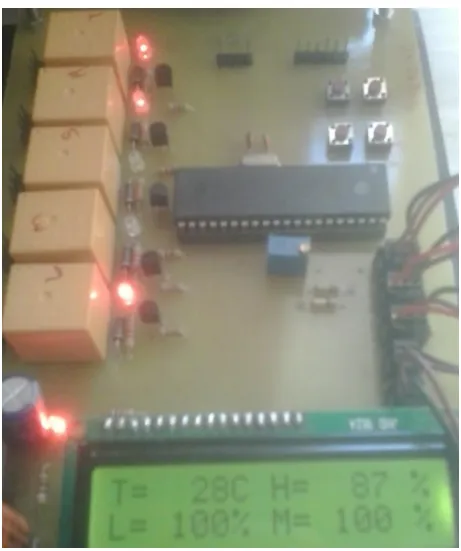
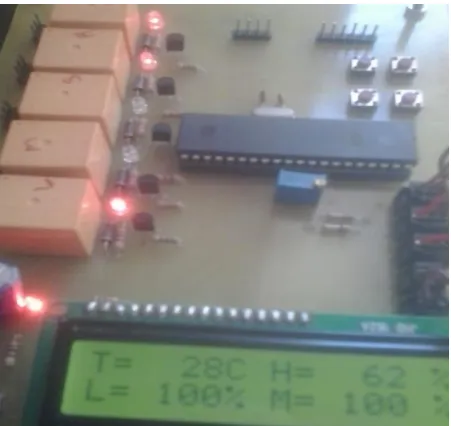
Fig 2: PCB Board Showing Sensor and Relay Circuitry
Fig. 2 shows actual experimental setup of the system. It consists of power supply circuitry, GSM modem, atmega32 microcontroller, LCD display, keypad, sensors and relays mounted on PCB board. When the system starts, LCD initialization takes place. It is seen that temperature and humidity are intensively responsible environmental factors for successive growth of crops. Hence the parameter temperature and humidity are kept flexible and made provision to set from Keypad according to the requirement. Once the required temperature and humidity are set, GSM modem send information in the form of text message to the user mobile and ask to reply with the IP address.
After that IP address appears on the LCD screen which shows that now the system is ready for the monitoring and controlling. The moisture level content is set in between 20% to 80%. When the moisture content in soil goes above 80% then water pump will turned OFF. If moisture limit is in between 20 to 80%, pump will turn ON. When the light intensity goes above 80% slider pulls up green shade and below it slider gets down. The level of CO2 gas is fixed such that when it goes above 30% the control device exhaust fan will get on by indicating relay and below it the reverse action takes place.
3.4
Graphical User Interface
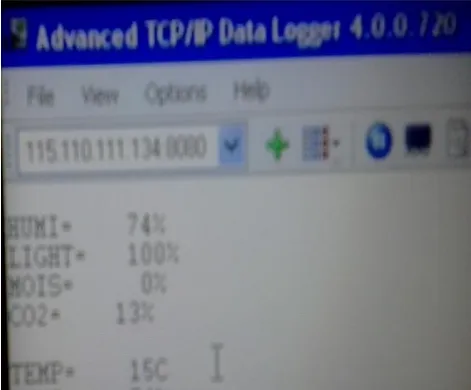
Graphical user interface (GUI) is created using TCP/IP protocol which shows real time monitoring and continuously records the value of all parameters in the system as shown in fig.3. One log file is created which will continuously monitor and record readings from hardware kit. The database is created which saves the continuous data for the future analysis
CO2 Sensor
Soil Moisture
Sensor
LDR Sensor
Keypad
Humidity Sensor
Temperature Sensor
GSM Modem
LED Display
[image:3.595.300.549.111.383.2]and prediction purpose. Fig. 3 also shows IP address received by TCP/IP data logger along with the display of five processing variables.
Fig 3: GUI Created by Advanced TCP/IP Data Logger.
3.5
Hardware Description
3.5.1 Microcontroller
The ATmega32A is a low-power CMOS 8-bit microcontroller based on the AVR enhanced RISC architecture. It is the heart of the system. By executing powerful instructions in a single clock cycle, the ATmega32A achieves throughputs approaching 1 MIPS per MHz allowing the system designed to optimize power consumption versus processing speed.
3.5.2 Analog to Digital Converter
The ATmega32A features a 10-bit successive approximation ADC. The ADC is connected to an 8-channel Analog Multiplexer which allows 8 single-ended voltage inputs constructed from the pins of Port A. The ADC converts an analog input voltage to a 10-bit digital value through successive approximation. The minimum value represents GND and the maximum value represents the voltage on the AREF pin minus 1 LSB.
3.5.3 Liquid Crystal Display
A liquid crystal display (LCD) is a thin, flat display device made up of any number of color or monochrome pixels arrayed in front of a light source or reflector. It is often utilized in battery-powered electronic devices because it uses very small amounts of electric power.
3.5.3 Power Supply Section
Power supply section converts 230 V AC to 5 V DC. It uses bridge circuit and 1C 7805 voltage regulator. 230VAC from the step down transformer is first step down into 12V DC which is further converted into 5V DC.
3.6 Software Description
The software used is Micro c pro for AVR.The mikro C PRO for AVR organizes applications into projects consisting of a single project file (file with the .mcpavextension) and one or more source files (files with the .c extension). The mikro C PRO for AVR IDE allows managing several projects at a
time. Source files can be compiled only if they are part of the project.
Steps for working of software Step1: Install the compiler. Step2: Start up the compiler. Step3: Creating the new project.
Step4: Enter the oscillator frequency value in the device clockfield.
Step5: Specify the name and location of the project. Step6: Add files in project manager window. Step7:Compilation
4.
RESULT AND ANALYSIS
The set of field observations of temperature, humidity, soil moisture, light intensity and CO2 sensors were recorded at green house during Dec 2013 to April 2014 near Nashik growing region, India. The crops selected for analysis purpose are Cucumber, Tomatoes, Brinjal, and Papaya etc. Simultaneously the required optimum range of green house parameters for each of these crops is also taken in to consideration.
It is found that temperature and humidity are intensively responsible environmental factors for successive growth of crops. Hence the optimum temperature and humidity value for each crop has been set separately. Also the parameters soil moisture and light intensity are fixed at moderate level of 80% for these crops. It is found that, normal CO2 concentration in the atmosphere is about 0.03%. In case of closed green house under influence of high light intensity, it decreases to 0.01%. As no higher concentration of gas found, control device of CO2 sensor which is exhaust fan get OFF. As CO2 is active participant of chlorophyll, it is green house parameter of crucial importance.
4.1 Humidification in Green House
Humidity is the measure of the quantity of water vapor in air. In green house humidity is very important because air humidity affects the rate of plants transpiration. Transpiration is process by which plants are drawing water and nutrients from root to leaves where water then evaporates from leaf pores in to air. Due to evaporation of water plants are cooled down. As there is no one level of humidity that is good for all crops, it is necessary to establish preferred humidity level of crops in green house for best growing condition.
During summer season, air is too dry which makes humidity level low and hence plants will transpire more rapidly, often losing a great amount of moisture which is not suitable for growth of plants. These unbalance conditions are prevented by creating humid atmosphere in green house by using humidification technique like misters, fogging and roof sprinklers. Very high humidity level of plants can be controlled by using automatic spray system. In small green house spray can be mist by hands.
crops along with required Optimum parameters range in green house.
Table 1: Optimum Parameter Range for Green House
Crops.
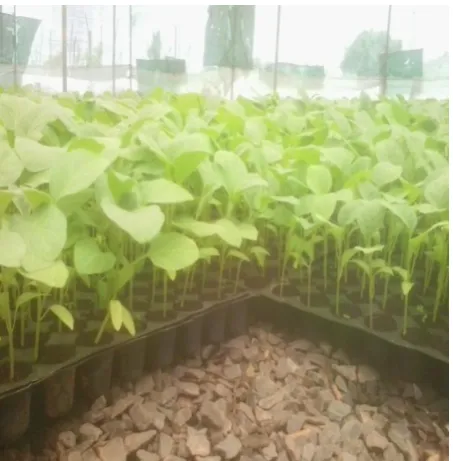
[image:5.595.316.547.181.457.2]Crop Analysis for Cucumber
Fig. 4 shows set up for Cucumber crop and optimum range of temperature and humidity controlling action is shown in Fig.
5. Cucumbers are very sensitive to imbalances or changes in growing conditions.
Cucumber requires temperature range of 25 to 30˚C and humidity in range of 80 to 90% for its successive growth. For the purpose of experiment, the optimum temperature is set at 27˚C and humidity is set at 85% to cucumber and observed further readings.
Fig5: Optimum Temperature and Humidity control
Optimum range of temperature and humidity controlling action is shown in Fig5.
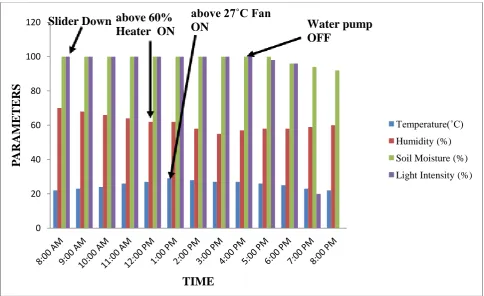
Fig. 6shows the controlling action of green house parameters Vs time for cucumber crop. Parameters selected for controlling action are temperature, humidity, soil moisture and light intensity. It is seen that when temperature and humidity crosses optimum threshold value, relay will perform control action as indicated by appropriate LED. Thus when temperature goes above 27˚C then corresponding relay will make cooler ON as shown in fig. 5.
This controlling action is performed till temperature return to optimum set value and below it relay gets OFF. Similarly, when humidity goes above 85%, heater gets ON. Soil Moisture is maintained at 80%. Thus when moisture goes above 80%, water pump gets OFF. Light intensity is also fixed at 80%. When light intensity goes above 80%, slider get down making relay ON which maintain only sufficient light in green house and protect crop against excess light.
Fig 4: Cucumber Crop
Name Of Vegetable Crop
Optimum Temperature (˚C)
Optimum Relative Humidity (%)
Cucumber 25-30 80-90
Tomatoes 23-27 50-60
Brinjal 25-28 65-75
[image:5.595.56.281.457.695.2]Fig 6: Time Vs Parameters Controlling Action
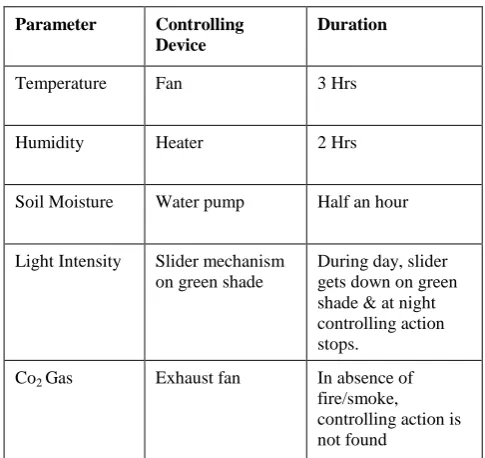
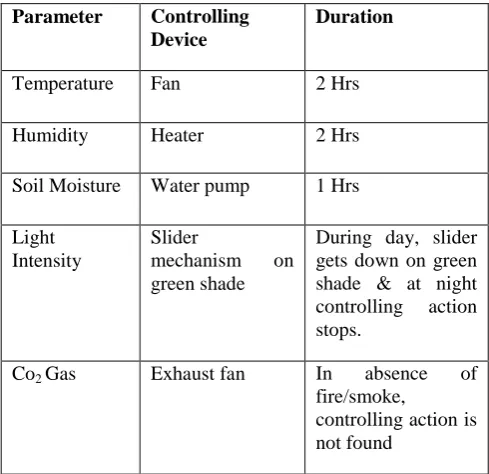
Table 2: Time Duration Showing Performance of Controlling Action
Parameter Controlling
Device
Duration
Temperature Fan 3 Hrs
Humidity Heater 2 Hrs
Soil Moisture Water pump Half an hour
Light Intensity Slider mechanism on green shade
During day, slider gets down on green shade & at night controlling action stops.
Co2 Gas Exhaust fan In absence of fire/smoke, controlling action is not found
Table 2 shows the time duration required for above mentioned controlling devices to perform controlling action for Cucumber crop.
Crop Analysis for Tomato
Fig. 7 shows set up for Tomato crop and optimum range of temperature and humidity controlling action is shown in Fig. 8.
Fig 7: Tomato Crop
0 20 40 60 80 100 120
P
AR
AM
E
T
E
RS
TIME
Temperature(˚C) Humidity (%) Soil Moisture (%) Light Intensity (%) above 85%
Heater ON Slider
down
above 27˚C Fan
ON 80% Water
[image:6.595.317.543.481.725.2]Fig. 9shows the controlling action of green house parameters for tomato crop. Tomato production is sensitive to temperature. Tomatoes grow best in warm temperature with a lot of light. Low level of light (15% of summer light) will greatly reduce fruit yield. Green house tomatoes require optimal temperature 23to 27˚C and very high humidity about 50 to 60% to grow successfully.
The optimum temperature is set to be 27˚C and humidity 60% to tomato and observed further readings. It is seen that when temperature and humidity crosses optimum threshold value, relay will performed control action as indicated by appropriate LED. Thus when temperature goes above 27˚C then corresponding relay will make cooler ON as shown in fig.8. Similarly, when humidity goes above 60%, heater gets ON. Soil Moisture is maintained at 80%. Thus when moisture goes above 80%, water pump gets OFF. Light intensity is also fixed at 80%. When light intensity goes above 80%, slider get down making relay ON which maintain only sufficient light in green house and protect crop against excess light.
[image:7.595.56.282.70.283.2]Fig8:Optimum Temperature and Humidity control
Fig 9: Time Vs Parameters Controlling Action
0 20 40 60 80 100 120
P
AR
AM
E
T
E
RS
TIME
Temperature(˚C) Humidity (%) Soil Moisture (%) Light Intensity (%)
above 60%
Heater ON
Slider
Down
80% Water
pump ON
[image:7.595.55.524.346.724.2]Table 3: Time Duration Showing Performance of Controlling Action
Parameter Controlling
Device
Duration
Temperature Fan 1 Hrs 40 min
Humidity Heater 3 Hrs
Soil Moisture Water pump Half an hour
Light Intensity
Slider mechanism on green shade
During day, slider gets down on green shade & at night controlling action stops.
Co2 Gas Exhaust fan In absence of
fire/smoke, controlling action is not found
Table 3 shows the time duration required for above mentioned controlling devices to perform controlling action Tomato crop.
Fig 11: Optimum Temperature and Humidity control
[image:8.595.316.543.91.343.2]Crop Analysis for Brinjal
Fig 10: Brinjal Crop
Fig. 10 shows set up for Brinjal crop and optimum range of temperature and humidity controlling action is shown in Fig. 11. Eggplant or Brinjal is a warm-season crop and does not tolerate frost. A long growing season of 80 days is required for the transplanted crop. Optimal temperatures for eggplant production are 26 °C days and 20 °C nights. Cooler temperatures can reduce fruit set. Higher temperatures and high humidity levels also reduce yields
Fig. 12 shows the controlling action of green house parameters for brinjal crop. Brinjal is a warm season crop. The optimal temperature for brinjal set is 28˚C and humidity is 65%. It is seen that when temperature and humidity crosses optimum threshold value, relay will performed control action as indicated by appropriate LED.
Thus when temperature goes above 28˚C then corresponding relay will make cooler ON as shown in fig.11. Similarly, when humidity goes above 65%, heater gets ON. Soil Moisture is maintained at 80%.
[image:8.595.56.283.443.674.2]Fig 12: Time Vs Parameters Controlling Action
Table 4: Time Duration Showing Performance of Controlling Action
Parameter Controlling
Device
Duration
Temperature Fan 2 Hrs
Humidity Heater 2 Hrs
Soil Moisture Water pump 1 Hrs
Light Intensity
Slider
mechanism on
green shade
During day, slider gets down on green shade & at night
controlling action
stops.
Co2 Gas Exhaust fan In absence of
fire/smoke,
controlling action is not found
Table 4 shows the time duration required for above mentioned controlling devices to perform controlling action for Brinjal crop. Time duration is useful for estimating annual power consumption required for control device to perform a controlling action. Once the power consume is estimated, it is easy to calculate expenditure incurred yearly as described in section V.
[image:9.595.48.293.436.673.2]Crop Analysis for Papaya
Fig 13: Papaya Crop
Fig. 13 shows set up for Papaya crop and optimum range of temperature and humidity controlling action is shown in Fig. 14. In papaya, seeds are predominantly used for raising the plants. The set temperature and humidity for papaya crop is 27˚C and 60%.
0 20 40 60 80 100 120
P
AR
AM
E
T
E
RS
TIME
Temperature(˚C) Humidity (%) Soil Moisture (%) Light Intensity (%)
above 28˚CFan
ON
Slider
Down
above 65%
Heater ON
Fig. 15 shows the controlling action of green house parameters for papaya crop. It is seen that when temperature
and humidity crosses optimum threshold value, relay will performed control action as indicated by appropriate LED.
Thus when temperature goes above 27˚C then corresponding relay will make cooler ON as shown in fig.14. Similarly, when humidity goes above 60%, heater gets ON. Soil Moisture is maintained at 80%. Thus when moisture goes above 80%, water pump gets OFF. Light intensity is also fixed at 80%. When light intensity goes above 80%, slider get down making relay ON which maintain only sufficient light in green house and protect crop against excess light.
[image:10.595.55.283.90.308.2]Thus four types of crops that are Cucumber, Tomato, Brinjal, and Papaya are analyzed. Also the nature of these crops is discussed and the graphs are drawn as per the controlling action of parameters of crops. The controlling action of parameters has been presented on each graph with the optimum threshold value required for successive growth and development of crops. Controlling action of all green house parameters are considered with respect to time and it is plotted by considering average of time from 8Am to 8Pm. Thus graph shows the continuous nature of recorded parameters as a function of time and satisfactory results were found.
Fig 14: Optimum Temperature and Humidity Control
.
Fig 15: Time Vs Parameters Controlling Action
0 20 40 60 80 100 120
P
A
R
A
M
ET
ERS
TIME
Temperature(˚C) Humidity (%) Soil Moisture (%) Light Intensity (%)
above 60%
Heater ON
above 27˚C Fan
ON
Slider Down
Water pump
[image:10.595.55.540.401.697.2]Table 5: Time Duration Showing Performance of Controlling Action
Parameter Controlling
Device
Duration
Temperature Fan 5 Hrs
Humidity Heater 2 Hrs
Soil Moisture Water pump No action found as crop had sufficient amount of water
Light Intensity Slider mechanism on green shade
During day, slider gets down on green shade & at night controlling action stops.
[image:11.595.52.550.442.614.2]Co2 Gas Exhaust fan In absence of fire/smoke, controlling action is not found
Table 5 shows the time duration required for above mentioned controlling devices to perform controlling action for papaya crop.
5.
PREDICTION RESULT
5.1
Formula
for
Estimating
Power
Consumption
(Wattage × Hours Used Per Day × No Of Days Per Year) ÷ 1000 = Kilo-Watt Hour Per Year
5.2
Formula for Estimating Annual Cost
Annual Power Consumption (Kwh/Year) × Local Utility Rate/Kwh = Annual Cost Consume
Local Utility Rate: 7 Units Fan Used: 50w
Heater Used: 1500w Water Pump: 0.5 Hp (375w)
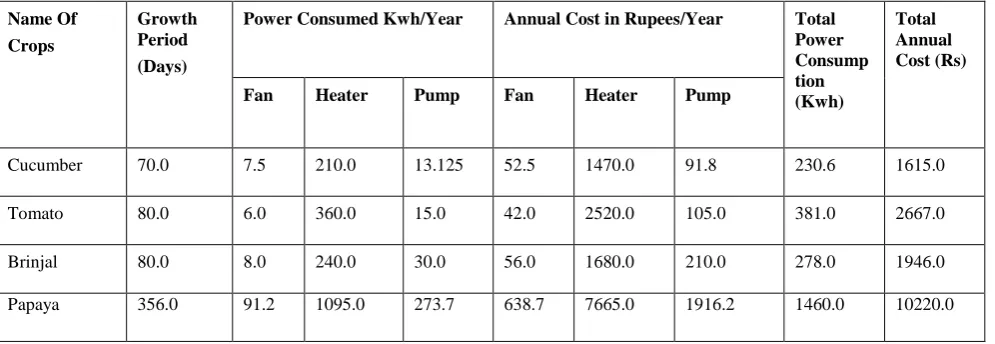
Table 5: Total Power Consume And Total Expense Estimated Per Annum
Name Of Crops
Growth Period (Days)
Power Consumed Kwh/Year Annual Cost in Rupees/Year Total
Power Consump tion (Kwh)
Total Annual Cost (Rs)
Fan Heater Pump Fan Heater Pump
Cucumber 70.0 7.5 210.0 13.125 52.5 1470.0 91.8 230.6 1615.0
Tomato 80.0 6.0 360.0 15.0 42.0 2520.0 105.0 381.0 2667.0
Brinjal 80.0 8.0 240.0 30.0 56.0 1680.0 210.0 278.0 1946.0
Papaya 356.0 91.2 1095.0 273.7 638.7 7665.0 1916.2 1460.0 10220.0
Table 5 shows total power consumption in KWh and total expense consume in Rs to run an appliance (Control device) for above mentioned crops. This table will be able to predict the cost required to take crop in next season. Also it due to controlling device action, quality, quantity and productivity of crop increases yearly.
6.
CONCLUSION
This paper has presented GSM communication system for monitoring and control of greenhouses. The control system based on the GSM technology found to be very effective that allows control from a remote area to the desired location. The hardware implementation module has been developed and is
[image:11.595.51.549.442.612.2]In nearby future, this system will be used in crop management applications with an emphasis on integrated pest management and nutrient management which are beneficial for efficient, economical, and ecological use of pesticides and fertilizer. Also the simulating LED lights are replaced by actual control devices to perform controlling action.
This is beneficial for farmers to predict the expense consume per annum and from this prediction he can select crop and its requirements in next season.
7. REFERENCES
[1]Darko Stipanieev, Mmmber, IEEE, Maja Eiae and Jadranka Marasoviae, Member, IEEE “Networked embedded greenhouse monitoring and control” Volume:2 Control Applications, 2003. CCA 2003. Proceedings of 2003 IEEE Conference.
[2] M. Mancuso and F. Bustaffa, “A Wireless Sensors Network for Monitoring Environmental Variables in a Tomato Greenhouse,” presented at 6th IEEE International Workshop on Factory Communication Systems in Torino, Italy, June 28-30, 2006.
[3] H. Liu, Z. Meng and S. Cui, “ A Wireless Sensor Network Prototype for Environmental Monitoring in Greenhouses,” presented at Wireless Communications, Networking and Mobile Computing 2007 (WiCom 2007), International Conference on 21-25 Sept. 2007 Page(s): 2344 – 2347.
[4] H. Liu, Z. Meng and S. Cui, “ A Wireless Sensor Network Prototype for Environmental Monitoring in Greenhouses,” presented at Wireless Communications, Networking and Mobile Computing 2007 (WiCom 2007), International Conference on 21-25 Sept. 2007 Page(s): 2344 – 2347.
[5] Jifeng Ding; Jiyin Zhao; Biao Ma; “Remote Monitoring System of Temperature and Humidity 4.
Based on GSM Image and Signal Processing,” 2009. CISP '09. 2nd International Congress on Digital Object Identifier: 10.1109/CISP.2009.5304519 Publication Year: 2009, Page(s): 1 – 4 IEEE CONFERENCES [6]Orazio Mirabella and Michele Brischett “Hybrid
Wired/Wireless Networking Infrastructure For Greenhouse Management”, IEEE transactions on instrumentation and measurement, vol. 60, no. 2, February 2011.
[7]Y. Zhou, X. Yang, X. Guo, M. Zhou, and L. Wang, “A design of greenhouse monitoring & control system based on ZigBee wireless sensor network,” in Proc. Int. Conf. WiCom, Sep. 21–25, 2007, pp. 2563–2567.
[8] L. Gonda and C. E. Cugnasca, “A proposal of greenhouse control using wireless sensor networks,” in Proc. 4th World Congr. Conf. Comput. Agric. Nat. Resour., Orlando, FL, Jul. 24–26, 2006.
[9] B. van Tuijl, E. van Os, and E. van Henten, “Wireless sensor networks: State of the art and future perspective,” in Proc. Int. Symp. High Technol. Greenhouse Syst. Manage. (Greensys), 2007, pp. –554.
[10] G. Gaderer, P. Loschmidt, and A. Mahmood, “A novel approach for flexible wireless automation in real-time environments,” in Proc. IEEE Int. WFCS, Dresden, Germany, May 21–23,2008,pp.81.
[11]. Hui, L., M. Zhijun, and C. Shuanghu. A Wireless Sensor Network Prototype for Environmental Monitoring in Greenhouses. in WiCom 2007. International Conference on Wireless Communications, Networking and Mobile Computing, sept 2007, pp 2344-2350
[12]. Akyildiz, I.F., et al., Wireless sensor networks: a survey. Computer Networks, 2002. 38(4): pp. 393-422. 22. Burrell, J., T. Brooke, and R. Beckwith, Vineyard computing: sensor networks in agricultural production. Pervasive Computing, IEEE, 2004. 3(1): pp. 38-45. [13]. Burrell, J., T. Brooke, and R. Beckwith, Vineyard
computing: sensor networks in agricultural production. Pervasive Computing, IEEE, 2004. 3(1): pp. 38-45. [14]. Qiang, G. and C. Ming, Research and Design of
Web-Based Wireless Sensor Network Management System for Greenhouse, in Proceedings of the 2008 International School of Engineering and Advanced Technology, Massey University Page 148.
[15] Rangan, K. and Vigneswaran, T. “An Embedded systems approach to monitor green house”, Published in: Recent Advances in Space Technology Services and Climate Change (RSTSCC), 2010.
[16] Zhisong Wang and Shihua Li ; Qi Hao ; Linlin Li “Research of intelligent greenhouse remote monitor system based on embedded network and wireless transmission technology”, Published in: Electrical and Control Engineering (ICECE), 2011 International Conference on 16-18 Sept. 2011.
[17] G. J. Timmerman and P. G. H Kamp, “Computerised Environmental Control in Greenhouses,” PTC, The Netherlands, Page(s): 15–124, 2003.
[18]. Bakker, J.C., Greenhouse climate control: an integrated approach, ed. J.C. Bakker. 1995, Wageningen Wageningen Pers.
[19]. Mastalerz, J.W., The greenhouse environment : the effect of environmental factors on the growth and development of flower crops. 1977, New York: Wiley.
[20]. Nelson, P.V., Greenhouse operation and management. 6 ed. 2003, Upper Saddle River, NJ Prentice Hall.