Detection of Glaucoma based on Superpixel Generation
and Feature Extraction
S.J. Grace Shoba
Ph.D research scholar SENSE/ VIT University
Chennai
A. Brintha Therese,
Ph.D. ProfessorSENSE/ VIT University Chennai
ABSTRACT
Glaucoma is a chronic eye disease in which the optic nerve is progressively damaged. It is the second leading cause of blindness and is predicted to affect around 80 million people by 2020. Development of the disease leads to loss of vision which occurs gradually over a long period of time. Since it is very difficult to cure the disease at severe stage, it can be detected initially by using proposed method. This method proposes segmentation of optic disc and optic cup using superpixel classification and extraction of the feature values for glaucoma screening. Superpixels are local, coherent and provide a convenient primitive to compute local image features. In optic disc segmentation, superpixels using SLIC (simple linear iterative clustering) is generated which is followed by feature extraction where Contrast Enhanced histogram and center surround statistics (in which Gaussian pyramid based feature is used) are implemented, then each superpixel is classified as disc or non-disc to deform the exact disc region. Using the same process, the optic cup is also segmented. The optic disc and optic cup boundaries in retinal fundus image are identified using Randomized Hough‟s transform. The 1280 feature values are obtained from Contrast Enhanced histogram and 36 feature values are obtained from center surround statistics. Therefore a total of 1316 feature values of the reference fundus image are stored in the database. Then the feature values of the input or test image are obtained and compared with the set of sample values stored in database using Support Vector Machine classifier. The set of values which is nearest to the set of feature values obtained from the input image is then mapped to group set. Hence, presence of Glaucoma is detected.
Keywords
Glaucoma, Superpixels, Randomized Hough‟s transform feature values.
1.
INTRODUCTION
There are many deadly eye diseases like Cataract, Diabetic Retinopathy, Conjunctivitis, Glaucoma etc which can cause blindness. Glaucoma is the second leading cause of blindness and it is predicted to affect around 80 million people by 2020[1].It is a chronic eye disease in which the optic nerve is progressively damaged. The disease leads to loss of vision which occurs gradually over a long period of time. As the symptoms occur only when the disease is quietly advanced, glaucoma is called the silent thief of sight. . If the condition is detected at the early stage, it is possible to arrest the development or slow the progression with medical and surgical means.Since Glaucoma progresses with few signs or symptoms and the vision loss from Glaucoma is irreversible, screening of people at high risk for the disease is vital. People suffering from tumor, diabetes, an advanced cataract or inflammation are more vulnerable to Glaucoma. Therefore,
detecting Glaucoma in time is critical. Following are tests used in present scenario detect Glaucoma-Tonometry, Ophthalmoscopy, Gonioscopy and Visual Field Testing.
Manually detection of Glaucoma by performing these tests by ophthalmologists is really time consuming. So automation is highly recommended. Clinical indicators such as cup to disc ratio CDR [2], Disc diameter[3], ISNT ratio[4],peripapillary atrophy[5],notching[6],optic nerve head assessment [7]-[9],multifocal electroretinogram analysis[10] etc., are employed for glaucoma screening. Different ophthalmologists have different opinions on the usefulness of these factors.
1.1
Retinal Fundus Image
The fundus of the eye is the interior surface of the eye, opposite the lens, and includes the retina, optic disc, macula and fovea. The retina is the inner most and important layer of the eye where the earliest pathological changes can be seen. It is composed of several important anatomical structures, which can indicate many diseases such as hypertension, diabetic retinopathy and glaucoma. The most effective treatment to combat these eye diseases is early detection through regular screening of the fundus. Various methods are employed to extract the different features automatically from fundus image such as blood vessels, optic disc (OD), optic cup , macula, fovea etc., fig1 shows a retinal fundus image.
Figure 1- Retinal fundus image
This proposed method consists of the following stages: preprocessing, Superpixel based classification disc and cup segmentation, extraction of feature values from the superpixels using contrast enhanced histogram and center surround statistics, comparison of those feature values of the reference and the test image and then mapping to the group set that determines whether the test image is a healthy or a glaucomatous image.
This paper is organized as follows: In section 2, Preprocessing of the input fundus image. Section 3 includes superpixel generation using simple linear iterative clustering. Section 4 introduces feature extraction from superpixels using contrast enhanced histogram and Center Surround Statistics. Section 5 involves SVM classifier and section 6 illustrates the algorithm and section 7 shows the results.
2.
PREPROCESSING
Preprocessing is done in order to automatically crop the required region and remove noise. It involves filtering followed by thresholding, morphological operation, label based region extraction and correlation with original image. Filtering is a technique for modifying or enhancing an image i.e., to emphasize certain features or remove other features. In this proposed method “ unsharp filter ” is used to remove noise which is a contrast enhancement filter.
3.
SUPERPIXEL GENERATION
Superpixel algorithms group pixels into perceptually meaningful atomic regions, which can be used to replace the rigid structure of the pixel grid. They capture image redundancy, provide a convenient primitive from which to compute image features, and greatly reduce the complexity of subsequent image processing tasks. In this paper superpixels are generated to acquire the boundaries of disc and cup. There are many approaches to generate superpixels, each with its own advantages and drawbacks that may be better suited to a particular application. It is difficult to define what constitutes an ideal approach for all applications, the following properties are generally desirable:
1) Superpixels should adhere well to image boundaries.
2) When used to reduce computational complexity as a pre-processing step, superpixels should be fast to compute, memory efficient, and simple to use.
3) When used for segmentation purposes, superpixels should both increase the speed and improve the quality of the results.
Algorithms for generating superpixels can be broadly categorized as either graph based or gradient ascent methods. Graph-based approaches to superpixel generation treat each pixel as a node in a graph. Edge weights between two nodes are proportional to the similarity between neighboring pixels. Superpixels are created by minimizing a cost function defined over the graph. Starting from a rough initial clustering of pixels, gradient ascent methods iteratively refine the clusters until some convergence criterion is met to form superpixels.Many algorithms have been proposed for superpixel generation. No existing method is satisfactory in all regards and hence in this paper Simple Linear Iterative Clustering SLIC algorithm is used.[11 ]
3.1 Simple Linear Iterative Clustering
Simple linear iterative clustering algorithm (SLIC) is used to aggregate nearby pixels into superpixels retinal fundus images. Compared with other superpixel methods, SLIC is fast, memory efficient and has excellent boundary adherence.
The simplicity of this approach makes it extremely easy to use a lone parameter specifies the number of superpixels and the efficiency of the algorithm makes it very practical. SLIC is also simple to use with only one parameter, i.e., the number of desired superpixels. Simple linear iterative clustering (SLIC) is an adaptation of k-means for superpixel generation, with two important distinctions:
1) The number of distance calculations in the optimization is dramatically reduced by limiting the search space to a region proportional to the superpixel size. This reduces the complexity to be linear in the number of pixels N and independent of the number of superpixels k.
2) A weighted distance measure combines color and spatial proximity, while simultaneously providing control over the size and compactness of the superpixels.
[image:2.595.321.538.375.497.2]In SLIC, k initial cluster centers Ck are sampled on a regular grid spaced by S=(N/k)1/2 pixels apart from the image with N pixels. The centers are first moved towards the lowest gradient position in a 3x3 neighborhood. Clustering is then applied .For each Ck ,SLIC iteratively searches for its best matching pixel from the 2SX2S neighborhood around Ck based on color, spatial proximity and then compute the new cluster center based on the found pixel. The iteration continues until the distance between the new centers and previous ones is small enough. Finally, a post processing is applied to enforce connectivity. Fig 2 shows a superpixel generation image
Figure 2- Superpixel Generation of the preprocessed image
4.
FEATURE EXTRACTION
Feature extraction is the process of generating features to be used in the selection and classification tasks. Feature extraction involves simplifying the amount of resources required to describe a large set of data accurately. Image features can refer to: Global properties of an image: average gray level, shape of intensity ,histogram etc. Local properties of an image: refers to some local features as image.
Feature extraction is a general term for methods of constructing combinations of the variables to get around these problems while still describing the data with sufficient accuracy. Feature extraction involves two processes: contrast enhanced histogram and center surround statistics.
4.1 Contrast Enhanced Histogram
color spaces individually to enhance the contrast for easier analysis as in fig 3. However, histogram equalization on R,G,B may yield dramatic changes in the image‟s color balance.Thus, hue h and saturation s from HSV color space are also included to form five channel maps as shown in fig 5(a) and fig 5(b). The value v from HSV color space is not used as it is almost the same as the red channel for retinal images. The histogram of each superpixel is computed from all the five channels: the histogram equalized R,G,B as well as the original H,S. The histogram computation uses 256 bins and 256X5=1280 dimensional feature is computed for the j th superpixel , where HE(.)denotes the function of histogram equalization and hj(.) the function to compute histogram from SPj.
4.2 Center Surround Statistics
To compute CSS, nine spatial scale dyadic Gaussian pyramids are generated.
4.2.1 Dyadic Gaussian Pyramid
A Gaussian pyramid is a technique used in image processing, especially in texture synthesis. The technique involves creating a series of images which are weighted down using a Gaussian average (Gaussian blur) and scaled down as shown in fig 4. To compute CSS, nine spatial scale dyadic Gaussian pyramids are generated with a ratio from 1:1 (level 0) to 1:256 (level 8)[15].Multiple scales are used as the scale of the blob-like structures largely vary. The dyadic Gaussian pyramid[16] is a hierarchy of low-pass filtered versions of an image channel, so that successive levels correspond to lower frequencies. It is accomplished by convolution with a linearly separable Gaussian filter and decimation by a factor of two. Then center surround operation between center (finer) levels
c=2,3,4 and surround levels (coarser) s=c+d, with is applied to obtain six maps empirically computed at levels of 2–5, 2–6, 3–6, 3–7, 4–7, and 4–8 from an image channel [17]-[19]. Denote the feature map in center level „c‟ as I(c) and the feature map in surround level „s‟ as I(s). Because of the scale difference, we first interpolate I(s) to be the same size I(c) as and the interpolated map is denoted as fs-c(I(s)) ,where fs-c(.) denotes the interpolation from the surround level „s‟ to the center level „c‟ .The center surround difference is then computed as |I(c)-fs-c(I(s))|. All the difference maps are resized to be the same size as the original. The maps are computed from „r‟, „g‟ and „b‟ channels to get 6*3=18 maps. The CSS features are then computed as the first and second moments of these maps within superpixels. Denoting Mi, i=1, 2 ….18, as the ith
map, the feature CSSj consists of the mean µj and variance varj of maps within the superpixels i.e CSSj =[µj varj] where µj and varj from superpixel SPj with nj pixels are computed as
µj (i) = 1/nj ∑ Mi(x,y) --- (1)
(x,y)€ SPj
Varj (i)=1/nj ∑ ( Mi(x,y) - µj(i) )1/2
(x,y)€ SPj ---(2)
Using the above equations(1) and (2), the mean and variance for the individual 18 maps are computed and hence a total of 36 feature values are obtained through CSS. The above 1280 feature values from the Contrast Enhanced Histogram process are combined with the 36 feature values of Center Surround Statistics process to form a total of 1316 feature values for each individual images.Randomized Hough transform is used to obtain the exact boundary of the optic disk and cup.
Output image
of the Superpixel
[image:3.595.77.542.423.721.2]Generation
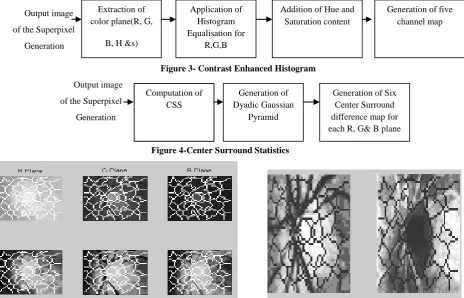
Figure 3- Contrast Enhanced Histogram
Output image
of the Superpixel
Generation
Figure 4-Center Surround Statistics
Figure 5(a) Contrast Enhanced Histogram output- Images of R,G,B planes Figure 5(b) Hue and Saturation
Computation of CSS
Generation of Dyadic Gaussian
Pyramid
Generation of Six Center Surround difference map for each R, G& B plane Computation of
CSS Extraction of color plane(R, G,
B, H &s)
Application of Histogram Equalisation for
R,G,B
Addition of Hue and Saturation content
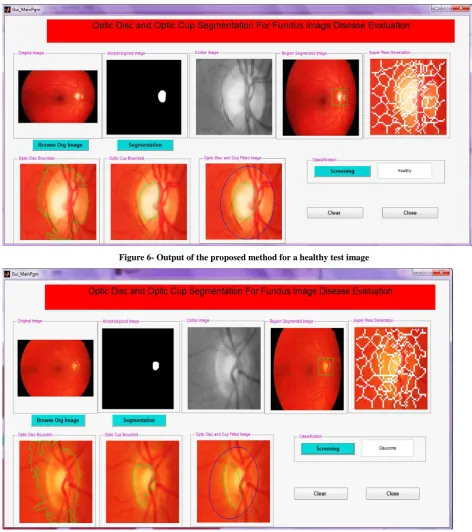
Figure 6- Output of the proposed method for a healthy test image
Figure 7- Output of the proposed method for a Glaucomatous image
5.
SVM CLASSIFIER
In the training part, 36 reference images are stored for comparing the features with the test image given as an input to the program by the user. The reference image related information is stored in with the help of three matrices. The first matrix [A] consists of the feature values of the reference image, i.e. six features for each plane (R, G, and B). Mean and Variance for the individual 18 maps are computed and hence a total of 36 feature values are obtained through CSS. The above 1280 feature values from the Contrast Enhanced Histogram process are combined with the 36 feature values of Center Surround Statistics process to form a total of 1316 feature values for each individual image.
The second matrix [B] is an array of strings. It stores the information if the eye is healthy or not if it is then the name of disease (i.e. Glaucoma).
6. ALGORITHM
1. Calculate the image features form the reference images and store them in the array.
2. Then the „test‟ image is given to the program, the feature values are calculated and compared with the set of values already stored in the cells.
In this paper, the algorithm is trained with 36 reference images and tested with 21 input images. Using the proposed algorithm, all the test images were diagnosed as either healthy or Glaucomatous images.
7. RESULTS AND CONCLUSION
T
he results of various stages such as preprocessing,superpixel generation ,extraction of feature values from the superpixels, determination of boundary of optic disk and cup by randomized hough transform, comparison of feature values of the test image with the reference image and classification as healthy or glaucomatous image by the SVM classifier is as shown in figure 6 and figure 7 respectively. Thus in this proposed method 1316 feature values of the test image are extracted and compared with that of the reference image using SVM classifier.In future this output can be also compared with other classifiers and the classification accuracy can be analyzed. This algorithm is restricted to small databases which is related to the glaucoma. In future, the Modified Spatial Fuzzy C Means Clustering algorithm can be extended to larger clinical databases in order to identify the glaucoma at the maximum level.8. REFERENCES
[1] H. A. Quigley and A. T. Broman, “The number of people with glaucoma worldwide in 2010 and 2020,” Br. J. Ophthalmol., vol. 90, no. 3,pp. 262–267, 2006.
[2] J.Liu,D.W.K.Hong,J.H.Lim,X.Jia,F.Yin,W.Xiong, T.Y. Wong Optic cup and disk extraction from retinal fundus images for determination of cup to disk ratio Industrial Electronics and Applications 2008 ICIEA 2008 3RD IEEE conference on (2008) pages: 1828-1832.
[3] D. Michael and O. D. Hancox, Optic disc size, an important consideration in the glaucoma evaluation, Clin. Eye Vis. Care, vol. 11, pp.59–62, 1999.
[4] N. Harizman, C. Oliveira, A. Chiang, C. Tello, M. Marmor, R.Ritch, and J. M. Liebmann, The ISNT rule and differentiation ofnormal from glaucomatous eyes, Arch. Ophthalmol., vol. 124, pp.1579–1583, 2006.
[5] J. B. Jonas, M. C. Fernandez, and G. O. Naumann, Glaucomatous parapapillary atrophy occurrence and correlations,Arch. Ophthalmol., vol. 110, pp. 214–222, 1992.
[6] R. R. Allingham, K. F. Damji, S. Freedman, S. E. Moroi, and G. Shafranov, Shields‟ Textbook of Glaucoma, 5th ed. Philadelphia, PA: Lippincott Williams Wilkins, 2005.
[7] J. Meier, R. Bock,G.Michelson, L. G. Nyl, and J. Hornegger, Effects of preprocessing eye fundus images on appearance based glaucoma classification, in Proc. 12th Int. Conf. Comput. Anal. Images Patterns, 2007, pp. 165–172.
[8] R. Bock, J. Meier, G. Michelson, L. G. Nyl, and J. Hornegger, Classifying glaucoma with image-based features from fundus photographs, Proc. 29th DAGM Conf. Pattern Recognit. , pp. 355–364,2007.
[9] R. Bock, J. Meier, L. G. Nyl, and G. Michelson, Glaucoma risk index: Automated glaucoma detection from color fundus images, Med. Image Anal., vol. 14, pp. 471–481, 2010.
[10]L. Boquete, J.M. Miguel-Jiménez , S. Ortega , J.M. Rodríguez-Ascariz , C. Pérez-Rico , R. Blanco “Multifocal Electroretinogram Diagnosis Of Glaucoma Applying Neural Networks And Structural Pattern Analysis‟‟Elseiver-Expert Systems with Applications 39 (2012) 234–238.
[11] R. Achanta, A. Shaji, K. Smith, A. Lucchi, P. Fua, and S. Susstrunk,“Slic superpixels compared to state-of-the-art superpixel methods,”IEEE Trans. Pattern Anal. Mach. Intell., vol. 34, no. 11, pp.2274–2281, Nov. 2012.
[12] J. Tighe and S. Lazebnik, “Superparsing: Scalable nonparametric image parsing with superpixels,” in Eur. Conf. Comput, Vis., 2010, vol. 5, pp. 352–365.
[13] J. Cheng, J. Liu, Y. Xu, D. W. K. Wong, B. H. Lee, C. Cheung, T. Aung, and T. Y. Wong, “Superpixel classification for initialization in model based optic disc segmentation,” in Int. Conf. IEEE Eng. Med.Biol. Soc., 2012, pp. 1450–1453.
[14] T. H. Hildebrandt, “A local neural implementation of histogram equalization,”in IEEE Int. Conf. Neural Netw., 1993, vol. 3, pp. 1678–1683. E. H. Adelson, C. H. Anderson, J. R. Bergen, P. J. Burt, and J. M.Ogden, “Pyramid methods in image processing,” RCA Eng., vol. 29, no. 6, pp. 33–41, 1984.
[15] Jiu Cheng,Jiang Liu Superpixelclassification based optic disk and optic cup segmentation for glaucoma screening IEEE transactions on medical imaging,vol 2,no.6.June 2013
[16] E. H. Adelson, C. H. Anderson, J. R. Bergen, P. J. Burt, and J. M.Ogden, “Pyramid methods in image processing,” RCA Eng., vol. 29,no. 6, pp. 33–41, 1984.
[17] L. Itti, C. Koch, and E. Niebur, “A model of saliency-based visual attentionfor rapid scene analysis,” IEEE Trans. Pattern Anal. Mach. Intell., vol. 20, no. 11, pp. 1254–1259, Nov. 1998.
[18] D. Song and D. Tao, “Biologically inspired feature manifold for scene classification,” IEEE Trans. Image Process., vol. 19, no. 1, pp. 174–184, Jan. 2010.