ISSN 2250-3153
http://dx.doi.org/10.29322/IJSRP.8.11.2018.p8352
www.ijsrp.org
The detection and prevention of errors
in Clinical laboratory
Eng. Wafa' Al-faraeh, Eng. Mohamed F. Ababeneh
Royal Medical Services – Amman – Jordan
DOI: 10.29322/IJSRP.8.11.2018.p8352
http://dx.doi.org/10.29322/IJSRP.8.11.2018.p8352
Abstract: The problem of errors in clinical laboratory has recently received a great deal of attention. Which plays a key role to healthcare services and may generate a serious risk affecting patient's life. The frequency of laboratory errors varies greatly, depending on the diagnosis procedures and steps of the total testing process. In this paper, technical specification and recommendations by International Organization for Standardization (ISO) have been collected and explored to achieve better understanding for corrective procedures to reduce errors in laboratory.
Keywords: laboratory errors, pre-analytical phase, analytical phase, post-analytical phase, Internal
and external quality assurance, verification, validation.
I. Introduction
The role of the clinical laboratory is essentially to provide therapists with patient data and test results for use in clinical assessment and decision making. Measuring and improving laboratory test results require methods that correlate the total quality of laboratory information and outputs to more effective patient management, including diagnosis, treatment of disease, clinical monitoring, and disease prevention. The improvement in analytical quality, documented through proficiency testing, should guarantee that the actual performances of clinical laboratories are suitable for improving a patient’s health. Global studies and researches have shown that laboratory test results are the most frequently data used by therapists to diagnose diseases and medical cases, where around 60-70% of diagnosis are made based on laboratory tests. However, results of laboratory tests do not always represent the clinical status of patients especially when they are unexpected, surprising or do not match the complains of patients. Abnormal laboratory result may be accepted and interpreted as a sign of a disease or disorder. On the other hand, abnormal laboratory report may result from several factors other than disease. Practically, in daily clinical procedures little attention is usually given to factors that may affect the output of clinical laboratory. Generally, these interfering factors have been categorized into three main group including pre-analytical, post-analyticalanalytical and factors acting in-vivo and in-vitro.
ISSN 2250-3153
http://dx.doi.org/10.29322/IJSRP.8.11.2018.p8352
www.ijsrp.org
plan to achieve a desired goal, and it may occur during any phase of laboratory process” [1].
II. Methodology
The International Organization for Standardization (ISO) categorized the laboratory procedures into three main phases including pre-analytical, analytical, and post-analytical. Defining each phase of laboratory testing process would improve quality control methods and quality assessment programs dealing with analytical aspects of testing. However, the three main categories can be described as following:
• Pre-analytical phase is defined as the steps starting in chronological order
with test request by therapists including examination requisition, preparation of the patient, identification of specimen, collection, handling and
transportationof the primary sample and ends withanalytical examination
procedure begins.
• Analytical phase begins when the patient sample is prepared in the laboratory
for testing, followed by the processing of sample and it ends when the test result is interpreted and verified by the operator in the laboratory.
• Post analytical phase focusing in the obtained results of laboratory test,
interpreting these results fortherapists to verify the diagnosis and treatment plan.
Defining each phase of laboratory test process is an essential way to detect and prevent the errors in clinical laboratory. Utilization of quality control system and ISO guidelines would significantly reduce the errors and help the operators to determine the stage where the error occurred. Then preventive and corrective procedures will take place to ensure and prevent reoccurrence of errors during laboratory tests.
III.Discussion
Regarding the fact that laboratory testing is highly complex and accurate process, errors may occur during any phase of laboratory procedures which will significantly affect the obtained results of patients. However, the reported laboratory errors vary greatly in types and rates in the three stages of the laboratory testing process.
ISSN 2250-3153
http://dx.doi.org/10.29322/IJSRP.8.11.2018.p8352
www.ijsrp.org
food can increase the level of triglycerides by 50%, aspartate aminotransferase by 20%, bilirubin andglucose by 15%. As well as, blood glucose concentration increased as a result of increased level of gluconeogenesis, as well as, plasma renin activity and catecholamine concentrations have been found to be elevated after caffeine intake. Moreover, the acute effect of alcohol decreases serum glucose and increases serum lactate because of inhibition of gluconeogenesis. As well as, pregnancy can cause essential physiological change including; raising in plasma range up to (2600-3900 mL) and decrease albumin concentration, which have direct effect in blood chemistry and hematology laboratory tests. Also, Oestrogen increases the hepatic synthesis of binding and carrier proteins leading to increased total cortisol and total thyroxine. In addition to that, the second source of pre-analytical errors associated with sample problems including hemolysis, inadequate sample quantity and errors in sample collection are the main cause of errors at this phase with a rate of 75% for inpatients and 25 for outpatients [2]. Some clinical laboratory errors can be generated due to using of medication, interfering with laboratory results during pre-analytical and analytical phase, leading to incorrect test results.
Secondly, the analytical errors in clinical laboratory rates about (7-13%) of total errors in the lab. One of the most common error during the analytical phase is using non-suitable reference ranges or incorrect understanding of the meaning and calculation of reference limits, such as using same reference limit for different ages and sex. Samples mix is another source of error during this phase. Storage of sample is significantly affecting the test results, separation of blood sample using centrifuge should be carried out during one hour after sample collection and great attention should be paid for sample during this process. Samples should not be stored and should be protected from air contact and high temperature. For example, the temperature effect leads to incorrect lab results, where potassium releases at minimum rate at room temperature, while increasing temperature dramatically decrease the concentration of glucose [3]. Also, medical lab equipment can primary affect the results at this phase. Malfunction or non-calibrated equipment leading to wrong laboratory reports. Therefore, manufacturers recommendations and guidelines should be followed precisely to minimize errors associated to laboratory equipment.
On the other hand, post analytical errors accounting around 20% to 45% of total errors in clinical laboratory. Most common errors at this phase are related to verifying, interpreting and feeding laboratory results to the information system of the hospital. Communicating between laboratory technicians and therapists in different departments should be based on well established network to ensure high level of accuracy during delivering the laboratory report to the desired therapists. However, wrong validation, delayed laboratory results, not reported results or reported results to wrong provider are the primary causes of errors at post analytical phase. Table (1) shows the types of errors in clinical laboratory and their rates against the source of errors during the three stages of clinical laboratory process [4].
Type of Errors Ratio Source of Errors
Pre-Analytical Errors 46% to 65%
Incorrect or Insufficient sample
Incorrect identification of sample
ISSN 2250-3153
http://dx.doi.org/10.29322/IJSRP.8.11.2018.p8352
www.ijsrp.org
Analytical Errors 7% to 13% Equipment malfunction Sample mix up / Interference
Post-analytical Errors 18% to 47%
Incorrect reporting or interpretation
Incorrect data entry
[image:4.595.86.513.60.163.2]Long turnaround time
Table 1: Types and rates of error in clinical laboratory against source of errors
IV. Quality of Laboratory Procedures
The laboratory procedures must carry out under validation system for all analytical measurement and results to establish a performance characteristic for all methods and techniques used to obtain the desired target of laboratory tests, and to ensure these methods meet the requirements of ISO and quality control standardization. Also, verification of reportable ranges of test results is a significant way to establish quality system to monitor and evaluate the obtained results. It can be achieved by using at least five samples with known value to cover all possible reported ranges of the intended test. The verification should include linearity test to estimate imprecision, inaccuracy and random error which may occur during the test process. In addition to that, verification of test reproducibility is necessary to establish a high precision level of obtained results. Lab operators are responsible to run at least two level of controller for three times per each run. The calculation of precision value can be obtained by standard deviation for results values obtained from controllers and should be compared to the standard value of the manufacturer of the assay controllers. While the accuracy of analytical procedures indicates the veracity of test results. It is needed around 20 patient samples within the accepted range to be examined by new comparative method. The average value is calculated, and comparison should be carried out between old and new method, the results should be within the accepted limit to verify the accuracy of the test. On the other hand, verification of test sensitivity can be performed by using blanks reference controller for 20 times. When the results from 3 samples exceeds the blank value, the lower detection limits are accepted. This step is usually followed by running low patient samples near the lower detection limit, when at least 17 samples are above the blank reference value, it is mean that the detection limit is accepted and verified [5].
Quality control system aim to establish a well defined and documented framework for assessing and evaluating the laboratory examination procedures. To obtain the desired target of QC system, two main part should be followed in the clinical laboratory. Firstly, Internal Quality Control (IQC) program should be used for continuous checks to guarantee high level of reliability of framework, and to ensure that laboratory results doesn’t fluctuate, and the obtained results are validated before interpreted. Secondly, External Quality Assurance Program (EQAS) is a significant technique to detect gradual or sudden changes occurred during the test process such as software update or reagent reformations. Leading to early awareness of changes and prevent repeated tests due to error that may occurred. EQAS has a great potential in reducing cost related to clinical laboratory errors [5].
ISSN 2250-3153
http://dx.doi.org/10.29322/IJSRP.8.11.2018.p8352
www.ijsrp.org
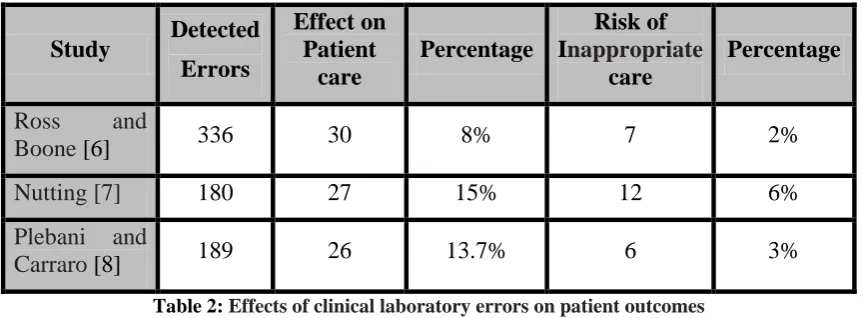
Globally, the impact of errors in clinical laboratories seem to reflect small proportion in actual patient harm and misdiagnosis due several barriers and corrective procedures between releasing of test results and decision making. However, this small percentage of error in clinical lab can directly affect a reasonable percentage of patients. The below table shows the effect of errors in clinical laboratory against patient outcomes.
Study Detected Errors
Effect on Patient
care
Percentage
Risk of
Inappropriate
care
Percentage
Ross and
Boone [6] 336 30 8% 7 2%
Nutting [7] 180 27 15% 12 6%
Plebani and
[image:5.595.83.515.152.311.2]Carraro [8] 189 26 13.7% 6 3%
Table 2: Effects of clinical laboratory errors on patient outcomes
VI. Recommendations
The success of any corrective procedures to reduce the total errors associated with laboratory results should be monitor to asset and evaluate the corrective measure taken. One suitable methodology to diagnose errors in clinical lab is the conceptual framework developed by WHO’s International Classification for Patient Safety (ICPS). Also, the implementation of Total Quality Management (TQM) is consider as an effective method to reduce errors in laboratory. Practically, TQM using three complementary actions including preventing adverse events (error prevention), making them visible (error detection), and mitigating their adverse consequences when they occur (error management). Furthermore, Failure Mode and Effect Analysis which is known as (FEMA) consider as reliable approach to promote risk management in clinical laboratory. Specifically, The U.S. Department of Veteran Affairs National Center for Patient Safety modified a simple version of FMEA to apply in health care facilities known as Healthcare FMEA (HFMEA). Another approach to manage and reduce errors in clinical lab is Root Cause Analysis (RCA) which is focusing to identify latent conditions underlying variationperformance in laboratory results [9].
VII. Conclusion
ISSN 2250-3153
http://dx.doi.org/10.29322/IJSRP.8.11.2018.p8352
www.ijsrp.org
accuracy and should be take in account before clinical diagnosis and treatment. Finally, several global approaches have been developed to reduce and control errors and performance within clinical laboratory results. Unfortunately, these approaches fail to completely eliminate the interfering of error factors in laboratory results but have a great potential to minimize errors and facilitate the interpretation of the results.
References:
1. International Organization for Standardization/Technical Specification. Medical laboratories – reduction of error through risk management and continual improvement. ISO/TS 22367: 2008.
2. Stark A, Jones BA, Chapman D, et al. Clinical laboratory specimen rejection association with the site of patient care and patients' characteristics. Findings from a single health care organization. Arch Pathol Lab Med 2007; 131:588– 92.
3. Heins M, Heil W, Withold W. Storage of serum or whole blood samples? Effects of time and temperature on 22 serum analytes. Eur J Clin Chem Clin Biochem1995; 33: 231-8.
4. Plebani M, Carraro P. Mistakes in a stat laboratory: types and frequency. Clin Chem 1997;43:1348–51.
5. Rachna Agarwal, Quality-Improvement Measures as Effective Ways of Preventing Laboratory Errors, Lab Medicine, 2014, Volume 45, Number 2
6. Lippi G, Plebani M, Šimundić AM. Quality in laboratory diagnostics: From
theory to practice. Biochem Med. 2010; 20:126-130.
7. Ross JW, Boone DJ. Institute on critical issues in health laboratory practice. Wilmington, DE: DuPont Press, 1989:173pp.
8. Nutting PA, Main DS, Fisher PM, Stull TM, Pontius M, Seifert M, et al. Problems in laboratory testing in primary care. Med Assoc , 1996;275:635–9.