Georgia State University
ScholarWorks @ Georgia State University
Public Health Theses School of Public Health
8-9-2016
An analysis of association between using solid fuel
and anemia among reproductive age women, 15-49
years old in Timor-Leste
Venancio Soares Pinto
Follow this and additional works at:https://scholarworks.gsu.edu/iph_theses
This Thesis is brought to you for free and open access by the School of Public Health at ScholarWorks @ Georgia State University. It has been accepted for inclusion in Public Health Theses by an authorized administrator of ScholarWorks @ Georgia State University. For more information, please contact
Recommended Citation
Pinto, Venancio Soares, "An analysis of association between using solid fuel and anemia among reproductive age women, 15-49 years old in Timor-Leste." Thesis, Georgia State University, 2016.
An analysis of association between using solid fuel and anemia among reproductive age women, 15-49 years old in Timor-Leste.
by
Venancio Soares Pinto
Bachelor of Medical Laboratory Science, Fiji School of Medicine
A Thesis Submitted to the Graduate Faculty Of Georgia State University in Partial Fulfillment
Of the
Requirements for the Degree
MASTER OF PUBLIC HEALTH ATLANTA, GEORGIA
i
Abstract
Introduction: In Timor-Leste, anemia affects approximately 21% of reproductive age of women. The established risk factor for anemia is poor nutritional status, but recently solid fuel use in the household has emerged as a possible risk factors. The association between
solid fuel and anemia has been studied in children and pregnant women, but there hasn’t been a study conducted to find the association among all reproductive age women from 15-49 years old.
Aim: The objective of this study is to determine if use of solid fuels (charcoal, wood, and straw/shrubs/grass) compared to cleaner fuels (electricity, LPG. natural gas, biogas, and kerosene) associate with the increasing of the prevalence of anemia among reproductive age women (15-49 years old) in Timor-Leste.
Methods: This study used data from the Timor-Leste Demographic Health Survey (TLDHS)
2009-2010. The data used was based on the individual level within household from 13 districts in Timor-Leste. Bivariable logistic regression analysis was performed to assess associations
between each independent variable (type of fuels, age group, BMI group, residence, wealth index, education level and smoking behavior) and the outcome variable (anemia) and mutlivariable logistic regression model was also performed with significant covariates.
Results: The association based on the type of fuels showed that the odds ratio for anemia in women using solid fuels was 1.73 (OR: 95% CI: 1.49 - 2.01) compared to the women using cleaner fuels. After adjustment for other covariates, the odds ratio for anemia in women that use solid fuels was 1.43 (95% CI: 1.29-1.64) compared to women using cleaner fuels.
Discussion: Based on our study population, this study found that reproductive age women 15-49 years old in Timor-Leste who used solid fuel as a source of energy for cooking or heating
activities in the household were at higher risk for anemia.
Keywords: Solid Fuel, Cleaner Fuel, Anemia, Reproductive Age of Women, Carbon Monoxide
ii
Approval Page
An analysis of association between using solid fuel and anemia among reproductive age women, 15-49 years old in Timor-Leste.
by
Venancio Soares Pinto
Approved:
Dr Christina Hemphill Fuller, ScD, MS
_____________________________
Committee Chair
Dr Matt Hayat, PhD
_____________________________
Committee Member
July 28th 2016
iii
Author’s Statement Page
In presenting this thesis as a partial fulfillment of the requirements for an advanced degree
from Georgia State University, I agree that the Library of the University shall make it available
for inspection and circulation in accordance with its regulations governing materials of this type.
I agree that permission to quote from, to copy from, or to publish this thesis may be granted by the
author or, in his/her absence, by the professor under whose direction it was written, or in his/her
absence, by the Associate Dean, School of Public Health. Such quoting, copying, or publishing
must be solely for scholarly purposes and will not involve potential financial gain. It is understood
that any copying from or publication of this dissertation which involves potential financial gain
will not be allowed without written permission of the author.
Venancio Soares Pinto
___________________
iv
Acknowledgments
I would like to begin by thanking God for giving me strength and patience throughout the
completion of this thesis. I would like to thank my family, my fiancé and friends who have given
me support and encouragement during this process.
I would like to acknowledge my committee chair Dr. Christina Hemphill Fuller for her
time, guidance, and patience and Dr. Matt Hayat for his assistance in statistical methods. In
addition, I want to thank the entire staff from the Georgia State University School of Public
Health for sharing their knowledge.
I also want to thank the Timor-Leste Government, Conoco Philips Oil Company, and the
United States government especially the State Department for giving me a chance to pursue my
graduate degree in the United States through the Fulbright Program.
v
Notice to Borrowers Page
All these deposited in the Georgia State University Library must be used in accordance with the stipulations prescribed by the author in the preceding statement.
The author of this thesis is:
Venancio Soares Pinto
The Chair of the committee for this thesis is:
Christina Hemphill Fuller, Sc.D. Assistant Professor
Environmental Health School of Public Health, Georgia State University
One Park Place Atlanta, GA 30303
404-413-1388
Users of this thesis who are not regularly enrolled as student of Georgia State University are required to attest acceptance of the preceding stipulation by signing below. Libraries borrowing this thesis for the use of their patrons are required to see that each user records here the
information requested.
vi
TABLE OF CONTENTS
Abstract ...i
Approval page ...ii
Author’s statement page ...iii
Acknowledgments ...iv
Notice to borrower’s page ...v
Table of contents ...vi
List of table ...viii
List of figures ...ix
CHAPTER I ...1
1. INTRODUCTION...1
1.1 Background ...1
1.3 Research questions ...4
CHAPTER II ...5
2. LITERATURE REVIEW ...5
2.1 Brief overview of Air Pollution ...5
2.2 Overview of solid fuel ...6
2.3 Health effects associated with pollutants from solid fuels...8
2.4 Anemia ...9
2.5 Mechanisms of solid fuel exposure and anemia ...10
2.6 Evidence of association of solid fuel exposure and anemia ...13
2.7 Social Economic Status and Anemia ...14
2.8 Demographics and Anemia ...15
2.9 Timor-Leste...16
2.9.1 Demographic ...16
2.9.2 Household energy for cooking situation in Timor-Leste ...18
CHAPTER III ...19
3. METHODOLOGY ...19
3.1 Data source...19
vii
3.3 Variables Characterization ...22
3.3.1 Type of Fuel ...22
3.3.2 Anemia ...22
3.3.3 Other Predictor variables ...22
3.4 Statistical methods ...24
CHAPTER IV...25
4. RESULTS ...25
4.1 Descriptive statistics ...25
4.2Variability of hemoglobin results among participants ...28
4.3 Bivariable analysis ...30
4.4 Mutlivariable analysis ...32
4.5 Bivariable and Mutlivariable analysis for anemia as continues variable analysis ...34
CHAPTER V ...37
5. DISCUSSION AND CONCLUSION ...37
5.1 Predictors variables and Anemia. ...37
5.2 Strengths and limitations...40
5.3 Policy implications and recommendations ...41
5.4 Conclusion ...43
viii
List of tables
Table 1 : The major source of ambient air pollution ... 5
Table 2 : Description of variables used in the study ... 23
Table 3 : Characteristics of participants in the Timor-Leste DHS delineated by anemia. ... 27
Table 4. Similarities and differences among those individuals observed and excluded from
dataset ... 29
Table 5 : Bivariable analysis of risk factors for anemia in women age 15-49 years in
Timor-Leste, 2009–2010... 31
Table 6 : Adjusted odds ratios from weighted mutlivariable analysis of risk factors for
anemia in women age 15-49 years in Timor-Leste, 2009–2010 ...33
Table 7 : Bivariable analysis of linear regression for hemoglobin as continues
in women age 15-49 years in Timor-Leste, 2009–2010 ...35
Table 8 : Mutlivariable analysis of linear regression for hemoglobin as continues
ix
List of figures
Figure 1. Oxygen disassociation curve ...12
Figure. 2. Map of Timor-Leste ...17
1
CHAPTER I
1. INTRODUCTION
1.1 Background
Every day both harmful and harmless substances are released into the atmosphere. They
can be chemical, biological or physical, and these components can be emitted from different
sources such as industrial facilities, power plants, motor vehicles, solid fuels. Still others are
naturally occurring like volcanos, fire, and windblown dust (USEPA, 2015; IEA, 2015) . All of
these substances released contribute to air pollution, and some have the potential to cause health
effects (USEPA, 2015). The common air pollutants associated with health issues include
particulate matter (PM), ground-level ozone (O3), carbon monoxide (CO), nitrogen oxides
(NOx), sulfur dioxide (SO2), lead (Pb), mercury (Hg), benzene, and polycyclic aromatic
hydrocarbons (PAHs) (USEPA, 2015). Of all these chemicals, PM is the main contributor to the
environmental health problems (Lim et al., 2015). In fact, the World Health Organization
(WHO) reported in 2010 that the average world level of PM10 in ambient air from 1600 cities in
91 countries was 71µg/mg3 with a range of 26-208 µg/mg3 per region. Approximately 3.7
million deaths globally (6.7%) were related to outdoor air pollution and even more, 4.3 million
deaths, from indoor air pollution (Lim et al., 2015). Indoor air pollution present in different
forms, starting from chemicals present in the solid fuels combustion, which mostly seen in
household in the developing countries, to chemicals compounds which can be in volatile and
2
In developing countries, the main contributor to indoor air pollution is combustion from
the solid fuels like wood, charcoal, animal dung, and crop waste which are used as energy for
cooking and space heating (Bruce, Perez-Padilla, & Albalak, 2000; WHO, 2016a). Solid fuel is
the primary choice of energy because it is affordable to most people, easy to use without vented
cooking stoves, and widely available (Desai, Mehta, & Smith, 2004). According to the
International Energy Agency (IEA), in 2015, approximately 2.5 billion people living in rural
areas of developing countries continue to rely on solid fuel as the primary source of energy.
Even though biomass fulfills the needs of many individuals in developing countries, the
disadvantages are enormous and harmful to human health (IEA, 2015).
In terms of combustion efficiency and cleanliness, solid fuel is categorized into the
lowest group in the energy group ladder, meaning that it is among the least efficient and dirtiest
of fuels. In contrast, liquefied petroleum gas and electricity are more efficient and cleanest and
are categorized into the highest group. (IEA, 2015). Solid fuel smoke contains pollutants such as
particulate matter (PM2.5 and PM10), Carbon monoxide (CO), Nitrogen dioxide (NO2),
formaldehyde, benzene, 1,3 butadiene, polycyclic aromatic hydrocarbons (such as
benzo[a]pyrene), and many other toxic organic compounds (USEPA, 2015).
Even though each type of solid fuels emits many chemicals which contribute to air
pollution, CO and PM found to be common pollutants from solid fuels (IEA, 2015). The level of
pollutant emitted from each is varies among them. In fact, a study measured the CO and PM
released from solid fuels per meal in developing countries, they found that animal dung released
64 gram per mega joule (g/MJ) of CO and and 63 g/MJ PM per meal, Crop 60 g/MJ of CO and
14 g/MJ of PM and Wood 19 g/MJ of CO and 26 g/MJ of PM per meal. (Smith, Rogers, &
3
These chemical compounds emitted have been associated with a number of health issues
including pneumonia, stroke, ischemic heart disease, chronic obtrusive pulmonary disease
(COPD), lung cancer, and anemia (WHO, 2016a; Mishra & Rutherford, 2007)
Anemia is the state in which someone’s hemoglobin level falls below 11 g/dl. When this
condition occurs, human body encounter a low oxygen concentration distributed throughout the
body, which resulting in symptoms like dizziness, fatigue, lightheadedness, low blood pressure,
malaise, or weakness, abnormal heart rate, headache, pallor and shortness of breath. (WHO,
2011). This phenomenon affects 1.62 billion people around the globe (Benoist, McLean, Egli, &
Cogswell, 2009). In 2008, the WHO and Centre for Disease Control and Prevention (CDC)
published a global report on anemia which stated that globally 47% of children under five years
old, 42% of pregnant women and 30% of non-pregnant women age from 15-49 years were
affected. These affected groups were seen highly in the Western Pacific, African and south-east
Asian countries including Timor-Leste. (Benoist, McLean, Egli, & Cogswell, 2009)
The prevalence of anemia in Timor-Leste is approximately 21% in women of
reproductive age (17.5% mild Anemia, 3.6 % moderate anemia and 0.3 % severe anemia)
Among this group of women, 28% were pregnant and 19% were not pregnant, and 25% were
breastfeeding (Lover, Hartman, Chia, & Heymann, 2014). This statistic clearly indicates that
women in Timor-Leste are at risk of anemia. The risk factor for anemia in reproductive age
women has been associated with poor nutritional status, but recently solid fuel has also been
linked to and identified as risk factor for anemia (Mishra & Retherford, 2006; Page, Patel, &
Hibberd, 2015). The association between solid fuel and anemia has been studied in children and
pregnant women, but there hasn’t been a study conducted to find the association among all
4
fuels (Charcoal, Wood, and Straw/shrubs/grass) compared to cleaner fuels (Electricity, LPG.
Natural Gas, Biogas, and Kerosene) associate with the increasing of the prevalence of anemia
among reproductive age women (15-49 years old) in Timor-Leste.
1.2 Research questions
This study aimed to conduct exploratory analyses of the following questions:
1. What is the prevalence of anemia for women in Timor-Leste?
2. What proportion of the women who use solid fuels have anemia?
3. What other factors explain the prevalence of anemia, including age, education, region,
5
CHAPTER II
2. LITERATURE REVIEW
2.1Brief overview of Air Pollution
The World Health Organization (WHO) describes air pollution as the indoor or outdoor
atmosphere polluted by any chemical, physical or biological substances capable of altering the
normal characteristics of the air in the environment (WHO, 2016a.) There are two common types
of air pollution: ambient and indoor. Ambient air pollution is the contamination of the
atmosphere in the outside environment which usually comes from mobile sources (Table 1) such
as an automobile or stationary source like manufacturing facilities and power generators, forest
fires, traffic, and volcanos (Abelsohn & Stieb, 2011). Indoor air pollution, on the other hand, is
usually associated with substances released into the environment from inside the building or a
[image:16.612.87.503.462.756.2]house and the pollutants vary depending on the type of source (Bonjour et al., 2013).
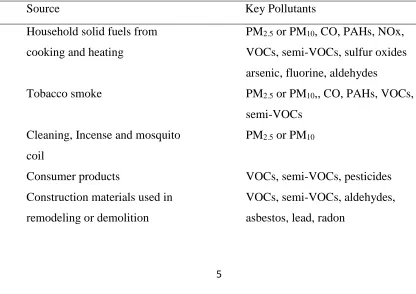
Table 1. Major sources of indoor air pollution.
Source Key Pollutants
Household solid fuels from
cooking and heating
PM2.5 or PM10, CO, PAHs, NOx,
VOCs, semi-VOCs, sulfur oxides
arsenic, fluorine, aldehydes
Tobacco smoke PM2.5 or PM10,, CO, PAHs, VOCs,
semi-VOCs
Cleaning, Incense and mosquito
coil
PM2.5 or PM10
Consumer products VOCs, semi-VOCs, pesticides
Construction materials used in
remodeling or demolition
VOCs, semi-VOCs, aldehydes,
6
Building characteristics related to
moisture, ventilation, and
furnishings
Biologic pollutants (fungal spores,
mites, cockroaches, endotoxins,
glucans)
Soil, rock, and water sources under
building
Radon
Abbreviations: PM2.5 = Particulate matter with 2.5 micrometer less than in diameter, PM10 = Particulate
matter with 10 micrometer less than in diameter, CO= Carbon monoxide, NOx =Nitrogen oxide (NO2),
PAHs = polycyclic aromatic hydrocarbons, VOCs =Volatile Organic Compounds. Source : Bonjour et al., 2013.
Of all the pollutants mentioned in Table 1 only six pollutants (Ozone (O3), Particulate
matter (PM2.5 or PM10), Carbon monoxide (CO), Nitrogen dioxide (NO2), Lead (Pb) and Sulfur
Dioxide (SO2) are currently regulated by the United States Environmental Protection Agency
(USEPA) under its national ambient air quality standards (NAAQS) (USEPA, 2015).
These chemicals possess the threat to human health. The burden of the adverse impact of air
pollution has become a significant environmental problem. In 2010, the global burden of disease
or comparative risk basement project estimated that the burden from air pollution accounted for
approximately 4.3 million deaths by household air pollution and 3.7 million death from ambient
air pollution (Lim et al., 2015). These burdens are seen highly in developing regions like South
Asia, East Asia, Southeast Asia, and African countries, where PM from solid fuel is used as the
primary source of pollution. WHO, 2016a; Chafe et al., 2014).
2.2Overview of solid fuel.
Generally, in developing countries, households engage a single or combination type of
energies for cooking, heating and lighting (IEA, 2016). Energy used consists of electricity, gas
7
petroleum gas), and solid fuel. Solid fuels refer to the type of fuel that produce energy from solid
materials such as coal, lignite, charcoal, wood, straw, shrubs, grass, agricultural crop and animal
dung (Sood, 2012; IEA, 2016). In developing countries where people have restricted access to the
cleaner forms of energy such as electricity, LPG. natural gas, biogas, and kerosene, solid fuels
become the primary choice as the source of energy in the households because they are readily
available and affordable to most people (IEA, 2016).
The use of solid fuel in developing countries is mostly for cooking and indoor heating
carried out by women as well as children, but rarely men (Sood, 2012;) The population most
affected by solid fuel smoke is commonly associated with women and children because they spend
most of the time in the domestic arena, specifically, in the kitchen cooking. Children usually tag
along or are carried on their mothers’ back as the mother performs these activities (Sood, 2012;
IEA, 2016). The cultural practice of women spending more time in the kitchen and caring for
children while cooking introduces them into greater risk of health problems associated with solid
fuels. Because not only the due to the time spend in the kitchen, but during cooking they also used
solid fuel on unimproved cooking stoves and unventilated kitchen, which increase the risk or
exposure (Legros et al., 2009). While in developed countries, solid fuel is used for residential
heating to which men, women, and children are exposed, the concentration of pollutants released
during heating is lower than cooking. (IEA, 2016; Legros et al., 2009)
Solid fuel used in households has declined drastically over the past decades. In fact, a
study conducted by Bonjour et al. (2013) estimated that the solid fuel use in households for
cooking alone among 150 countries around the world from the year of 1980 – 2010 declined from
61% to 41%. Despites it decline over decades, the change is seen in developed countries and not in
8
depends on the socioeconomic status of the country and people living in the household (IEA,
2015; Legros et all, 2009). A WHO report in 2013 indicated that solid fuel use in the household
was less than 10% seen in developed countries such as the United States and European countries,
while it was higher among Africa regions (79 %) and 60% of Southeast Asia regions (WHO,
2016c).
Among Southeast Asia regions, Timor-Leste is the highest user of solid fuels in
households. The statistics show that 93% of the population still relies on solid fuel and it accounts
for 95% of population living in the rural and 81% of the urban area. In addition to Timor-Leste, in
Vietnam 47% of the population still depends on the solid fuel (61% urban and 16 % rural),
Indonesia 39 % of the population (65% rural and 16 % urban), and Thailand 23% of the
population (31 % from rural and 13 % urban) (WHO, 2016c; World Bank, 2007).
2.3Health effects associated with pollutants from solid fuels
Many studies within the literature report strong association between solid fuel use and
health effects. Most derive from epidemiologic studies and toxicological studies in animals.
Acute lower respiratory infection(ALRI) in association with solid fuel use is found in children
less than five years old. (Sood, 2012). This group is susceptible because of their lower immune
system and probably lack of proper hygiene, and spending more time with their mother in the
kitchen (Sood, 2012). In fact, a case-control study conducted in Nepal found that children in the
case group where their house used solid fuel like wood and coal as a source of energy showed a
significant association with ALRI (Bates et al. 2013). Similarly, a meta–analysis compiled 24
studies from Africa, Latin American and China, also found that children less than five years old
living in the household that used solid fuel indicated a significant correlation relationship with
9
time spent in the kitchen with their mothers and proximity to the stove while the cooking
activities were ongoing.
Additionally, solid fuel use was found to be the single risk factor for chronic obstructive
pulmonary disease (COPD) in less economically developed countries. As pointed out by Kurmi
and colleagues (2010) on a meta-analysis that adult women who exposed to solid fuel had
approximately 3 times more to have COPD (95% CI:1.85-4.0) as compared to cleaner fuel, and
wood as fuel choice which had 4.29 times more significant risk to acquire COPD (95% CI 1.35
-13.70) than another type of fuel.
Moreover, some systematic reviews and meta-analysis have also been conducted to link
both developed and developing countries. These studies selected solid fuel (wood and coal) for
cooking and heating as the primary exposure and correlated the development of lung cancer. The
first study was based on data from the International Lung Cancer Consortium (ILCCO) and
represented North America, Asia, and Europe and revealed that women exposed to solid fuel
showed higher risk of lung cancer than men and that Asian populations had a greater risk than
whites or other groups (Hosgood et al., 2010). Besides ILCCO findings, a case control study
carried out among women in India also reported that women who exposed to solid fuel were
more susceptible to the development of lung cancer than unexposed women (Behera &
Balamugesh, 2005).
2.4 Anemia
Anemia is a public health problem across developing countries, and mostly women and
children are affected. Anemia is defined as a lack of red blood cells in the blood or person having
10
across organs in the body. (Benoist, Mclean, Egli & Cogswel, 2009). This condition is
commonly seen in women in of reproductive age worldwide. Anemia affects 24.8 % of
populations in developing countries, about 47.4 % are children under 5 years old, 41% pregnant
women and 30.2% are non-pregnant women, and iron deficiency anemia, which is common
subtype form of anemia seen among these group. (Balarajan et al., 2011).
The risk factors for anemia are varied among women; it can be due to a person’s poor
diet, ability to absorb iron, pregnancy, blood loss or genetic diseases (Benoist et al., 2009).
However, recent studies have linked solid fuel exposure as a risk factor for anemia (Mishra &
Rutherford, 2006; Page, Patel, & Hibberd, 2015).
2.5 Mechanisms of solid fuel exposure and anemia.
The notion of solid fuel use causing anemia in women and children is very new and the
mechanism is not well known. The mechanism is believed to take place as certain chemicals
present in solid fuel combustion enter the human body and induce the hemoglobin process
(Blumenthal, 2001; Dutta, Ray,& Banerjee 2012). There are numbers of pollutants released from
solid fuel combustion, but the most common pollutant that has potential binding capability to
hemoglobin (Hb) and ability to cause anemia is carbon monoxide (CO). CO is a colorless,
non-irritant, and odorless gas. It results from incomplete combustion of solid fuels, petrol, natural gas
and kerosene. CO is also one of the pollutants in ambient air that is regulated by USEPA.
USEPA set an 8 hour exposure limit of 9 part per million (ppm) and an hour exposure limit of 35
ppm from the environment. This exposure level should not be exceeded more than once per year
11
When people are exposed, they inhale many pollutants including CO, which is the main
contaminant chemical. When CO is inhaled from solid fuel combustion, it dissolves in the blood
and immediately binds to adults’ hemoglobin in their red blood cells and forms
carboxyhemoglobin (COHb). The binding speed or affinity of CO to Hb is faster compared to
oxygen, and CO bonding with Hb tends to bond longer than oxygen in the Hb binding site. Thus,
as the CO concentration increases in the bloodstream, it reduces the oxygen storage function of
hemoglobin and the oxygen transportation function of COHb which results in less oxygen being
delivered to the tissues (Blumenthal, 2001). When there is limited oxygen in the tissue, the
hemoglobin production also decreases which leads to anemia.
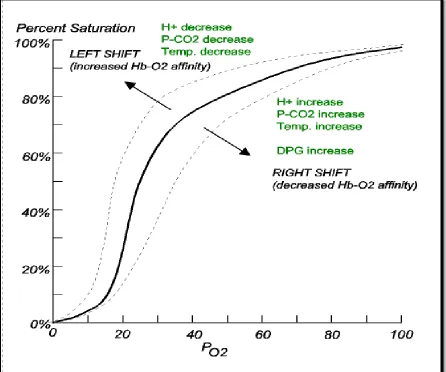
In the oxygen dissociation curve (Figure 1), when oxygen saturation in the human body is
low due to high concentration of CO, the curve of the graph to shifts to the left (Figure 1) which
is similar if a person is anemic. The curve of patient also shifts to the left with low concentration
12
Figure 1. Oxygen disassociation curve
(Source : http://www.acbrown.com/lung/Lectures/RsBldg/RsBldgOxgnNoteB5y.htm)
Another way that combustion gases from solid fuel cause anemia is believed through
triggering systemic inflammation. Chemicals such as CO, transitional metals, ultrafine particles
(UFP, < 0.1 μm in diameter), PM2.5, and PM10 are capable of inducing systemic inflammation
(Page at al, 2015; Dutta, Ray, & Banerjee, 2012). It occurs when people are exposed to gases,
systemic inflammation is trigger by mediator by inflammatory cytokines like tumor necrosis
13
initiated. As soon as the systemic inflammation is activated, it causes the inflammatory cytokines
levels to increase. In fact, Dutta, Ray and Banerjee (2012) insist that women who are exposed to
solid fuel tend to have a high level of inflammatory cytokines like alpha (TNF-α), interleukin-1
(IL-1) and interleukin-6 (IL-6) (Dutta, Ray, & Banerjee, 2012). Thus, when the inflammatory
cytokines level is raised, it causes dysregulation of iron hemostasis, impairs proliferation of
erythroid progenitor cells, reduces erythropoietin response, and shortens the red blood cells’ life
span. All of which contribute to developing anemia (Ying-Ying et al., 2014; Dutta, Ray, &
Banerjee, 2012).
2.6 Evidence of association of solid fuel exposure and anemia
The association of solid fuel exposure and anemia among women in their reproductive
years is understudied. So far only a handful of studies have been conducted and have found
exposure to solid fuel combustion among pregnant women and children which associated with
anemia. We discuss studies and their findings regarding the exposure to solid fuel resulting in
anemia in women. First, the most vulnerable group is pregnant women. In developing countries,
the risk of multiple diseases is high among the population living in rural areas with low
socioeconomic status. Page, Patel and Hibberd (2015) conducted a prospective cohort study with
rural pregnant women in Nagpur, India and recorded their pregnancy outcomes until six weeks’
post-partum from May 2011 to June 2013. They evaluated solid fuel use as an independent risk
factor for anemia among pregnant women. They found that of the 56 percent of all women who
used solid fuel 90.5 percent were anemic. Of this number 43.1 percent were mildly anemic and
47.4 had moderate to severe anemia. They argue that pregnant women who were using solid fuel
for cooking might have an increased risk of anemia because the chemical from the combustion
14
anemia in children has also been linked to combustion from solid fuel. A study based on the
national level of child anemia of 29 developing countries year 2003-2007 used cross-sectional
DHS to determine the association between solid fuel smoke exposure and childhood anemia.
The study reported that 79% of children age 0-49 months who were exposed to solid fuel at
home had a strong association with mild and moderate to severe anemia, 24% and 39 %
respectively. Similarly, a study led by Mishra and Rutherford (2014) used data from India’s
second National Family Health Survey ( NFHS-2) year 1998-1999 to examine the association of
using solid fuel and anemia among children age 0-35 months. The study revealed that of the 71
% of children, 23% were mildly anemic and 48% were moderate to severely anemic. Both
studies on children revealed the same notion that affected children spent more time with their
mothers during cooking activities.
2.6Social Economic Status and Anemia
Socio-economic status (SES), such as wealth and level of education, play a major role in
achieving a healthy life style among most women. Many women of reproductive age in
developing countries who live in rural areas and have low SES encounter difficulties in
maintaining their health status. (Page et al., 2015). Anemia is one of the common health issues
correlated with women in low SES households and with high illiteracy. This situation is clearly
seen in India, where women who lived in urban and rural areas with a low standard of living or
poor wealth index had high prevalence of mild (33.9% vs 42.0%), moderate (14.9% vs 17.7%),
and severe (2.2% vs 2.8%) anemia when compared to other women who lived with medium and
high standards of living (Bentley & Griffiths, 2003). In another part of Asia, anemia among girls
15
et al., 2014). Both studies revealed that these women live in difficult situations to maintain their
health status because the household needs are far more important than their personal needs.
In term of level of education, illiterate women or women with no formal education were
more likely to have anemia than those who had a formal education. Bentley and Griffits (2003)
indicated in their study that 96% of illiterate pregnant women were shown to have anemia from
mild to very severe levels with an approximation of 56 percent in the severe anemia group. Their
study argued that this phenomenon occurred due to limited information or lack of awareness
about anemia.
2.7 Demographics and Anemia
According to the WHO, women’s anemia can be determined through demographic
variables such as age, BMI, and smoking. When looking at women’s age in relationship with
anemia, women aged 25-60 and beyond 60 are more affected compared to younger women aged
15-25 years old (Morsy &ALhays (2014). In a study among non-pregnant, ever-married women
conducted in Bangladesh , women age 30 – 49 years had higher percentages of anemia (43.6%)
than younger women (38.6%) (Kamruzzaman et al., (2015). The authors argued that a majority
of women age 30-49 have young children who are dependent on them for needs. This situation
restricts them from prioritizing their health needs and instead focusing on their children, which
may result in anemia. Similarly, in Gazira state region, Sudan women age 35 – 49 were more
vulnerable to anemia because of the lack of proper focus on health needs (Morsy &ALhays
(2014).
Additionally, women categorized as underweight, overweight and obese women are more
16
Lukanova, 2004). The authors explain that these women were prone to anemia because of lack of
nutritional intake like serum ferritin, iron, vitamin B12, folates, as well as increased level of
estrogen which may contribute to the reduction of red blood cell production (Qin et al., 2013;
Thankachan et al., 2007; Lukanova, 2004).In fact, a study conducted among young women from
low SES in Bangalore, India indicated a significant prevalence of anemia and iron deficiency
anemia, 39% and 62% respectively were due to a lack of iron supplements.
Furthermore, approximately 250 million women smoke worldwide, with 9 percent
accounted for women from developing countries, which most of them are of reproductive age
and about 22 percent from developed countries (WHO, 2016d). Smoking has been identified as a
risk for many health issues including cancer, chronic disease and anemia. (EPA, 2015) Anemia
tends to develop among those who have active and long-term exposure to cigarettes. (Leifert,
2008). Cigarette burning releases CO which is known to bind to Hb. The mechanism of CO
causing anemia from smoking would similar to that of CO inhaled from solid fuel (Leifert, 2008;
Blumenthal, 2001).
2.9 Timor-Leste
2.9.1 Demographics
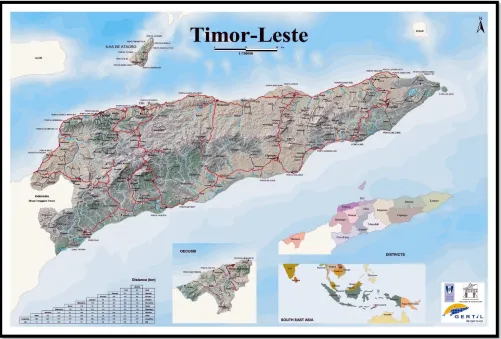
Timor-Leste is a newly independent country having achieved independence from
Indonesia in 2002 (National Statistics Directorate, 2013). It’s located in Southeast Asia, and
shares a land border with Indonesia archipelago. The eastern side of the country is located close
to the northwest of Australia. The country has a population of 1.2 million which occupies the
land of 14,919 km2. The proportion of population based on sex is distributed equally and
approximately 43 percent are under 14 years old. Timor-Leste (Figure 4) is divided into 13
Timor-17
Leste’s population lives in rural area, approximately 70%, and only 30% in urban areas. The
capital of Timor-Leste is Dili and Tetun, and Portuguese is the official language while English
and Indonesia are working languages (National Statistics Directorate, 2013).
Looking at the economy of the country, the gross domestic product (GDP) of
Timor-Leste was estimated approximately US$4,941 million and US$4,361.6 million for GDP per
capita. The poverty in Timor-Leste is mostly seen in the rural areas as opposed to urban due to
low agriculture productivity and limited access to the roads and transportations. The rate of
urbanization is relatively low (4.25% annually) and approximately 40% of the population is
[image:28.612.63.564.323.662.2]illiterate. (IMF, 2012).
18
2.9.2 Household energy for cooking situation in Timor-Leste.
Timor-Leste’s main source of fuel for power generation is fossil fuel. However, wood
fuel is still is the main fuel for cooking and heating activities almost all households (The World
Bank, 2010). Approximately 98% of all the households in both rural and urban areas used wood
fuel as the main cooking fuel. In the rural area, about 80 percent of households obtain and collect
the wood from the nearest forest while 60 percent of households in urban areas purchase the
wood. Approximately 600,000 tons/year of wood fuel is consumed in Timor-Leste (WHO,
2016b; The World Bank, 2010).
Solid fuel use predominantly become major source of energy fuel in Timor-Leste for
various reason. First, it’s the cheapest and accessible type of fuel to most household. Second,
majority of population living in the rural area have limited access to electricity which leaves
them with wood as the only choice. Third, nearly half of the population living under the poverty
line with an estimated income of $0.88 per capita per day. Other fuels like electricity and LPG
are available in the country but mostly seen in the capital city Dili in commercial sectors such as
19
CHAPTER III
3. METHODOLOGY
3.1 Data Source
This study will use data from the Timor-Leste Demographic Health Survey (TLDHS)
2009-2010. The data was obtained from the United States Agency for International Development
(USAID) website
http://dhsprogram.com/data/dataset/Timor-Leste_Standard-DHS_2009.cfm?flag=0
The target population for sampling was men and women age 15-49 years old, and the
data was collected by administrating a survey at both the household and individual levels. The
main objective of the survey was to estimate demographics and health conditions at national and
regional levels (13 districts).
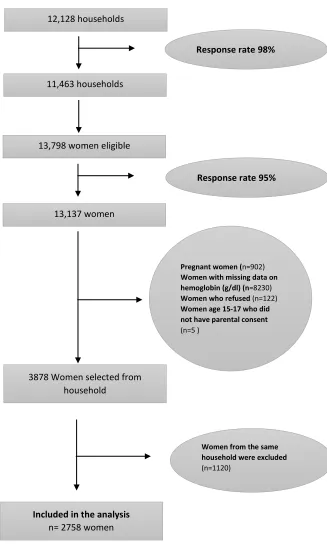
3.2 Study design and participants
This study used a cross-sectional study design, and the sample was selected based on a
stratified two-stage cluster design. A flow diagram of the selection process is presented in figure
3. In the first cluster, 455 enumeration areas were selected consisting of 116 urban and 339 rural
areas. In the second stage, a systematic random sampling of households from each cluster was
selected, and the final sample was 12,128 households. The selected households were then visited
and 98% of households participated (N= 11,463). Then eligible women 15-49 were randomly
selected and interviewed from one-third of the households selected with a total of 13,798
women. The response rate among eligible women was 95% totaling 13,137 participants.
There are some exclusions from the dataset before analysis. Firstly, participants who
were pregnant (n=902) when the study was conducted were excluded. Secondly, participants or
20
refused to participate in hemoglobin testing (n=122) and women age between 15 – 17 years, who
did not provide parental consent (n=5) were excluded from the analysis. Lastly, since this study
used an individual dataset from the household, the probability of participants selected from the
same household were likely to occur. Hence, only one participant from a household was selected
for this study (n=1120). The final dataset for analysis contains 2,758 observations, and all
21
Figure 3. Sampling flow diagram of participants in the study.
Pregnant women (n=902) Women with missing data on hemoglobin (g/dl) (n=8230) Women who refused (n=122) Women age 15-17 who did not have parental consent (n=5 )
13,137 women
3878 Women selected from household
12,128 households
11,463 households
13,798 women eligible
Response rate 98%
Included in the analysis
n= 2758 women
Response rate 95%
22
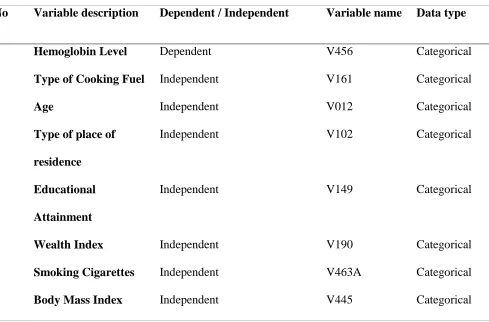
3.3 Variable Characterization
3.3.1 Type of fuel.
Exposure to combustion from cooking fuel is the exposure of interest and is estimated by
looking at fuel type. The types of cooking fuels recorded were electricity, liquefied petroleum
gas (LPG), natural gas, biogas, kerosene, coal/lignite, charcoal, wood, straw/shrubs/grass,
agricultural crop, and animal dung. The fuels were then categorized into two groups. The first
group was the cleaner fuel which consisted of electricity, liquefied petroleum gas (LPG), natural
gas, biogas, and kerosene. The solid fuel was the second group which consisted of coal /lignite,
charcoal, wood, straw/shrubs/grass, agricultural crop, and animal dung (National Statistics
Directorate, 2010).
3.3.2 Anemia
The anemic status of women participants was based on hemoglobin (Hb) concentrations
in grams per deciliter(g/dl) . The measurement of hemoglobin concentration was performed
using HemoCue® Hb 301 system among women who agreed and signed the consent letter
(National Statistics Directorate, 2010). The Hb level was categorized as women not having
anemia with Hb greater than 11 g/dl and having anemia with Hb less than 11 g/dl (WHO, 2011).
3.3.3 Other predictor variables.
Anemia among women of reproductive age may also be influenced by other factors
including their age, body mass index (BMI), residence type (rural vs. urban), wealth index,
education level and smoking behaviors. The variable age was categorized into four groups
including the groups of 15-24, 25-34, 35-44 and 45-49 years of age. BMI was categorized as
Normal (BMI = 18.5 - 24.99), Underweight (BMI < 18.5), Overweight (BMI 25.00-29.99) and
23
Moreover, the socioeconomic status of participants like wealth index and educational
attainment were also re-categorized. Those women who were in the poorest and the poor class
was treated as Low Wealth Index; middle-class women treated as Middle Wealth Index, and the
rich and the richest classes as High Wealth Index. Educational attainment was categorized as No
education, Primary level (incomplete and complete primary), Secondary level (incomplete and
complete secondary) and Higher level. Furthermore, smoking behavior was categorized based on
interview results either Yes or No response if they had smoked in the preceding 24 hours when
[image:34.612.84.573.343.665.2]the survey was conducted.
Table 2. Description of variables used in the study.
No Variable description Dependent / Independent Variable name Data type
1 Hemoglobin Level Dependent V456 Categorical
2 Type of Cooking Fuel Independent V161 Categorical
3 Age Independent V012 Categorical
4 Type of place of
residence
Independent V102 Categorical
5 Educational
Attainment
Independent V149 Categorical
6 Wealth Index Independent V190 Categorical
7 Smoking Cigarettes Independent V463A Categorical
24
3.4 Statistical analysis
Statistical analysis in this study was performed using the Statistical Analysis System
(SAS) Version 9.4. The measure of association is the Odds Ratio with 95% confidential
intervals, and α = 0.05 will be considered significant. The descriptive analysis of all the
independent variables was performed to examine the frequency distribution of each variable.
The outcome variable was classified as binary outcomes. Thus, the logistic regression model has
been performed to examine the association between the independent variables and outcomes of
interest.
Since DHS data used a complex sampling method, sampling weights as applied to each
analysis performed. The reason for using weight was to account for probabilities of differential
misclassification and inclusion for individuals in the study sample. The sampling weight variable
was based on the recommendation from DHS that sample weight (V005) should be divided by
1,000,000 (National Statistics Directorate, 2010).
In the analysis, there will be two model stages of analysis. In the first stage, a bivariable
logistic regression analysis was performed to assess associations between each independent
variable (Type of fuels, Age group, BMI group, residence, wealth index, education level and
smoking behavior) and the outcome variable (Anemia). In the second stage of the analysis, a
mutlivariable logistic regression model was performed. Those variable found to be significant in
the bivariable analysis were included in the mutlivariable analysis.
25
CHAPTER IV
4. RESULTS
4.1 Descriptive Statistics
This study used Timor-Leste DHS data from 2009-2010. A total of 2,758 women aged
15 – 49 years old were included in the study. The characteristics of participants delineated by
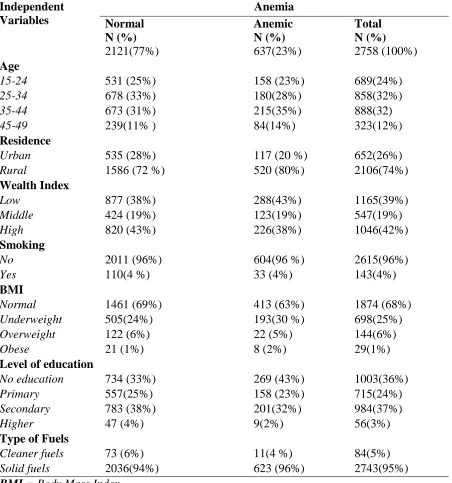
anemia is presented in Table 3. Of all the women who participated in this study, 23% women
were anemic and 77% women were not. When observed anemia among women based on the
type of fuel which the main analysis for this study, those women who used solid fuel in the
household were the largest group affected as opposed to those who used cleaner fuel (96 % and
4% respectively). On the other hand, those women who were normal and used solid fuel were
94% and 6% were cleaner fuel.
By women’s age, among those were affected with anemia, the 35-44 age group had the
highest proportion of women affected with anemia (35%) followed by 25-34 age group (28%),
15-24 age group (23% and the 44-49 age group were the least affected (14%). When compared
to those women who were not affected, 25-34 age group had 33%, 35-44 age group had 31%,
15-24 age group had 25% and the least was 45-49 age group with 11% were affected.
In terms of the women’s residence, women who were affected and lived in urban areas
had a higher percentage of anemia than women who lived in rural areas (80% and 20%,
respectively). While those women who weren’t affected by anemia, still those who lived in the
rural areas were greater that urban areas (72% and 28%, respectively).
Moreover, by looking at wealth index, the low wealth index women had the highest
26
affected group. When comparing to women who didn’t have anemia, rich wealth index was the
highest (43%) than poor and middle (38% and 19% respectively).
When examining anemia among women based on the level of education, women who
were affected by anemia and without a formal education background was the group most
affected by anemia (43%), followed by secondary level of education (32%), primary level of
education (23%) and highest level of education group (2%). On the other hand, those women
who were not anemic, secondary level of education were the highest (38%) followed by those
who didn’t have formal education (33%), primary level of education (25%) and higher education
level (4%).
Additionally, in term of women’s body mass index, women with a normal BMI had
63% of anemia, underweight women had 30%, overweight women had 5%, and 2% of obese
women had anemia. When compared to normal or anemia free group of women in this study,
normal BMI still had the highest proportions (69%), followed by underweight (24%), overweight
(6%) and obese women (1%).
Furthermore, women who did not smoke had the highest proportion of anemia compared
to those who did smoke (3%). On the other hand, among those women who were not anemic,
27
Table 3. Characteristics of participants in the Timor-Leste DHS delineated by anemia.
Independent Variables Anemia Normal N (%) Anemic N (%) Total N (%)
2121(77%) 637(23%) 2758 (100%)
Age
15-24 531 (25%) 158 (23%) 689(24%)
25-34 678 (33%) 180(28%) 858(32%)
35-44 673 (31%) 215(35%) 888(32)
45-49 239(11% ) 84(14%) 323(12%) Residence
Urban 535 (28%) 117 (20 %) 652(26%)
Rural 1586 (72 %) 520 (80%) 2106(74%) Wealth Index
Low 877 (38%) 288(43%) 1165(39%)
Middle 424 (19%) 123(19%) 547(19%)
High 820 (43%) 226(38%) 1046(42%) Smoking
No 2011 (96%) 604(96 %) 2615(96%)
Yes 110(4 %) 33 (4%) 143(4%)
BMI
Normal 1461 (69%) 413 (63%) 1874 (68%)
Underweight 505(24%) 193(30 %) 698(25%)
Overweight 122 (6%) 22 (5%) 144(6%)
Obese 21 (1%) 8 (2%) 29(1%)
Level of education
No education 734 (33%) 269 (43%) 1003(36%)
Primary 557(25%) 158 (23%) 715(24%)
Secondary 783 (38%) 201(32%) 984(37%)
Higher 47 (4%) 9(2%) 56(3%)
Type of Fuels
Cleaner fuels 73 (6%) 11(4 %) 84(5%)
Solid fuels 2036(94%) 623 (96%) 2743(95%) BMI = Body Mass Index.
28
4,2. Variability of hemoglobin results among participants
In our study population, approximately 2/3 of data were excluded from the final data set
due to lack of hemoglobin results. This condition will likely to introduce variability among
covariate in this study. Hence, we also conducted test to observe the similarities and differences
for those individuals observed and missing data for each covariate included in this analysis
presented in Table 4.
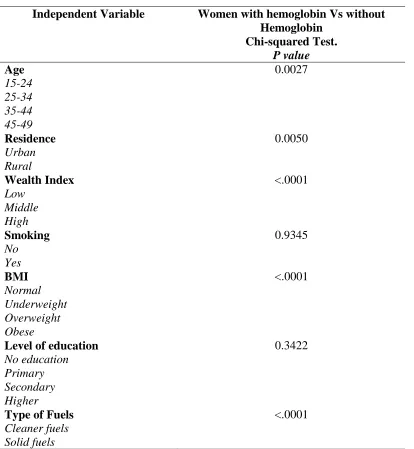
We found that the differences between women with hemoglobin and without hemoglobin
were significantly different from each level for each type of covariate in this study. Age has p
value = 0.0027, residence has p value = 0.005), wealth index has p value = <.0001, BMI has =
<.0001) and type of fuel has p value = <.0001.
On the other hand, there were not significantly different among women with hemoglobin
and without hemoglobin found on the level of education ( p value = 0.3422) and smoking group
29
Table 4. Similarities and differences among those individuals observed and excluded from
dataset.
Independent Variable Women with hemoglobin Vs without
Hemoglobin Chi-squared Test.
P value
Age 0.0027
15-24 25-34 35-44 45-49
Residence 0.0050
Urban Rural
Wealth Index <.0001
Low Middle High
Smoking 0.9345
No Yes
BMI <.0001
Normal Underweight Overweight Obese
Level of education 0.3422
No education Primary Secondary Higher
Type of Fuels <.0001
30
4.2 Bivariable analysis
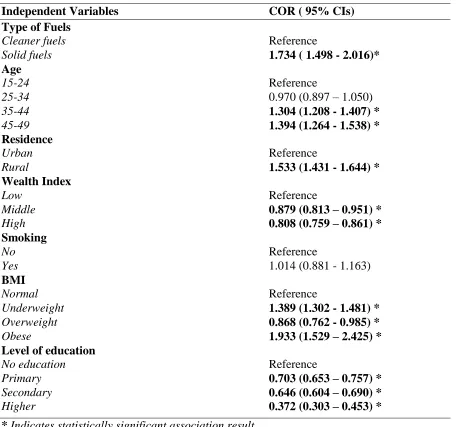
Table 5 displays results of weighted bivariable logistic regression analyses explaining
prevalence of anemia in women aged 15-49 in Timor-Leste between 2009 and 2010. When
analyzing the association based on the type of fuels, the odds ratio for anemia in women using
solid fuels was 1.73 (95% CI: 1.49 - 2.01) compared to women using cleaner fuels. By age
group, both 35-44 and 45-49 age group were 1.30 and 1.39 times as likely to have anemia
compared to the 15-24 age group.
By residence, the odds ratio for anemia among women living in the rural areas was 1.5
(95% CI: 1.43-1.64) compared to women living in urban areas. In addition to residence, the odds
ratio of women’s wealth index showed that both middle and rich classes were 0.88 and 0.80
times less likely to anemia than those women in the poor class.
Moreover, in term of level of education, women who had primary, secondary and higher
level of education had the lower odds ratio (0.70, 0.65 and 0.37 respectively) of having anemia
compared to those women without any formal education.
Looking into the women BMI’s, obese (1.93) and underweighted women (1.39) had a
higher chance of having anemia compared to those women with a normal BMI. On the other
hand, the odds ratio of having anemia among overweight women was lower (0.87) compared to
those women with a normal BMI.
Furthermore, in term of smoking behaviors, there was no statistically significant
difference in anemia comparing women who smoke to those that do not ; 1.01 (95% CL: 0.88 -
31
Table 5. Bivariable analysis of risk factors for anemia in women age 15-49 years in Timor-
Leste, 2009–2010.
Independent Variables COR ( 95% CIs)
Type of Fuels
Cleaner fuels Reference
Solid fuels 1.734 ( 1.498 - 2.016)* Age
15-24 Reference
25-34 0.970 (0.897 – 1.050)
35-44 1.304 (1.208 - 1.407) *
45-49 1.394 (1.264 - 1.538) *
Residence
Urban Reference
Rural 1.533 (1.431 - 1.644) * Wealth Index
Low Reference
Middle 0.879 (0.813 – 0.951) *
High 0.808 (0.759 – 0.861) *
Smoking
No Reference
Yes 1.014 (0.881 - 1.163)
BMI
Normal Reference
Underweight 1.389 (1.302 - 1.481) *
Overweight 0.868 (0.762 - 0.985) *
Obese 1.933 (1.529 – 2.425) *
Level of education
No education Reference
Primary 0.703 (0.653 – 0.757) *
Secondary 0.646 (0.604 – 0.690) *
Higher 0.372 (0.303 – 0.453) * * Indicates statistically significant association result.
COR = Crude or Unadjusted Odds Ratio with 95% Confidential Intervals with significant
level = 0.05.
32
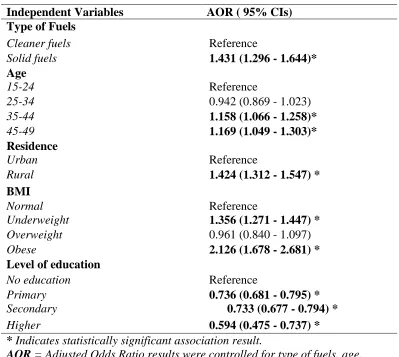
4.3 Multivariabe Analysis.
Table 6 illustrates the result of a mutlivariable logistic regression model which included
all the independent variables (Type of fuel, Age, Residence, Wealth Index, BMI, and Level of
education) that were significantly associated with anemia in the bivariable analysis. After
inclusion in single model predictors remained significant.
After adjustment for other variables, the odds ratio for anemia for women that use solid
fuel was 1.43 (95% CI: 1.29-1.64) compared to the cleaner fuel users. When examining the age
group of users, the odds ratio for both age groups 45-49 and 35- 44 (1.17 and 1.16 times
respectively) were more likely to have anemia than age group 15-24.
Moreover, for women who live in the rural areas, the odds ratio for having anemia was
1.42 (95% CI: 1.31 – 1.55) compared to those lived in the urban areas. Obese women had 2.12
times higher odds of anemia and underweight women a 1.36 higher odds of anemia compared to
women of normal weight. Overweight women did not have a difference in risk compared to
normal weight women (0.96 [95% CI: 0.84-1.09]).
Furthermore, in term of level of education, after the adjustment for the other variables,
the odds ratio for women with formal education including Primary, Secondary and Higher level
of education ( 0.74, 0.73, and 0.59 times respectively ) were less likely to have anemia when
33
Table 6. Adjusted odds ratio from weighted mutlivariable analysis of risk factors for
anemia in women age 15-49 years in Timor-Leste, 2009–2010.
Independent Variables AOR ( 95% CIs)
Type of Fuels
Cleaner fuels Reference
Solid fuels 1.431 (1.296 - 1.644)* Age
15-24 Reference
25-34 0.942 (0.869 - 1.023)
35-44 1.158 (1.066 - 1.258)*
45-49 1.169 (1.049 - 1.303)* Residence
Urban Reference
Rural 1.424 (1.312 - 1.547) * BMI
Normal Reference
Underweight 1.356 (1.271 - 1.447) *
Overweight 0.961 (0.840 - 1.097)
Obese 2.126 (1.678 - 2.681) * Level of education
No education Reference
Primary 0.736 (0.681 - 0.795) *
Secondary 0.733 (0.677 - 0.794) *
Higher 0.594 (0.475 - 0.737) * * Indicates statistically significant association result.
AOR = Adjusted Odds Ratio results were controlled for type of fuels, age,
residence, smoking behaviors, BMI, level of education.
CIs= Confidential Intervals with significant level = 0.05. BMI = Body Mass Index.
34
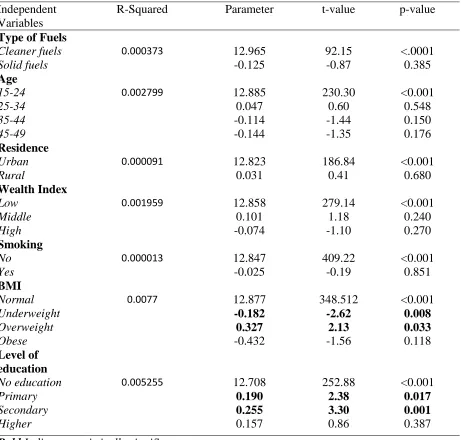
4.4 Bivariable and multivariable analysis of risk factors for hemoglobin as continues
variable among women age 15-49 years in Timor- Leste, 2009–2010.
Table 7 displays bivariable linear regression model of anemia as continues variable. The
study found that only BMI and level of education were associated with anemia. In term of BMI,
underweight and overweight women (p- value, 0.008 and 0.033 respectively) were statistically
significantly associated with anemia. When looking into level education, only primary and
secondary level of education women (p- value, 0.017 and 0.001 respectively) found to be
associated with anemia.
Moreover, the multivariable analysis of linear regression presented in Table 8. The table
only displayed the variable that found statistically significant in the bivariable analysis. Women
with BMI level identified as underweight and overweight (p- value, 0.013 and 0.043
respectively) were statistically significantly associated with anemia. In addition to BMI, women
with the primary and secondary level of education (p- value, 0.021 and 0.002 respectively)
remained as the group found to be significantly associated with anemia even adjusted for
35
Table 7. Bivariable analysis of linear regression for hemoglobin as continues in women age 15-49 years in Timor-Leste, 2009–2010.
Independent Variables
R-Squared Parameter t-value p-value
Type of Fuels
Cleaner fuels 0.000373 12.965 92.15 <.0001
Solid fuels -0.125 -0.87 0.385
Age
15-24 0.002799 12.885 230.30 <0.001
25-34 0.047 0.60 0.548
35-44 -0.114 -1.44 0.150
45-49 -0.144 -1.35 0.176
Residence
Urban 0.000091 12.823 186.84 <0.001
Rural 0.031 0.41 0.680
Wealth Index
Low 0.001959 12.858 279.14 <0.001
Middle 0.101 1.18 0.240
High -0.074 -1.10 0.270
Smoking
No 0.000013 12.847 409.22 <0.001
Yes -0.025 -0.19 0.851
BMI
Normal 0.0077 12.877 348.512 <0.001
Underweight -0.182 -2.62 0.008
Overweight 0.327 2.13 0.033
Obese -0.432 -1.56 0.118
Level of education
No education 0.005255 12.708 252.88 <0.001
Primary 0.190 2.38 0.017
Secondary 0.255 3.30 0.001
Higher 0.157 0.86 0.387
Bold Indicates statistically significant
association result.
36
Table 8. Mutlivariable analysis of linear regression for hemoglobin as continues in women age 15-49 years in Timor-Leste, 2009–2010.
Independent Variables
R-Squared Parameter t-value p-value
BMI
Normal 0.0125 12.747 228.88 <0.001
Underweight -0.173 -2.49 0.013
Overweight 0.318 2.03 0.043
Obese -0.461 -1.67 0.095
Level of education
No education - - -
Primary 0.185 2.31 0.021
Secondary 0.220 3.07 0.002
Higher 0.055 0.30 0.765
Bold Indicates statistically significant
37
CHAPTER V
5. DISCUSSION AND CONCLUSION
5.1 Predictor variables and anemia
This study to our knowledge is the first study conducted using the dataset from
Timor-Leste DH, between year 2009-2010 with the focus on the association of solid fuel use and
anemia among women age 15-49 years old in Timor-Leste. Our analysis showed consistency
with our study hypothesis that women who are exposed to solid fuels are at greater risk for
anemia.
Our study confirms that approximately 23% of women age 15-49 years old in
Timor-Leste during the year of 2009 – 2010 had anemia. This study found that women who used solid
fuel as a source of energy for cooking or heating activities in the household were at increased
risk for anemia compared to women who used cleaner fuel, even after adjusting for other
predictors. When looking into the household energy use in Timor-Leste with approximately
600,000 tons of wood per year, this may have variety of health implications for reproductive age
women because of the time spent in performing domestic tasks in the household.
Our results replicate the finding of a similar cross-sectional study conducted by Page et
al. (2015), upon which our hypothesis and analysis were based. The difference between the
studies was that the Page study focused on pregnant women while this study focused on
non-pregnant women of reproductive age. Even though the sample population was different, the risks
of anemia when exposed to solid fuel combustion in our study population and theirs were similar
after adjusting for other covariates. The relative risk ratio in the Page study was 1.38 (95% CL:
38
The analysis of the association of solid fuel and anemia has also been studied in children and
reported to have a strong relationship with the mild and moderate/severe anemia even after they
adjusted for other covariates (Kyu et al., 2010). The biological plausibility of the association of
solid fuel and anemia is still understudied. But through literature review, we believed that
exposure to combustion byproducts from solid fuel has the potential to cause anemia. The
chemicals emitted from combustion have the ability to reduce oxygen delivery to the tissues and
also cause systemic inflammation which is mediated by inflammatory cytokines to interrupt
erythropoietin process which resulting in anemia (Blumenthal, 2001; Weiss and Goodnough,
2005; Ying-Ying et al., 2014).
Also, our study found that women in the age group of 35- 49 were at greater risk of
having anemia compared to 15-35 group of age. Our result surprisingly resembles the finding
presented by Morsy and ALhays (2014) in which they found that women at the age of 36- 50
years were more at risk when compared to other younger age groups. This phenomenon is seen
in this age group because they tend to focus more on the household needs and abandon their
personal needs which puts them at risk of having health problems (Morsy & ALhays, 2014) . In
fact, in Timor-Leste a majority of women in reproductive age seem to have more responsibilities
including taking care of young children, elderly and other siblings in the household because of
cultural beliefs and traditions (Lover et al., 2014; IEA, 2015).
In looking into women’s residence, our study found that those women who live in the
rural areas are more susceptible to anemia compared to those who live in the urban areas even
after it was controlled for other covariates. Considering 70% of the total the Timor-Leste
population residing in the rural area and living under the poverty line, the finding of our study
39
identified by Bentley and Griffits (2003) highlighting that women in India who lived in the rural
area with a low standard of living were the most susceptible group to anemia. Hence, women
who lives in the impoverished conditions, the likelihood of having health problems especially
anemia is higher among them.
Moreover, our study also indicated that obese women were two times more likely to have
anemia as compared to normal weighted women. The result is consistent with studies which
looked into the association between anemia and BMI’s of women among women in China and
girls in North India (Qin et al., 2013; Peter et al., 2012). Both studies argued that these women or
girls had anemia because of their age, socioeconomic condition, low food intake, and hormonal
changes. In addition to obese women, after adjusted to other predictors, underweight women also
still found to be associated with anemia. This could be due to the fact that majority of women in
Timor-Leste have limited access to proper nutrient in daily life which made prone to anemia
(Qin et al., 2013; Peter et al., 2012).
Wealth index and level of education in our study both showed an association with
anemia. Our finding also seems to present the same results as studies from India, which
identified that women without formal education who live in low income or wealth index
households have a higher tendency to have health problems. Because these group of women
were believed to have limited knowledge on the nutritional requirements in their reproductive
40
5.2 Strengths and limitations
Our study has several limitations that we found along the process. First, our independent
variable of interest which was the type of fuel variable: solid fuel (96%) and cleaner fuel (5%).
The proportion of both groups have anemia showed large differences in terms of a type of fuel
use. This differences might contribute to overestimation or underestimation of the result in
determining the risk of having anemia from this study population. Second, in our study the
measurement of solid fuel exposure among participants might be imprecise, because DHS used
survey questions to determine whether or not a participant was exposed. Thus, it may lead to
exposure misclassification in this study. Additionally, since solid fuel emits various
concentration of pollutants, it requires a direct measurement to examine the association
accurately. Third, the mechanism in which pollutant form solid fuel combustion caused anemia
is still largely unknown, thus further studies are needed to explore more on the mechanism of
disease development. Last but not least, our study used DHS data from a survey based on the
cross-sectional study design. The cross-sectional study design only allows analysis of the
association between predictors and outcome variables and not a causal relationship.
Fourthly, there were also significantly differences found in most of covariates based on
the hemoglobin results among those women who were observed and excluded from this study
(table 4). Those differences would affect the final result and impact generalizability of our study
to women in Timor-Leste.
Lastly, this study could be improved by considering other potential confounders in the
association of solid fuel use with anemia. One of the main potential confounders is women’s