Chemistry Dissertations Department of Chemistry
1-6-2017
Applications of Monolithic Capillary
Electrochromatography (CEC): Method
Development and Quantitation of Metabolites in
Prostate Tissue and Insights into Chiral
Recognition Mechanism
Yang Lu
Follow this and additional works at:https://scholarworks.gsu.edu/chemistry_diss
This Dissertation is brought to you for free and open access by the Department of Chemistry at ScholarWorks @ Georgia State University. It has been accepted for inclusion in Chemistry Dissertations by an authorized administrator of ScholarWorks @ Georgia State University. For more information, please [email protected].
Recommended Citation
METHOD DEVELOPMENT AND QUANTITATION OF METABOLITES IN PROSTATE
TISSUE AND INSIGHTS INTO CHIRAL RECOGNITION MECHANISM
by
Yang Lu
Under the Direction of Shahab A. Shamsi, PhD
ABSTRACT
Capillary electrochromatography (CEC) is a major capillary electrophoresis (CE) mode
that have been interfaced to mass spectrometry (MS) for sensitive and selective analysis of chiral
compounds. This research expands CEC applications in cancer biomarker and chiral CE analysis.
Chapter 1 is a review of liquid mass spectrometry (LC/MS), gas
chromatography-mass spectrometry (GC/MS), and capillary electrophoresis chromatography-mass spectrometry (CE/MS) for
analysis of metabolites in prostate cancer diagnostics and therapies. In this chapter, a literature
survey was performed within the databases PubMed, 4 Caplus/Webline and Web of Sciences. A
total 17 studies reporting on various analytical platforms for metabolite identification in prostate
cancer research, which often include case-control comparison were identified and reviewed.
Chapter 2 described the analysis of metabolite biomarkers in prostate cancer tissues by capillary
electrochromatography mass spectrometry. In this chapter, a capillary CEC–MS/MS method was
and alanine) as potential prostate cancer diagnostic markers. A polymeric monolith column with
a hydrophilic crosslinker and strong anion-exchange mixed-mode has been fabricated by an in situ
copolymerization of vinyl benzyl trimethylammonium chloride, and bisphenol A glycerolate
dimethacrylate (BisGMA) in the presence of methanol and dodecyl alcohol as porogens and AIBN
as initiator. After CEC separation, samples were analyzed by a triple–quadrupole mass
spectrometer operated in positive ion mode. After optimization, the data showed that the
CEC-MS/MS method using monolithic column achieved a much better chromatographic selectivity
compared to coated columns and increased sensitivity than bare fused silica column The effect of
mobile phase pH, ACN percentage and additive were studies. Under the optimum mobile phase
conditions, this method was carried out to separate and detect eight metabolites in the biopsy
sample. The LOD for the metabolites is between 50nM-100nM. This method has successfully used
to examine patients’ prostate cancer with an accuracy of 95%. Chapter 3 demonstrates Insights
into Chiral Recognition Mechanisms in CEC using linear salvation energy relationship. By varying
the linker (amide and carbamate), head group (alanine, leucine, and valine) and chain length (C8,
C10 and C12) of the amino acid bound surfactants; monolithic column was made to ultimately
understand the factors governing chiral stationary solid phase. Through the comparison of system
parameters, we can see that surfactant head group, linker and chain length affect the separation of
achiral and chiral compounds. Also, with the same type surfactant, data was presented to show
how the trend of LSER parameters and how it affects separation between in CEC. This study
showed the predictive capability of LSER to understand the aforementioned intermolecular
processes controlling retention and by doing so, be able to quantitatively predict the experimental
INDEX WORDS: Capillary electrochromatography (CEC), Prostate cancer, Metabolites, Cancer
biomarkers, Chiral separation, Mass spectrometry, Chiral monolithic stationary phases,
METHOD DEVELOPMENT AND QUANTITATION OF METABOLITES IN PROSTATE
TISSUEAND INSIGHTS INTO CHIRAL RECOGNITION MECHANISM
by
Yang Lu
A Dissertation Submitted in Partial Fulfillment of the Requirements for the Degree of
Doctor of Philosophy
in the College of Arts and Sciences
Georgia State University
Copyright by Yang Lu
METHOD DEVELOPMENT AND QUANTITATION OF METABOLITES IN PROSTATE
TISSUEAND INSIGHTS INTO CHIRAL RECOGNITION MECHANISM
by
Yang Lu
Committee Chair: Shahab A. Shamsi
Committee: George Peng Wang
Ming Luo
Electronic Version Approved:
Office of Graduate Studies
College of Arts and Sciences
Georgia State University
DEDICATION
ACKNOWLEDGEMENTS
I would like to sincerely thank my advisor Dr. Shahab A. Shamsi for his thoughtful and patient
guidance during my graduate studies at Georgia State University. I would also like to thank my
dissertation committee member Drs. George Peng Wang and Ming Luo for their help in writing
this dissertation and throughout my whole graduate projects. Additionally, I am very grateful for
the friendship and help from all the colleagues in my research group, namely Drs. Jun He, William
Bragg, Xiaochun Wang, Yijin Liu., Ms. Ferdoushi Akter and Mr. A S M Mojibur Rahaman
Chawdhury. I also owe many thanks to the collaborators in my dissertation projects, especially Dr.
Robert Simmons for the help with SEM imaging, Dr. Dean Troyer for the help with prostate cancer
biopsy samples.
Finally, and most importantly, I would like to thank my husband Along and my parents. Without
TABLE OF CONTENTS
ACKNOWLEDGEMENTS ... v
LIST OF TABLES ... x
LIST OF FIGURES ... xii
1 CHAPTER 1: Review of Liquid Chromatography-Mass Spectrometry (LC/MS), Gas Chromatography-Mass Spectrometry (GC/MS) and Capillary Electrophoresis Mass Spectrometry (CE/MS) for Analysis of Metabolites in Prostate Cancer Diagnostics and Therapies ... 1
1.1 Abstract ... 1
1.2 Introduction ... 1
1.2.1 Metabolism, Metabolites, Metabolome and Metabolomics ... 1
1.2.2 Metabolites: Properties and Function of Metabolite ... 2
1.2.3 Characteristics of Metabolism ... 3
1.3 Identification of Studies in Prostate Cancer ... 4
1.4 Role of Metabolomics in Prostate Cancer ... 10
1.4.1 Sample Type Investigated for Prostate Cancer... 13
1.4.2 Study Types Investigated for Prostate Cancer ... 14
1.5 References ... 21
2 CHAPTER 2: Method Development and Quantitation of Metabolites in Prostate Tissue Samples by Capillary Electochromatography-Mass Spectrometry ... 24
2.1 Abstract ... 24
2.2 Introduction ... 24
2.3 Experimental Section ... 27
2.3.1 Chemicals and Reagents ... 27
2.3.2 Preparation of Monolithic Columns... 27
2.3.3 Morphology Measurements ... 30
2.3.4 CEC-MS/MS Instrumentation ... 30
2.3.5 Monolithic Column Conditioning ... 31
2.3.6 Buffer and Analyte Preparation ... 31
2.3.7 Calculations ... 33
2.4 Results and Discussion ... 34
2.4.1 Characterization of monolithic columns ... 34
2.4.2 Mobile Phase Optimization ... 39
2.4.2.1 Effect of Mobile Phase pH ... 39
2.4.2.2 Effect of Acetonitrile ... 41
2.4.2.3 Effect of Volatile BGE ... 42
2.4.4 Comparison of Metabolites Separation with Varied Crosslinker Ratio ... 47
2.4.5 Method Validation ... 48
2.4.5.1 Intraday and Interday Repeatability ... 48
2.4.5.2 Robustness ... 52
2.4.6 Analytical Figures of Merit ... 55
2.4.7 Application to the Analysis of Biopsy Extracts of Prostate Tissue ... 57
2.5 Concluding remarks ... 62
References ... 64
3 CHAPTER 3: Use of linear solvation energy relationships for capillary electrochromatographic retention: Application on Retention behavior and selectivity of neutral solutes on surfactant bonded monolith columns and insight into chiral recognition mechanism in enantioselective analysis ... 65
3.1 Abstract ... 65
3.2 Introduction ... 66
3.3 Experimental ... 71
3.3.1 Reagents and Materials ... 71
3.3.2 Preparation of Monolithic Columns... 72
3.3.3 Instrumentation... 73
3.4 Results and Discussion ... 73
3.4.2 System parameters for chiral monolithic columns ... 77
3.4.2.1 Coefficient c ... 81
3.4.2.2 Coefficient a ... 81
3.4.2.3 Coefficient b ... 81
3.4.2.4 Coefficient e and s ... 81
3.4.2.5 Coefficient v ... 82
3.4.3 Comparision of coefficient values ... 82
3.4.4 Test Compounds of Chiral LSERs Equation ... 84
3.4.5 LSER Study of the Enantiomer-AADCL Interactions ... 85
3.5 Conclusion ... 94
LIST OF TABLES
Table 1.1 Selected works published during the last 10 years regarding biomarkers of prostate
cancer by LC or CE coupled to MS using a metabolomics approach. ... 7
Table 1.2 Metabolites in the sub pathways showing significant difference between cancer tumor
and benign prostate samples.16 ... 11
Table 2.1 Effect of binary crosslinker composition on physical characteristics of monolithic
columns. ... 28
Table 2.2 RSD values for tr, k' and S/N for intraday (n = 30) study. ... 50
Table 2.3 RSD values for tr, k' and S/N for interday (n = 15, 3 days) study. ... 50
Table 2.4 RSD values for tr, k' and S/N for column to column (n = 15, 3 columns) precision
study. ... 51
Table 2.5 Fractional factorial design and the level of factors (Central, low, and high) values of
each parameter chosen for the robustness study. ... 52
Table 2.6 Fractional factorial design and experimental design and the corresponding response. 53
Table 3.1 Solute descriptors of 31 achiral compounds. ... 76
Table 3.2 Comparison of system constants for eight surfactant-bound monolithic columns of
different chain length, head group and linker. ... 79
Table 3.3 Resolution, selectivity and retention factors of chiral compounds separated on poly
(AADCL-co-EDMA) monolith column. ... 84
Table 3.4 Comparison of coefficient values of LSER equation on first and second eluted
enantiomers. ... 87
Table 3.5 LSER solute descriptors of six molecular enantiomers *. ... 88
LIST OF FIGURES
Figure 1.1 Schematic overview of the search strategy for metabolites in prostate cancer and
neurological disease. ... 5
Figure 1.2 Pie diagram illustrating the study types used in prostate cancer. The number and
percentage followed the name of the sample type represent the number of studies and the
percentage in our study pool. The same style is employed for other pie charts shown in
Figure 1.3-1.5. ... 13
Figure 1.3 Pie diagram illustrating types of a biological sample used for prostate cancer studies.
The number and percentage followed the name of the study type represent the number of
studies and the percentage in our study pool. ... 15
Figure 1.4 Pie diagram illustrating the types of analytical platforms used for prostate cancer
studies. The number and percentage followed the name of the analytical platform
represent the number of studies and the percentage in our study pool. ... 16
Figure 1.5 Pie diagram illustrating the types of mass spectrometer used for prostate cancer
studies. The number and percentage followed the name of the mass spectrometer
represent the number of studies and the percentage in our study pool. ... 18
Figure 2.1 Chemical structures of all POC metabolites. ... 32
Figure 2.2 Scanning electron micrographs (SEMs) of monolith columns with different
crosslinker ratio. A: EDMA:BisGMA 20:0; B: EDMA:BisGMA 15:5; C:
EDMA:BisGMA 10:10; D: EDMA:BisGMA 5:15; E: EDMA:BisGMA 0:20. Detailed
information of the polymerization mixture composition for the monolith is described in
Table 2.1. A-1 and A-2 represents the SEM picture s of polymer monolith and the edge
bar was measured as follows: A-1 (10μm), A-2 (2μm), B-1 (2μm), B-2 (2μm), C-1
(2μm), C-2 (2μm), D-1 (10μm), D-2 (2μm), E-1 (100μm), E-2 (2μm). ... 37
Figure 2.3 Plots of the applied pressure against the volumetric flow rate of ACN in the
micro-HPLC experiment. Mobile phase: pure ACN. The composition of each columns are
described in Table 2.1. ... 38
Figure 2.4 Effect of the buffer pH values on the retention factors of eight POC metabolites.
Conditions: CEC-ESI-MS/MS using monolith poly (VBTA-co-BisGMA/EDMA). The
experiment was performed on 60 cm(100 μm I.D.). Running buffer: 75/25 ACN/water,
15mM NH4OAc, pH varies; Voltage: +15 kV; Capillary temperature, 20 °C. Injection: 5
mbar, 100 s; MS conditions: sheath liquid, MeOH/H2O (80/20, v/v) containing 40 mM
HOAc; sheath liquid flow rate, 5 μL/min; capillary voltage, +3500V; drying gas flow
rate, 5.0 L/min; drying gas temperature, 200 ◦C; nebulizer pressure, 7 psi. ... 40
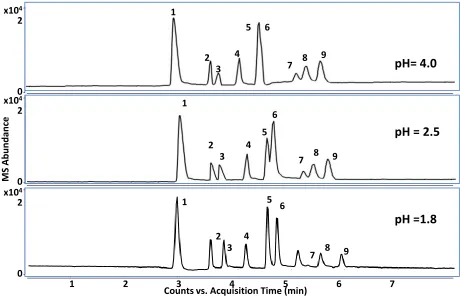
Figure 2.5 Effect of mobile phase pH on simultaneous separation of eight proof of concept
(POC) metabolites. Conditions: CEC-ESI-MS/MS using monolith poly
(VBTA-co-BisGMA/EDMA). Experiment was performed on 60 cm(100 μm I.D.). Running buffer:
75/25 ACN/water, 15mM heptflurobutyric acid, (a). pH= 4.0, (5). pH= 2.5, (c). pH= 1.8,
Voltage: +15 kV; ; Capillary temperature, 20 °C. Injection: 5 kV 10s; ESI-MS conditions
are the same as Figure 3. Peak identification: (1) dimethylsulfoxide; (2) uracil; (3)
malate; (4) alanine; (5) betaine; (6) xanthine; (7) proline; (8) acetylaspartic acid; (9)
acetylglucosamine. ... 41
Figure 2.6 Effect of The of percent acetonitrile on retention factors of eight POC metabolites.
Conditions: CEC-ESI-MS/MS using monolith poly (VBTA-co-BisGMA/EDMA).
15mM heptflurobutyric acid, 5mM NH4OAcpH= 1.8, Voltage: +15 kV; ; Capillary
temperature, 20 °C. Injection: 5 kV 10s; ESI-MS conditions are the same as Figure 2.3. 42
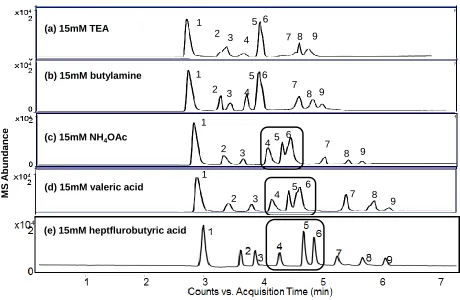
Figure 2.7 Effect of volatile mobile phase additives for on simultaneous separation of eight POC
metabolites. Conditions: volatile additive was performed on 60 cm (100 μm I.D.) poly
(VBTA-co-BisGMA/EDMA) monolithic column. Running buffer: ACN/water 75/25,
additive varies, pH= 1.8, Voltage: +15 kV;Capillary temperature, 20 °C. Injection: 5 kV
10s; ESI-MS conditions are the same As Figure 2.3. ... 43
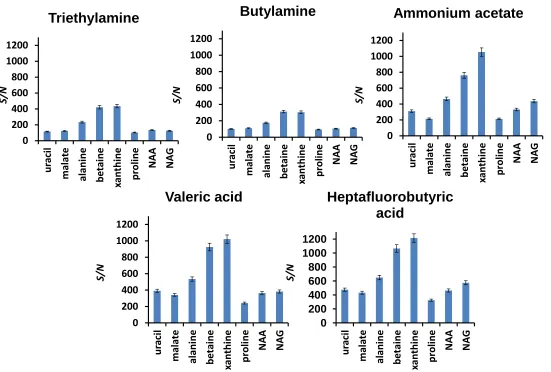
Figure 2.8 Effect of types of volatile additive in the mobile phase on S/N of eight POC in
CEC-ESI-MS. Conditions: CEC-ESI-MS/MS using monolith poly
(VBTA-co-BisGMA/EDMA) column 60 cm (100 μm I.D.). Running buffer: 75/25 ACN/water,
15mM heptflurobutyric acid, pH= 1.8, Voltage: +15 kV; Capillary temperature, 20 °C.
Injection: 5 kV 10s; ESI-MS conditions are the same as Figure 2.3. ... 45
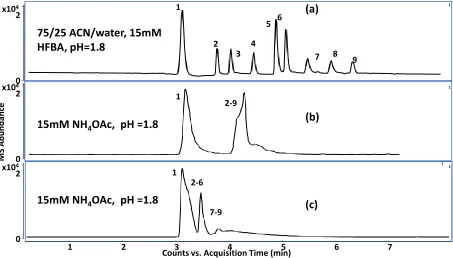
Figure 2.9 Comparison of the separation of 8 POC under optimized mobile phase on (a). VBTA
monlotihic column, (b). VBTA coated column and (c).bare silica column. Conditions: (a).
CEC-ESI-MS/MS using monolith poly (VBTA-co-BisGMA/EDMA). Experiment was
performed on 60 cm (100 μm I.D.). Running buffer: 75/25 ACN/water, 15mM
heptflurobutyric acid, pH= 1.8, Voltage: +15 kV; Capillary temperature, 20 °C. Injection:
5 kV 10s; ESI-MS conditions are the same as Figure 3; b). CEC-ESI-MS/MS using
VBTA coated column. Running buffer: 15mM NH4OAc, pH =1.8. Other conditions are
the same as (a). (c). CE-ESI-MS/MS using bare silica column. Running buffer: 15mM
NH4OAc, pH =1.8. Other conditions are the same as (a). Peak identification: (1)
dimethylsulfoxide; (2) uracil; (3) malate; (4) alanine; (5) betaine; (6) xanthine; (7)
Figure 2.10 Chromatograms showing comparison of composition of crosslinker in the monolith.
Conditions: CEC-ESI-MS/MS using monolith poly (VBTA-co-BisGMA/EDMA).
Experiment was performed on 60 cm(100 μm I.D.). Running buffer: 75/25 ACN/water,
15mM heptflurobutyric acid, pH= 1.8, Voltage: +15 kV; Capillary temperature, 20 °C.
Injection: 5 kV, 10 s; ESI-MS conditions are the same as Figure 2.3. Peak identification
are the same as Figure 9. ... 48
Figure 2.11 Scaled and centered coefficients for the studied outputs (S/N ratio, peak area, and
resolution of betaine and xanthine) as a function of the parameters: pH, ACN%, SL flow
rate (SLFR), nubulizer pressure (NP), ESI voltage (VESI). ... 54
Figure 2.12 Column life time of poly-(VBTA-co-BisGMA/EDMA) monolithic columns.
Separation of all eight POC metabolites were obtained by setting up automated 115 runs
sequence on the CE 710 instrument ... 55
Figure 2.13 Chromatogram of metabolites separation of all eight POC metabolites at the limit of
detection. Peak identification is the same as described in Figure 2.12. ... 57
Figure 2.14 Prostate needle biopsy extracts preparation procedure. ... 58
Figure 2.15 EIC chromatogram of metabolite distribution in biopsy extracts in cancer versus
noncancer biopsy extracts. ... 60
Figure 2.16 Concentration levels between normal vs. tumor biopsies extracts. Analysis
Conditions are the same as Fig 2.5 ... 61
Figure 2.17 Box plots of tumor versus normal POC metabolite concentrations in biopsies
extracts. POS indicates the presence of cancer; NEG indicated the absence of cancer;
Figure 3.1 Linear solvation energy relationship model: solute descriptors and interactions related
to stationary phase. The monolithic stationary phase is marked in grey color and the
interaction (retention) of the stationary phase is characterized by measuring the sum of
system coefficients (represented by lower case letters a,b, e, s and v) at the top , and
solute descriptors (represented by upper case letters, A, B, E, S and V) at the bottom. ... 68
Figure 3.2 scheme for polymerization of amino acid based surfactant monolithic column. 8
columns used in this study are as follows: poly-(AAOCL-co-EDMA), poly-(AADCL-co-EDMA), or poly-(AADoCL-co-EDMA) monoliths with monomer linker X=C, head group R=leucine, and carbon number n = 8, 10, and 12, respectively; poly-(AADCV-co -EDMA) and poly-(AADCA-co-EDMA) monoliths with monomer linker X=C, carbon number n = 10, and head group =valine and alanine, respectively; poly-(AAOCV-co -EDMA) and poly-(AAOCA-co-EDMA) and poly-(AAOCL-co-EDMA) monoliths with cross linker X=O, carbon number n=8, head group R=valine, alanine and leucine,
respectively. The letters , b, c, m and n are the aggregation numbers. ... 70
Figure 3.3 Effect of chain length of monolithic column on separation of hydrogen bond donors
(HBD). Peak identification: (1). benzyl alcohol, (2). phenol, (3). ethylphenol, (4).
4-fluorophenol, (5). 4-chloropheno, (6). 4-bromopheno, (7). chlorophenol, (8).
3-bromophenol. ... 74
Figure 3.4 . Effect of head group and linker types of surfactant-bound monolithic column on
separation of hydrogen bond donors (HBD). Peak identification: (1). benzyl alcohol, (2).
phenol, (3). 4-ethylphenol, (4). 4-fluorophenol, (5). 4-chloropheno, (6). 4-bromopheno,
Figure 3.5 Bar plots showing system constants for eight surfactant-bound monolithic columns of
different chain length, head group and different linker. ... 83
Figure 3.6 The procedure of enantioselectivity prediction using LSER model. * The experiment
was based on poly (AADCL-co-EDMA) monolith column. ... 87
Figure 3.7 Chiral separation on poly-AADCL-co-EDMA monolithic column. ... 92
Figure 3.8 . Radar plots showing the five components of the enantioselectivity factors of
1 CHAPTER 1: Review of Liquid Chromatography-Mass Spectrometry (LC/MS), Gas
Chromatography-Mass Spectrometry (GC/MS) and Capillary Electrophoresis Mass
Spectrometry (CE/MS) for Analysis of Metabolites in Prostate Cancer Diagnostics and
Therapies
1.1 Abstract
In this introductory chapter, an overview is presented on a number of important aspects related to
the analysis of metabolites in prostate cancer research. A literature survey was performed within
the databases PubMed, 4 Caplus/Webline and Web of Sciences. A total 17 studies reporting on
various analytical platforms for metabolite identification in prostate cancer research, which often
include case-control comparison were identified and reviewed. More particularly, this chapter
summarizes the present situation with respect to the review of chromatography-mass spectrometry
platforms, sample type, study type and the type of mass spectrometers used in prostate cancer
research. Despite current challenges, metabolomics has the potential to evolve into a standard tool
in prostate cancer.
1.2 Introduction
1.2.1 Metabolism, Metabolites, Metabolome and Metabolomics
Metabolismis a term used to describe a set of chemical reactions of the living organism to sustain
life. A series of enzyme participate in these reactions to allow cells to grow and reproduce. There
are two subdivisions of metabolism: catabolism and anabolism. Catabolism is the breakdown
procedure of large molecules to obtain energy (e.g., hydrolysis reaction and cellular respiration).
Conversion from starch to glucose involves hydrolysis and energy are released in the reaction.
molecules such as various cell components can be combined to form more complex molecules
such as proteins and nucleic acids resulting in energy storage in these molecules.
1.2.2 Metabolites: Properties and Function of Metabolite
Metabolites are a catalytic product of enzyme reactions, which occur inside the cell. Six major
factors are considered when classifying a substance as a metabolite. These six factors in metabolite
classification include: (a) metabolite formation occurs within the cell (intracellularly); (b)
metabolites rearrange and react with enzymes; (c) metabolic product must proceed to form another
species in a subsequent reactions, (d) metabolite have a well-defined half-life and they do not store
in cells; (e) metabolites serves as a regulator controlling the speed of many metabolisms; (f)
metabolites serve important biological functions in the cell. Metabolites are also termed as
intermediates (intermediate metabolite) and products of metabolism (final metabolite). When
metabolites usually refer to the small molecule, they are defined as primary or secondary
metabolites. Primary metabolites are directly involved in normal cell growth, development, and
reproduction. (e.g., amino acids metabolism). On the other hand, secondary metabolites are not
directly involved in these processes, but may have a long-term effect on human survivability.
The enzyme is essential for metabolic reactions because the presence of enzyme allow a
thermodynamically difficult reaction to occur when coupled to another spontaneous reaction. One
example, which shows the potential of the enzyme is the energy generated from ATP hydrolysis
to drive another chemical reaction. Metabolism of an organism determines which substances for
this organism are nutritious and which are poisonous. For example, hydrogen sulfide serves as
reactions, known as the term “metabolic rate,” also affects an organism food demand. For example,
faster the ATP to ADP conversion rate, the higher will be food demand.
1.2.3 Characteristics of Metabolism
Metabolism has a very useful characteristic, i.e., the basic metabolic pathways are similar between
different species. For example, citric acid (also known as tricarboxylic acid (TCA), is present in
all organisms, which may be unicellular organisms such as tiny bacteria or even huge multicellular
organisms such as elephants.2 Such metabolic similarity is due to the high efficiency associated
with metabolic pathways, and their early appearance in the evolutionary history.3,4 There are
numerous metabolic pathways. The most important metabolic processes in human includes: citric
acid cycle (Krebs' cycle), oxidative phosphorylation, pentose phosphate pathway, urea cycle, fatty
acid β-oxidation, and gluconeogenesis.
The metabolome is a sum of all small molecules found in a biological sample, e.g., cell, tissue,
tissue extract, biofluid, organs or even an organism. Essentially, metabolome involves the
interaction of an organism genome with its environment. Therefore, an organism metabolome is
a good model of its phenotype, which is a product of genotype and its environment. In different
species, metabolomes are different. Even in the same species, metabolome differs from each other
in different organ and tissue. Metabolome database such as Human Metabolome Database
(HMDB)5 and Yeast Metabolome Database (YMDB)6 are widely used for metabolite search.
Metabolomics is a rapidly emerging omics in systems biology involving studies of an entire set of
metabolites found in cells, tissue or the entire organism. The metabolites are first identified and
detected with analytical technologies. Next, a systematic study is performed to quantitate and
metabolomics was first coined by Professor Jeremy Nicholson at Imperial College London in
1999.7 After the rapid development, metabolomics is now related to a number of areas, such as
disease diagnosis,8 pharmaceutical research and development, nutrition, food science, drugs
science, environmental science, botany and human health care.
Metabolite analysis has been used for many decades in disease diagnosis since Sir Archibald
Garrod first links metabolism with human disease.9-13 While other –omics, such as transcriptomic
and proteomics, are well known for their important role in diagnostic and treatment of cancer and
other diseases, metabolomics is also attracting more and more attention because of its high
sensitivity to diet, stress and environmental related physiological changes. In transcriptomic and
proteomics, the blueprint of tens of more than ten thousand targets is measured to monitor the
organism functions. However, the metabolomic study is less time consuming because the smallest
domain (only ~5000 metabolites in metabolism pathways of living organs) compared to other
-omics.14,15 Metabolomics is promising because it involves simple sample preparation procedure
and ease of data comparison among different conditions.7 In this introduction to dissertation
chapter, the application of metabolomics in the diagnosis of prostate cancer is discussed. For
prostate cancer, there is an urgent need to identify reliable biomarkers as a diagnostic tool for
effective therapy design.
1.3 Identification of Studies in Prostate Cancer
To better understand metabolomics role for prostate cancer, four databases (PubMed, web of
Science and CAPLUS/EDLINE) were searched with the following keywords “’Metabolomics’
AND ‘Prostate Cancer’” AND “‘CE/MS’, “’Metabolomics’ AND ‘’ Prostate Cancer AND
charts for the review selection process for metabolites involved in the prostate is shown in Figure
1.1. We included only studies involving separations [gas chromatography (GC),
high-performance liquid chromatography (HPLC)/ultrahigh pressure liquid chromatography (UPLC)
or capillary electrophoresis (CE) coupled to mass spectrometry (MS) and approaches using only
NMR, UV-98 Vis or (MS) were excluded. In addition, only discussions on human plasma, urine,
CSF or tissue are included in this review. All duplicate findings were removed. Only papers
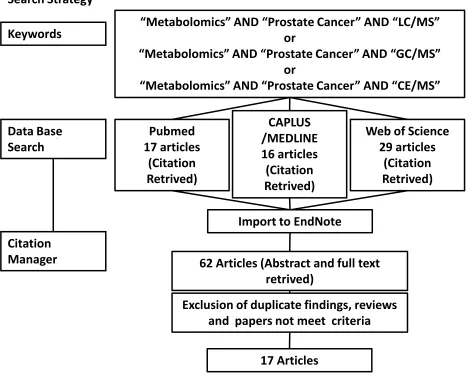
[image:26.612.73.542.297.672.2]reported in the English language are included in this review.
Figure 1.1 Schematic overview of the search strategy for metabolites in prostate cancer and neurological disease. Data Base Search Search Strategy Citation Manager Keywords Pubmed 17 articles (Citation Retrived) CAPLUS /MEDLINE 16 articles (Citation Retrived)
“Metabolomics” AND “Prostate Cancer” AND “LC/MS” or
“Metabolomics” AND “Prostate Cancer” AND “GC/MS” or
“Metabolomics” AND “Prostate Cancer” AND “CE/MS”
Exclusion of duplicate findings, reviews and papers not meet criteria
Import to EndNote
17 Articles
62 Articles (Abstract and full text retrived)
Web of Science 29 articles
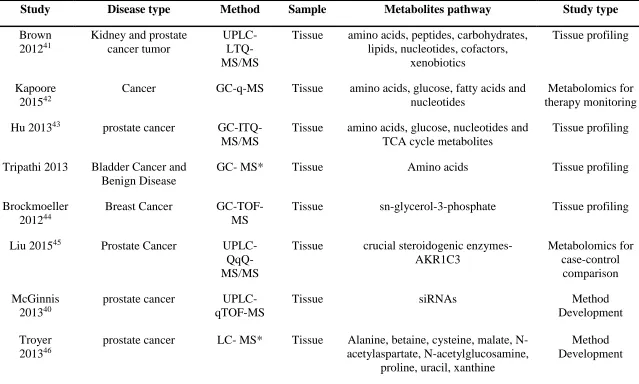
In total, 17 papers (as listed in Table. 1.1) were reviewed. The information (i.e., sample types,
study types and analytical platforms) is illustrated in Figures 1.2- 1.5 and each of these topics are
Table 1.1 Selected works published during the last 10 years regarding biomarkers of prostate cancer by LC or CE coupled to MS using a metabolomics approach.
Study Disease type Method Sample Metabolites pathway Study type
Brown 201241
Kidney and prostate cancer tumor
UPLC- LTQ-MS/MS
Tissue amino acids, peptides, carbohydrates, lipids, nucleotides, cofactors,
xenobiotics
Tissue profiling
Kapoore 201542
Cancer GC-q-MS Tissue amino acids, glucose, fatty acids and
nucleotides
Metabolomics for therapy monitoring
Hu 201343 prostate cancer
GC-ITQ-MS/MS
Tissue amino acids, glucose, nucleotides and TCA cycle metabolites
Tissue profiling
Tripathi 2013 Bladder Cancer and Benign Disease
GC- MS* Tissue Amino acids Tissue profiling
Brockmoeller 201244
Breast Cancer
GC-TOF-MS
Tissue sn-glycerol-3-phosphate Tissue profiling
Liu 201545 Prostate Cancer
UPLC- QqQ-MS/MS
Tissue crucial steroidogenic enzymes- AKR1C3 Metabolomics for case-control comparison McGinnis 201340
prostate cancer
UPLC-qTOF-MS
Tissue siRNAs Method
Development
Troyer 201346
prostate cancer LC- MS* Tissue Alanine, betaine, cysteine, malate, N-acetylaspartate, N-acetylglucosamine,
proline, uracil, xanthine
Study Disease type Method Sample Metabolites pathway Study type
Huang 201447
prostate cancer
LC-QTOF-MS
Serum cholesterol metabolic and mitogen-activated protein kinase signaling
pathway
Metabolomics for therapy monitoring
Kami 201239 lung and prostate tumor CE-TOF-MS
Tissue lactate, tricarboxylic acid (TCA) cycle intermediates, and amino acids
Tissue profiling
Nacoulma 201348
Lung, breast and prostate tumor
GC-ITQ-MS
Tissue Cembrene derivatives, Incensole derivatives, glucose, amino acids,
organic and phenolic acids
Metabolomics for case-control comparison
Wei 201349 Breast cancer
LC-QTOF-MS/MS
Serum threonine, isoleucine, glutamine and linolenic acid Metabolomics for therapy monitoring Sampson 201331 Prostate, Lung, Colorectal,
and Ovarian Cancer
LC-LIT-MS and
GC-MS*
Plasma amino acids, carbohydrates, fatty acids, androgens, and xenobiotics
Metabolomics for patient prognosis
Cross 201420 Colorectal, Prostate, Lung, Colorectal, and
Ovarian Cancer
GC-MS* Serum amino acids, carbohydrates, fatty acids, androgens, and xenobiotics
Metabolomics for patient prognosis
Li 201550 Prostate cancer
LC-LTQ- Orbitrap-MS/MS
Tissue Multiple peptides derived from osteopontin Metabolomics for patient prognosis Guertin 201551 Prostate, Lung,
Colorectal, and Ovarian Cancer
UPLC-MS/MS and
GC-MS*
Serum Caffeine-related metabolites Metabolomics for
Study Disease type Method Sample Metabolites pathway Study type
Struck-Lewicka
201652
Prostate cancer
LC-TOF-MS and
GC-QqQ-MS/MS
Urine Urea and tricarboxylic
acid cycle, amino acid and purine metabolism
Metabolic fingerprintin
1.4 Role of Metabolomics in Prostate Cancer
As mentioned earlier, metabolomics requires analysis of metabolite concentration change in a
biological sample related to a certain disease. The biological specimen used in prostate cancer
diagnostic includes urine, blood, and human tissues; each contains a different type of metabolites
pathway information. A successful clinicopathologic and demographic evaluation should consider
the ease of sample handling and preparation, patient demographic, instrumentation and method
reliability. For therapy monitoring or case-control comparison studies, a larger sample pool is
required, and the sample number is usually above 100. No significant difference should be
observed among the patients in terms of median age, comorbid conditions and menopausal status.
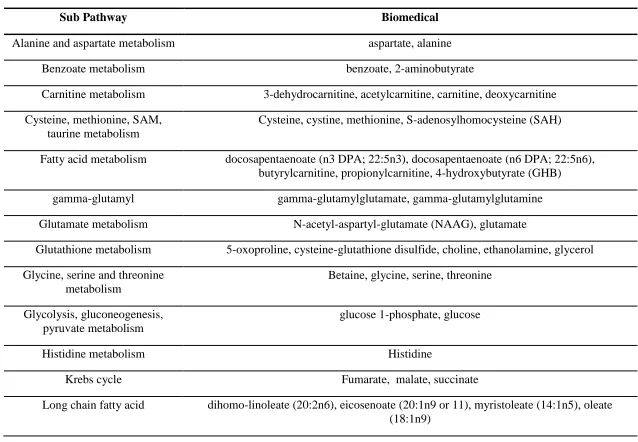
One typical case is a recent report with a list of over 110 metabolites in prostate cancer tissues.16
In this study, the sample collection, sample preparation, and metabolite extraction were described,
and the metabolites belong to different pathways and across all major biomedical classes such as
amino acid metabolism (proline, cysteine, alanine, histidine, lysine, leucine, serine,
N-acetyl-aspartyl-glutamate (NAG), betaine, N-acetyl aspartate (NAA) etc.), energy metabolism (malic,
succinate, phosphate etc.), carbonhydrate (glucose, ribose etc.), lipid (choline, cartinine, glycerol
etc), nucleotide (uracil, uidine, xanthine etc), cofactors and vitamins (alpha-tocopherol and
panothenate). The authors applied the histology, metabolomic profiling, and statistical analysis to
develop and validate the method with GC-MS and LC-MS in a single core needle biopsy to aid
the prostate cancer diagnosis. The list of metabolites and pathways are shown in Table 1.2. In the
next sub-sections, some critical aspects of prostate cancer research such as sample types, study
types, analytical platforms and MS analyzers will be discussed detailed based on the literature
Table 1.2 Metabolites in the sub pathways showing significant difference between cancer tumor and benign prostate samples.16
Sub Pathway Biomedical
Alanine and aspartate metabolism aspartate, alanine
Benzoate metabolism benzoate, 2-aminobutyrate
Carnitine metabolism 3-dehydrocarnitine, acetylcarnitine, carnitine, deoxycarnitine
Cysteine, methionine, SAM, taurine metabolism
Cysteine, cystine, methionine, S-adenosylhomocysteine (SAH)
Fatty acid metabolism docosapentaenoate (n3 DPA; 22:5n3), docosapentaenoate (n6 DPA; 22:5n6), butyrylcarnitine, propionylcarnitine, 4-hydroxybutyrate (GHB)
gamma-glutamyl gamma-glutamylglutamate, gamma-glutamylglutamine
Glutamate metabolism N-acetyl-aspartyl-glutamate (NAAG), glutamate
Glutathione metabolism 5-oxoproline, cysteine-glutathione disulfide, choline, ethanolamine, glycerol
Glycine, serine and threonine metabolism
Betaine, glycine, serine, threonine
Glycolysis, gluconeogenesis, pyruvate metabolism
glucose 1-phosphate, glucose
Histidine metabolism Histidine
Krebs cycle Fumarate, malate, succinate
[image:32.792.68.706.102.544.2]Sub Pathway Biomedical
Lysine metabolism 2-aminoadipate, lysine
Lysolipid arachidonoylglycerophosphoethanolamine, rachidonoylglycerophosphoinositol, linoleoylglycerophosphoethanolamine, oleoylglycerophosphoethanolamine,
leoylglycerophosphoinositol, oleoylglycerophosphoserine, almitoylglycerophosphoinositol, stearoylglycerophosphoethanolamine,
1-tearoylglycerophosphoinositol, oleoylglycerophosphoethanolamine, 2-almitoylglycerophosphoethanolamine
Medium chain fatty acid caprylate (8:0)
Nucleotide sugars, pentose metabolism
ribose
Pantothenate and CoA metabolism pantothenate
Phenylalanine & tyrosine metabolism
Phenylalanine, tyrosine
Purine and pyrimidine metabolism methylphosphate
Purine metabolism Hypoxanthine, inosine, xanthine, xanthosine, adenine, guanosine
Pyrimidine metabolism Cytidine, pseudouridine, uracil, uridine
Urea cycle; arginine-, proline-, metabolism
Arginine, ornithine, proline, trans-4-hydroxyproline
Tryptophan metabolism Tryptophan
Valine, leucine and isoleucine metabolism
1.4.1 Sample Type Investigated for Prostate Cancer
A total of 17 papers were found in the metabolites analysis for prostate cancer. A pie diagram
showing the distribution of sample type investigated for prostate cancer is shown in Figure 1.2.
The most common sample assessed is tissue sample from tumor biopsy (11, 65%) followed by the
[image:34.612.124.489.241.468.2]traditional clinical sample, such as serum, plasma (total 5 studies, 29%), and urine (1 studies, 6%).
Figure 1.2 Pie diagram illustrating the study types used in prostate cancer. The number and percentage followed the name of the sample type represent the number of studies and the percentage in our study pool. The same style is employed for other pie charts shown in Figure 1.3-1.5.
Among all sample types, urine requires the least sample preparation (only centrifuge and
dilution)17. In other samples types like tissue and CSF, protein needs to be removed before analysis.
However, since metabolites concentration could be easily diluted or concentrated in a urine sample
(sweating, drinking water, etc.), urine is not the best choices in most cases.
Whole blood, serum, and plasma are the second most routine specimen for prostate cancer. The
concentration of metabolites in that sample can be related to pharmacological effect and due to
Serum, 4,
23%*
Plasma, 1,
6%
Urine, 1,
6%
Tissue, 11,
65%
different metabolite profiles; In addition, whole blood, serum, and plasma could be used to monitor
parent metabolites. 18-22
Sample preparation for the solid sample is more difficult than the liquid samples. For examples, to
liberate metabolites from complicated membranes and large molecules, tissue samples must be
sliced with mechanical devices and extract with certain solvent. Moreover, one need to take extra
care to avoid the leakage of metabolites from other biofluid sources (blood).16,23-26 Nevertheless,
as tissue sample could provide the widest range of metabolites profiling, the tissue sample is most
widely used in the prostate cancer metabolomic analysis.
1.4.2 Study Types Investigated for Prostate Cancer
Pie chart with different study types distribution is shown in Figure 1.3. Five studies in tissue
profiling are reported, and this accounts for 29% in the prostate cancer metabolomic study, which
means the metabolism in prostate cancer is still not well understood, and new metabolic pathway
are involved in either the disease pathology or treatment.27 Furthermore, metabolites for therapy
monitoring and patient prognosis are second most common study types in prostate cancer studies
(18%) because the stronger demand for early diagnosis and treatment of prostate cancer.
Metabolomics for case-control comparison is the third most common study types (3, 17%). In this
last category, instead of independent validation, relative sample concentration change is
employed.20,26,28-32 Thus, case-control studies will give a clue on the future potential of metabolites
use as an early diagnostic tool for prostate cancer. Fewer studies (1, 12%) are discussed in method
development, and most of the studies are not quantitative enough due to the sample type and
Figure 1.3 Pie diagram illustrating types of a biological sample used for prostate cancer studies. The number and percentage followed the name of the study type represent the number of studies and the percentage in our study pool.
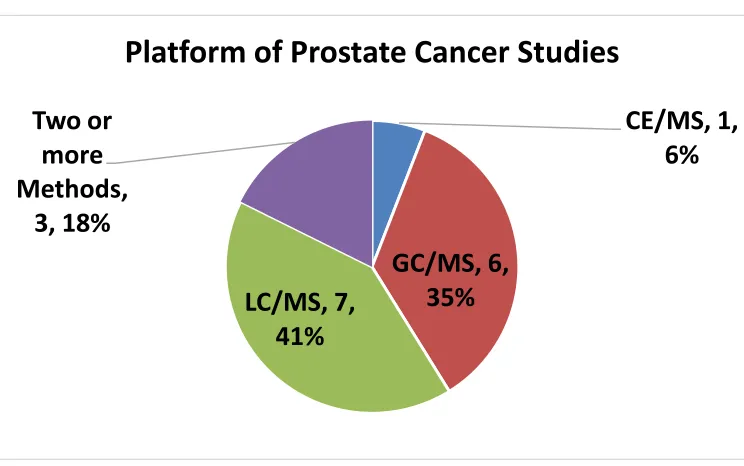
1.4.3 Analytical Platforms based on GC/MS, LC/MS, and CE/MS for Prostate Cancer
To achieve a better understanding of metabolomic in prostate cancer, multiple analytical platforms
have been employed, and the distribution for each platform is shown in Figure 1.4. Gas
chromatography-MS (GC/MS) is a traditional method of choice and is exclusively studied due to
its robustness and low ion suppression of mass spectrometer (e.g., single quadrupole).
GC/MS is widely used in prostate cancer metabolomic study (6, 35%) of both volatile and
non-volatile analytes following derivatization.16,22,25,33-35 Given the excellent selectivity and
repeatability, modern GC/MS is an ideal tool for complex metabolic samples. However, it should
be noted that only fewer metabolites can be detected by GC-MS due to the difficulty associated
with derivatization of polar compounds.
Metabolomics
for
case-control
comparison,
3, 17%
Metabolomics
for therapy
monitoring, 3,
18%
Metabolomics
for patient
prognosis, 3,
18%
Method
Development,
2, 12%
Tissue
profiling, 5,
29%
other, 1, 6%
[image:36.612.79.532.91.360.2]Figure 1.4 Pie diagram illustrating the types of analytical platforms used for prostate cancer studies. The number and percentage followed the name of the analytical platform represent the number of studies and the percentage in our study pool.
The highly polar metabolites analysis relies on more powerful techniques such as
high-performance liquid chromatography (HPLC) and capillary electrophoresis (CE). The various
chromatographic modes of HPLC such as ion exchange chromatography (IEC), normal phase
(NP), reversed-phase (RP) and hydrophilic interaction liquid chromatography (HILIC) may
employ MS compatible mobile phases. Thus, HPLC (7 studies. 41%) could provide good
separation of different types of metabolites, give complementary understanding for metabolome
and is the most popular separation platform for metabolome study to date. A high-resolution and
more efficient form of HPLC is ultra-high pressure liquid chromatography (UPLC), which has
superior speed and significantly higher sensitivity compared to conventional HPLC-MS. Several
authors have reported a gold standard UPLC-MS because of the high peak capacity and low matrix
effect. 25,36-38
CE/MS, 1,
6%
GC/MS, 6,
35%
LC/MS, 7,
41%
Two or
more
Methods,
3, 18%
To profile different types of metabolites, nearly 18% studies used both LC/MS and GC/MS as
hyphenated technologies for prostate cancer study. In an outstanding paper, Brown et al. used
GC-MS and LC- GC-MS to analyze methanolic extract in prostate and other biopsy samples. 16 In their
study authors found 83 metabolites (out of a total of 260 different metabolites) to be promising
markers. They connected these metabolites with cellular architecture and immunoreactivity by
histopathological analysis. The 83 metabolites determined to be different between tumor
containing sample and non-tumor containing sample among eight patients.
While only one paper is related to CE-MS in our study pool, it does not mean CE has less potential
in prostate cancer metabolome. In a study reported by Kami and co-workers, concentration change
of lactate, focusing on the phosphorylation analysis was found to be helpful in developing more
effective bio-marker for anticancer therapy.39 Considering the high selectivity, sensitivity and low
sample demand for biological samples, CE-MS is a promising field to explore the potential of
metabolites analysis.In addition, with the further advancement of sensitive detection and
improvement of column technology more sensitive biomarker will be discovered by CE-MS.
1.4.4 Mass Spectrometer Types Used for Prostate Cancer
The most common mass analyzer used for metabolite identification is quadrupole time-of-flight
(qTOF) (12%) and triple quadrupole (QqQ) (17%), as shown in Figure 1.5. Some paper also used
Orbitrap alone or combined with quadrupole to get better results. Each MS analyzer has specific
advantages and drawbacks. Therefore, it is important to use the most suitable MS which provides
a balance among data quality (sensitivity, accuracy), time and cost consumption as well as research
demanding (metabolic pathway, sample concentration, and stability). For example, if the research
instead of TOF. Advantages and disadvantages of the aforementioned MS analyzers are discussed
separately in the following paragraphs.
Figure 1.5 Pie diagram illustrating the types of mass spectrometer used for prostate cancer studies. The number and percentage followed the name of the mass spectrometer represent the number of studies and the percentage in our study pool.
As a traditional mass spectrometer in most analytical laboratories, QqQ is widely used in
metabolites analysis. With excellent tandem MS capability, QqQ could provide information on
structure determination of product ion, thereby reduce the possible structures, which could be
applied in non-targeted metabolites profiling. Gaikwad successfully developed a method for more
than 100 indigenous and exogenous steroid measurements in breast tissue in 12 minutes single
UPLC-QqQ- MS/MS method. In this study, a simple liquid-liquid extraction was applied to extract
101 steroids followed by UPLC-MS/MS. The LOD for steroids metabolites is 0.001-15.7 pmol,
suggesting the potential for clinical diagnosis for early stage prostate cancer. However, the
linearity was not ideal with correlation coefficients (R2) of only 0.90 for most of the analytes. 25
LTQ, 2,
12%
Q, 1, 6%
ITQ, 2, 12%
TOF, 2,
12%
QqQ, 3,
17%
qTOF, 2,
12%
Single
platform and
detector
type not
specified, 2,
12%
Multiple
platform, 3,
17%
Kapoore’s group characterized eleven different classes’ metabolites such as the pathway of amino
acids, glucose, fatty acids and nucleotides with QqQ. A results showing difference of concentration
level could aid the metabolomic interpretation and used for the therapy monitoring of prostate
cancer.40 With QqQ-MS detector, Liu’s group41 found the concentration level of one crucial
steroidogenic enzyme, AKR1C3, is associated with the enzalutamide resistance and the targeting
AKR1C3 could potentially increase the survival rate of prostate cancer patients.
However, due to the compromised duty cycle, quadruple MS loses partial sensitivity when a larger
number of MS/MS data is acquired. To get more ion information, QqQ sacrifices either dwell time
or data points collected on each peak. In contrast, qTOF allows analytes identification with
accurate mass resolution and detection sensitivity in a rapid scan mode, without the need for
prefiltration of certain predicted metabolites, which makes qTOF a cost and time effective mass
analyzer, especially in the non-targeted metabolomic study. A study of the direct determination of
small ribonucleic acids method was developed by Bartlett’s group with ion exchange column. In
their study, a set of RNAs in prostate cancer cells was identified with 6 ng/200,000 cells and LOQ
of 6 ng/mL. With a one-step sample preparation, the recovery > 95% was obtained.42 In the
literature review, the qTOF is also most popular mass analyzer (65% in prostate cancer). Orbitrap
was also discussed in some studies as part of tandem MS. McGinnis’s group developed a method
to quantitate the metabolites of siRNAs in a tissue sample with qTOF and applied the method for
the determination of metabolism of and siRNA in prostate cancer.42 Another application of qTOF
is a study of Huang’s group, in which a set of metabolites in cholesterol metabolic and
mitogen-activated protein kinase signaling pathways were evaluated as a response to endocrine therapy to
group, in which threonine, isoleucine, glutamine and linolenic acid pathway metabolites was
1.5 References
(1) Friedrich, C. G. Advances in microbial physiology1997, 39, 235-289.
(2) Pace, N. R. Proceedings of the National Academy of Sciences2001, 98, 805-808.
(3) Smith, E.; Morowitz, H. J. Proceedings of the National Academy of Sciences of the United
States of America2004, 101, 13168-13173.
(4) Ebenhöh, O.; Heinrich, R. Bulletin of mathematical biology2001, 63, 21-55.
(5) Wishart, D. S.; Tzur, D.; Knox, C.; Eisner, R.; Guo, A. C.; Young, N.; Cheng, D.; Jewell, K.; Arndt, D.; Sawhney, S.; Fung, C.; Nikolai, L.; Lewis, M.; Coutouly, M. A.; Forsythe, I.; Tang, P.; Shrivastava, S.; Jeroncic, K.; Stothard, P.; Amegbey, G.; Block, D.; Hau, D. D.; Wagner, J.; Miniaci, J.; Clements, M.; Gebremedhin, M.; Guo, N.; Zhang, Y.; Duggan, G. E.; Macinnis, G. D.; Weljie, A. M.; Dowlatabadi, R.; Bamforth, F.; Clive, D.; Greiner, R.; Li, L.; Marrie, T.; Sykes, B. D.; Vogel, H. J.; Querengesser, L. Nucleic acids research2007, 35, D521-526. (6) Jewison, T.; Knox, C.; Neveu, V.; Djoumbou, Y.; Guo, A. C.; Lee, J.; Liu, P.; Mandal, R.; Krishnamurthy, R.; Sinelnikov, I.; Wilson, M.; Wishart, D. S. Nucleic acids research2012, 40, D815-820.
(7) Nagrath, D.; Caneba, C.; Karedath, T.; Bellance, N. Biochimica et Biophysica Acta
(BBA)-Bioenergetics2011, 1807, 650-663.
(8) Mullen, A. R.; Wheaton, W. W.; Jin, E. S.; Chen, P.-H.; Sullivan, L. B.; Cheng, T.; Yang, Y.; Linehan, W. M.; Chandel, N. S.; DeBerardinis, R. J. Nature2012, 481, 385-388.
(9) Idle, J. R.; Gonzalez, F. J. Cell metabolism2007, 6, 348-351.
(10) Lanpher, B.; Brunetti-Pierri, N.; Lee, B. Nature Reviews Genetics2006, 7, 449-459. (11) Scriver, C. Journal of inherited metabolic disease2001, 24, 093-116.
(12) Scriver, C. Journal of inherited metabolic disease2004, 27, 305-317. (13) Vangala, S.; Tonelli, A. The AAPS journal2007, 9, E284-E297.
(14) Horgan, R. P.; Kenny, L. C. The Obstetrician & Gynaecologist2011, 13, 189-195. (15) Aboud, O. A.; Weiss, R. H. Clinical chemistry2013, 59, 138-146.
(16) Brown, M. V.; McDunn, J. E.; Gunst, P. R.; Smith, E. M.; Milburn, M. V.; Troyer, D. A.; Lawton, K. A. Genome Med2012, 4, 33.
(17) Gika, H. G.; Theodoridis, G. A.; Plumb, R. S.; Wilson, I. D. Journal of Pharmaceutical and
Biomedical Analysis2014, 87, 12-25.
(18) Aoki, W.; Tatsukami, Y.; Kitahara, N.; Matsui, K.; Morisaka, H.; Kuroda, K.; Ueda, M.
Journal of proteomics2013, 91, 417-429.
(19) Barbarin, N.; Mawhinney, D. B.; Black, R.; Henion, J. J. Chromatogr. B: Anal. Technol.
Biomed. Life Sci.2003, 783, 73-83.
(20) Cross, A. J.; Moore, S. C.; Boca, S.; Huang, W. Y.; Xiong, X.; Stolzenberg-Solomon, R.; Sinha, R.; Sampson, J. N. Cancer2014, 120, 3049-3057.
(21) Davies, S. K.; Ang, J. E.; Revell, V. L.; Holmes, B.; Mann, A.; Robertson, F. P.; Cui, N.; Middleton, B.; Ackermann, K.; Kayser, M.; Thumser, A. E.; Raynaud, F. I.; Skene, D. J.
Proceedings of the National Academy of Sciences of the United States of America2014, 111,
10761-10766.
(22) Finkel, R. S.; Crawford, T. O.; Swoboda, K. J.; Kaufmann, P.; Juhasz, P.; Li, X.; Guo, Y.; Li, R. H.; Trachtenberg, F.; Forrest, S. J.; Kobayashi, D. T.; Chen, K. S.; Joyce, C. L.; Plasterer,
(23) Aranibar, N.; Vassallo, J. D.; Rathmacher, J.; Stryker, S.; Zhang, Y.; Dai, J.; Janovitz, E. B.; Robertson, D.; Reily, M.; Lowe-Krentz, L.; Lehman-McKeeman, L. Analytical biochemistry 2011, 410, 84-91.
(24) Boda, D. Curr. Proteomics2013, 10, 237-245.
(25) Gaikwad, N. W. Anal. Chem. (Washington, DC, U. S.)2013, 85, 4951-4960. (26) Gonzalez-Dominguez, R.; Garcia-Barrera, T.; Vitorica, J.; Gomez-Ariza, J. L.
Electrophoresis2015, 36, 577-587.
(27) Beger, R. Metabolites2013, 3, 552.
(28) Crutchfield, C. A.; Olson, M. T.; Gourgari, E.; Nesterova, M.; Stratakis, C. A.; Yergey, A.
L. Journal of the American Society for Mass Spectrometry2013, 24, 230-237.
(29) Motsinger-Reif, A. A.; Zhu, H.; Kling, M. A.; Matson, W.; Sharma, S.; Fiehn, O.; Reif, D. M.; Appleby, D. H.; Doraiswamy, P. M.; Trojanowski, J. Q.; Kaddurah-Daouk, R.; Arnold, S. E.
Acta neuropathologica communications2013, 1, 28.
(30) Gonzalez-Dominguez, R.; Garcia-Barrera, T.; Gomez-Ariza, J. L. J Pharm Biomed Anal 2015, 107, 75-81.
(31) Sampson, J. N.; Boca, S. M.; Shu, X. O.; Stolzenberg-Solomon, R. Z.; Matthews, C. E.; Hsing, A. W.; Tan, Y. T.; Ji, B. T.; Chow, W. H.; Cai, Q.; Liu da, K.; Yang, G.; Xiang, Y. B.; Zheng, W.; Sinha, R.; Cross, A. J.; Moore, S. C. Cancer Epidemiol Biomarkers Prev2013, 22, 631-640.
(32) Wuolikainen, A.; Moritz, T.; Marklund, S. L.; Antti, H.; Andersen, P. M. PloS one2011, 6, e17947.
(33) Figueroa, J. D.; Cordero, K.; Serrano-Illan, M.; Almeyda, A.; Baldeosingh, K.; Almaguel, F. G.; De Leon, M. Neuroscience2013, 255, 1-18.
(34) Kuhara, T.; Ohse, M.; Inoue, Y.; Shinka, T. Journal of Mass Spectrometry2009, 44, 214-221.
(35) Wu, H.; Liu, T.; Ma, C.; Xue, R.; Deng, C.; Zeng, H.; Shen, X. Anal. Bioanal. Chem.2011, 401, 635-646.
(36) Andreas, N. J.; Hyde, M. J.; Gomez-Romero, M.; Angeles Lopez-Gonzalvez, M.; Villasenor, A.; Wijeyesekera, A.; Barbas, C.; Modi, N.; Holmes, E.; Garcia-Perez, I.
Electrophoresis2015, 36, 2269-2285.
(37) Cai, Y.; Liu, Y.; Helmy, R.; Chen, H. J. Am. Soc. Mass Spectrom.2014, 25, 1820-1823. (38) WO2014089431A1, 2014.
(39) Kami, K.; Fujimori, T.; Sato, H.; Sato, M.; Yamamoto, H.; Ohashi, Y.; Sugiyama, N.; Ishihama, Y.; Onozuka, H.; Ochiai, A.; Esumi, H.; Soga, T.; Tomita, M. Metabolomics : Official
journal of the Metabolomic Society2013, 9, 444-453.
(40) Kapoore, R. V.; Coyle, R.; Staton, C. A.; Brown, N. J.; Vaidyanathan, S. Metabolomics :
Official journal of the Metabolomic Society2015, 11, 1743-1755.
(41) Liu, C.; Lou, W.; Zhu, Y.; Yang, J. C.; Nadiminty, N.; Gaikwad, N. W.; Evans, C. P.; Gao, A. C. Cancer research2015, 75, 1413-1422.
(42) McGinnis, A. C.; Cummings, B. S.; Bartlett, M. G. Anal Chim Acta2013, 799, 57-67. (43) Huang, G.; Liu, X.; Jiao, L.; Xu, C.; Zhang, Z.; Wang, L.; Li, Y.; Yang, C.; Zhang, W.; Sun,
Y. Eur. J. Pharmacol.2014, 729, 132-137.
(45) Brown, M. V.; McDunn, J. E.; Gunst, P. R.; Smith, E. M.; Milburn, M. V.; Troyer, D. A.; Lawton, K. A. Genome Med.2012, 4, 33.
(46) Hu, Y.; Qi, Y.; Liu, H.; Fan, G.; Chai, Y. Biochimica Et Biophysica Acta-General Subjects 2013, 1830, 2779-2789.
(47) Brockmoeller, S. F.; Bucher, E.; Mueller, B. M.; Budczies, J.; Hilvo, M.; Griffin, J. L.; Oresic, M.; Kallioniemi, O.; Iljin, K.; Loibl, S.; Darb-Esfahani, S.; Sinn, B. V.; Klauschen, F.; Prinzler, J.; Bangemann, N.; Ismaeel, F.; Fiehn, O.; Dietel, M.; Denkert, C. Journal of proteome
research2012, 11, 850-860.
(48) Troyer, D. A.; Shuster, J. R.; Lance, R. Modern Pathology2013, 26, 502A-502A. (49) Nacoulma, A. P.; Vandeputte, O. M.; De Lorenzi, M.; El Jaziri, M.; Duez, P. Int. J. Mol. Sci.2013, 14, 12533-12549, 12517 pp.
(50) Wei, S.; Liu, L.; Zhang, J.; Bowers, J.; Gowda, G. A. N.; Seeger, H.; Fehm, T.; Neubauer, H. J.; Vogel, U.; Clare, S. E.; Raftery, D. Molecular Oncology2013, 7, 297-307.
(51) Li, C.; Zang, T.; Wrobel, K.; Huang, J. T. J.; Nabi, G. Anal. Bioanal. Chem.2015, 407, 3393-3404.
(52) Guertin, K. A.; Loftfield, E.; Boca, S. M.; Sampson, J. N.; Moore, S. C.; Xiao, Q.; Huang, W. Y.; Xiong, X.; Freedman, N. D.; Cross, A. J.; Sinha, R. The American journal of clinical
nutrition2015, 101, 1000-1011.
(53) Struck-Lewicka, W.; Kordalewska, M.; Bujak, R.; Mpanga, A. Y.; Markuszewski, M.; Jacyna, J.; Matuszewski, M.; Kaliszan, R.; Markuszewski, M. J. Journal of Pharmaceutical and
2 CHAPTER 2: Method Development and Quantitation of Metabolites in Prostate
Tissue Samples by Capillary Electochromatography-Mass Spectrometry
2.1 Abstract
Prostate cancer is the second “killer”cancer among males worldwide. However, there are only few
reports for early diagnosis s of prostate cancer. The aim of this project was to develop a quantitative
capillary electrochromatography coupled to tandem mass spectrometry (CEC-MS/MS) for
metabolic profiling in prostate needle biopsy extracts, based on extraction and fixation (mPREF)
technique developed by Troyer’s and coworkers.1 Through a one-step in situ polymerization, a
modified polymer monolith was successfully synthesized and characterize. With vinylbenzyl
trimethylammonium chloride (VBTA) as a monomer and a hybrid crosslinker bisphenol a
glycerolate dimethacrylate (BisGMA) and ethylene glycol dimethacrylate (EDMA), this column
has strong separation selectivity for hydrophilic metabolites. The effect of mobile phase pH, ACN
percentage and volatile additive were optimized. The CEC-MS/MS was found to be highly robust
with limit of detection (LOD) for the metabolites to range between 50 -100 nM. The validated
CEC-MS/MS method was able to differentiate and quantitate between normal versus tumor tissue
in 22 human subjects. This method could be s successfully used to examine prostate cancer with
an accuracy of 95%.
2.2 Introduction
One of the most common malignant tumors, prostate cancer1-3 is heterogeneous in clinical settings
and has a highly variable natural history. For prostate cancer diagnosis and prognosis, the present
methods have limitations making quantitative information to be valuable for patients and
and prognosis of prostate cancer by clinicians and pathologists. Troyer’s and coworkers used
molecular preservation by extraction and fixation ("mPREF"), which includes a procedure to
extract small molecules by liquid-liquid extraction using aqueous methanolic solvent.1 One of the
main advantages of mPREF is the ease with which conventional histology can be performed on
the same tissue. This unique feature of mPREF enables quantitation of small molecule metabolites.
With this method, one can screen for prostate cancer to provide the biopsy sample with useful
information on metabolites concentration change in the cancer-containing and non-cancer
containing tissue samples. In a proof-of-principle studies, Troyer’s and coworkers identified eight
significant metabolites [uracil, alanine, proline, malate, xanthine, betaine, N-acetyl aspartic acid (NAA) and N-acetyl-glucosamine (NAG) with concentration level difference between tumor and non-tumor samples. Currently there exists a need for analytical methods that permit the separation
and quantitation of aforementioned polar metabolites. Procedures utilizing gas chromatography
(GC)4 or liquid chromatography (LC) 5,6 have been developed, but are restricted to the analysis
limited biomarkers for detection of prostate cancer. In addition, for most of metabolites, the
available LC or GC column could not meet the demand of separation selectivity. Most of the
published HPLC methods are time consuming require expensive columns and employ gradient
elution or multi-step separation and detection.
Capillary electrochromatography (CEC)7 is a hybrid of HPLC and CE with the combination of
advantages for both HPLC and CE techniques. In recent years, CEC has attracted more and more
attention because of the benefits of low injection size in volume limited biological samples. Due
to the flexibility of stationary phase, fritless design and excellent performance, the polymer
monolith is one of the most suitable format in CEC. However, the low sample capacity in CEC
detector based on mass spectrometry (MS). The most popular ionization source for CEC is the use
of electrospray Ionization (ESI). With the help of sheath liquid and ESI source8, the ionic or polar
compounds separated by the CEC under low flow conditions (low nL/min range) can be efficiently
transferred from the liquid phase into gas phase ions required by MS instruments. In addition,
ESI-MS relies on the production of ions which are multiply charged. The newly emerging hyphenated
technique such as CEC-MS distinguishes analytes by both their differences in electrophoretic
mobilities and stationary phase retention whereas MS could detect the eluted compounds based on
differences in mass-to-charge-ratio. Thus, CEC-MS combines the advantages of both CEC and
MS providing high separation efficiency, determining molecular masses and/or structural
information in one analysis.
As mentioned earlier, previous research by Troyer et al. identified a subset of metabolites from
prostate needle biopsy prepared using the mPREF method as potential prostate cancer diagnostic
markers. These markers were stratified based on the analytical technique mostly applicable for
metabolite quantitation to be used in future verification studies and possible diagnostic assay
development. In this work, a CEC-MS assay is develop to quantitate eight proof of concept (POC)
metabolites that are selected from the candidate list1 including betaine, malate, proline, NAA,
NAG, uracil, xanthine, and alanine in human tissue biopsy extracts. The structure of metabolites
2.3 Experimental Section
2.3.1 Chemicals and Reagents
Vinylbenzyl trimethylammonium chloride (VBTA), Bisphenol A glycerolate dimeth-acrylate
(BisGMA), 2, 2′- azobis (2-methylpropionitrile) (AIBN), 3-(trimethoxy-silyl)propyl methacrylate
(γ-MAPS) were purchased from Sigma-Aldrich (St. Louis, MO). Ethylene glycol dimethacrylate
(EDMA) purchased from Sigma-Aldrich was distilled to remove inhibitor before its usage. The
HPLC grade acetonitrile (ACN), methanol (MeOH), triethylamine (TEA), butylamine (BA),
valeric acid (VA), heptaflurobutyric acid (HFBA), and 7.5 M ammonium acetate (NH4OAc)
aqueous solution, dimethyl sulfoxide (DMSO), alanine, uracil, malate, proline, NAA, NAG,
betaine and xanthine were all obtained from Sigma-Aldrich (St. Louis, MO). All isotope labeled
chemicals for the quantitation were obtained as follows, [D-alanine-2-d1, uracil-5-d1,
N-(carboxymethyl)-N,N,N-trimethyl-d3-ammonium Chloride (N-methyl-d3), D-proline-2,5,5-d3
from CDN Isotopes]; malic acid- L-[14C(U)] and N-acetyl aspartic acid, DL-[2,3-3H] from ARC; xanthine- 13C-15N2 from Alsachim; N-acetyl-D-[1-13C] glucosamine from Omicron. Triply deionized water (TDI, 18.2 MΩcm) was generated in the laboratory using Barnstead Nanopure II
Water System (Dubuque, IA). All the chemicals have above 98% purity.
2.3.2 Preparation of Monolithic Columns
Two different pretreatment procedures could be use to prepare the monolithic column. For the first
procedure, a 60 cm long fused silica capillary (360 μm o.d., 100 μm i.d., Polymicro Technologies,
Phoenix, AZ) was flushed under vacuum with acetone and 1 M NaOH for 15 min each. Next, the
capillary was filled with 1 M NaOH and both ends were sealed with rubber septa and heated at
HCl, triply deionized H2O, and MeOH for 15 min each under vacuum. A solution of γ-MAPS
(50%, v/v in anhydrous MeOH) was then filled through the capillary under vacuum. The filled
capillary was once again sealed with rubber septa and kept at 50 °C for 14 h in a GC oven.
The second procedure also started with 60 cm long fused silica capillary (360 μm o.d., 100 μm
i.d.). The capillary is flushed under vacuum with 1 M NaOH solution, triply deionized water, 0.1
M HCl, triply deionized water and MeOH for 3, 0.5, 0.5, 0.5 and 0.5 hrs, respectively. Next, the
capillary is flushed under vacuum with HPLC grade anhydrous MeOH for 0.5 hrs. Finally, the
capillary is flushed under vacuum with γ-MAPS (50%, v/v in anhydrous MeOH) for ~ 0.5hrs. The
filled capillary sealed with rubber septa is then placed at 60 ◦C for 20 h in a GC oven.
Both procedures were tested, and there were not much difference on the column performance.
Most experiments in this study followed the second procedure.
Next, the unreacted γ-MAPS solution was removed by flushing the capillary under vacuum using
acetone for 5 min. The vinylized capillary was eventually dried under nitrogen for 3 h at 60 °C in
a GC oven.
A typical procedure for making monolithic columns is shown in Scheme 1 and described as
follows. First, 10mg (10%, w/w) of the VBTA and 1 mg of AIBN were dissolved in a mixture
containing various compositions of crosslinker (% w/w) of BisGMA and EDMA, Table 2.1).
Table 2.1 Effect of binary crosslinker composition on physical characteristics of monolithic columns.
*Column
Crosslinker:
EDMA
(wt%)
Crosslinker:
BisGMA (wt%)
Porosity
T
Permeability
(×10−15m2) K o
EOF (cm2v
A 20 0 0.81 3.63 6.43E-04
B 15 5 0.74 2.68 6.19E-04
C 10 10 0.70 2.38 2.97E-04
D 5 15 0.65 2.26 1.78E-04
E 0 20 0.93 5.25 3.23E-04
* All columns A-E were polymerized using 10% (wt/wt) VBTA as functional monomer , 19% (wt/wt) methanol and 51% ( wt/wt) of dodecanol as porogens , AIBN 1%. (wt/wt) as initiator
To each of the mixture, porogens (dodecanol and MeOH) was added. The final polymerization
solution was then ultrasonicated for 30 min before filling the solution to the pretreated capillary
with a handheld syringe. Typically, in the preparation of CEC-MS column, 30 cm out of 60 cm of
the pretreated capillary was filled. The column was then sealed with rubber septa and was kept at
60 °C in a GC oven to polymerize. After 20 h of polymerization, the column was flushed with
ACN for 24 h to remove the unreacted monomers. The monolithic capillary was conditioned for