http://www.scirp.org/journal/ajor ISSN Online: 2160-8849
ISSN Print: 2160-8830
The Development of an Alternative Method for
the Sovereign Credit Rating System Based on
Adaptive Neuro-Fuzzy Inference System
Hakan Pabuçcu1, Tuba Yakıcı Ayan2
1Department of Business Administration, Bayburt University, Bayburt, Turkey 2Department of Econometrics, Karadeniz Technical University, Trabzon, Turkey
Abstract
The main purpose of this article is to determine the factors affecting credit rating and to develop the credit rating system based on statistical methods, fuzzy logic and artificial neural network. Variables used in this study were de-termined by the literature review and then the number of them was reduced by using stepwise regression analysis. Resulting variables were used as inde-pendent variables in the logistic model and as input variables for ANN and ANFIS model. After evaluating the models and comparing with each other, the ANFIS model was chosen as the best model to forecast credit rating. Rat-ing determination was made for the countries that haven’t had a credit ratRat-ing. Consequently, the ANFIS model made consistent, reliable and successful rat-ing forecasts for the countries.
Keywords
Credit Rating, Logistic Regression (LR), Neural Networks (ANN), Adaptive Neuro-Fuzzy Inference System (ANFIS), Comparative Studies
1. Introduction
Problems which occur during a global recession or decline periods affect all countries first and foremost developing countries. Countries lose their debt dis-charging competence and economic woes have seen almost each point of eco-nomic life. Independent credit rating agencies evaluated for government bonds in the point of predicting these kinds of problems determine credit ratings for countries and evaluate possibilities debtors failed to pay.
For credit rating studies some statistical methods such as regression analysis
[1][2], logit and probit regression analysis [3] and discriminant analysis [4] are How to cite this paper: Pabuçcu, H. and
Ayan, T.Y. (2017) The Development of an Alternative Method for the Sovereign Cre-dit Rating System Based on Adaptive Neu-ro-Fuzzy Inference System. American Jour-nal of Operations Research, 7, 41-55. http://dx.doi.org/10.4236/ajor.2017.71003 Received: November 4, 2016
Accepted: January 8, 2017 Published: January 11, 2017
Copyright © 2017 by authors and Scientific Research Publishing Inc. This work is licensed under the Creative Commons Attribution International License (CC BY 4.0).
http://creativecommons.org/licenses/by/4.0/
often used. But nowadays, determining non-linear relationships [5] instead of determining the existence of only linear relationships between variables gained importance. For that reason, advanced techniques such as neural networks, support vector machine [6], have been applied. When several studies in litera-ture were examined, credit rating was handled on the basis of enterprises and classification problem not on the basis of countries. Besides, any credit rating es-timation was made for the countries which haven’t got credit rating except [2]. In this study, rating application was carried out on the basis of countries in order to fill the gap in the literature. While performing this, assessments of three large credit rating agencies (Moody’s, S&P and Fitch) were considered. Also statistic, math and econometric models were used together with both comparative and supporting each other for credit rating application. Finally, credit prediction of 21 countries of which credit rating was not determined until today was carried out. Consequently, it is thought that this study was original and important either in respect to the methods used or in respect to determining the supremacy and deficiency of a method.
2. Sovereign Credit Rating and Related Works
There is a growing interest to sovereign credit ratings in recent years. The risk assessment performed by the rating agencies that represent the obligation of governments. A rating is a prospective forecast of the default risk. Sovereign ratings are not “country ratings”. There is an important differentiation between them. Sovereign rating is the credit risk of the national governments not the spe-cific default risk of other issuers [7]. Governments usually look for credit ratings to ease their own reach to international capital markets. Sovereign credit ratings are determined by using some macroeconomic-qualitative factors. Although so-vereign credit ratings are assigned by the credit rating agencies, lots of questions are in governments minds related with the ratings’ rationale and consistency. The real question is “how clear the factors affect sovereign credit ratings are” [1]. In this study, it is tried to determine the factors affecting the sovereign credit ratings and an alternative model to assign ratings for the countries is developed. Related works with the sovereign-credit ratings are presented as follows.
Basic variables such as income per capita, gross domestic product (GDP), growth rate, inflation, fiscal balance, external balance, external debt, default back- ground and development sorting which are used for credit valuableness in the study carried out by [1] which was shown as a reference point for almost all stu-dies regarding the credit rating. Direction and volume of Country ratings and relationship between the factors determining the ratings were tried to determine by regression analysis. [8] used the data of S&P and Moody’s in order to analyze the numeric data of credit ratings by dividing into two parts as countries have higher ratings and lower ratings.
was carried out for credit rating. Credit ratings were used as dependent variable, foreign debt/export, financial balance, external balance, inflation rate, gross na-tional product (GNP) per capita, growth rate, development situation of the country was used as an independent variable. [9] used variables of political sta-bility, government efficiency, superiority of law and illegality in order to deter-mine how official bodies affect the political organization’s credit rating. [10] in-cluded corruption perception index, the default history, commercial gap, posi-tion of a country in the world, democracy index, source of commercial laws, population and petrol production situation along with macro-economic va-riables into their models and determined the existence of a negative relationship between corruption perception. In the study, where political violence, diplomatic pressure, illegality, military domination, religious trends, effectiveness of laws, structure of democracy and foreign direct investment data were used [11] not only the macro-economic variables but also the qualitative variables were pro-vided. In this study, methodologies of credit rating agencies were handled and even GDP per capita variable could affect credit rating 80%. [12] discussed credit rating agencies and their effects on developing countries. Handled mentioned agencies within the frame of Basel 1 - 2 criteria, examined their methodologies and tried to explain qualitative and quantitative methods in details. [2] deter-mined ratings by using regression analysis for the countries which were not in-cluded in to Credit rating by Moody’s Fitch and S&P. Credit ratings and GNP per capita, GDP per capita, reserve ratios, GDP per capita volatility, inflation and superiority of law were used as explanatory variables. Most of the predic-tions made for the countries which have no rating were predicted as “B” and over. [13] examined the relationships between economic freedom, credit ratings and situation of default of country. Probit analysis and Tobit analysis were used for this study. [14] used the method to compare economic growth which was considered to affect credibility, human development and political stability. As a result of the multiple regression analysis, GDP per capita, internal debt, current account balance and human development which was adapted to inequity, af-fected debt discharging liability negatively and unemployment and political sta-bility affected debt discharging liasta-bility positively. [15] searched the reasons of change of credit ratings in developing markets and how changes of credit ratings in countries affected the bank credibility. Credit rating changes were used as de-pendent variable and economic freedom index, corruption perception index, property rights, income per capita, inflation, current account balance, financial balance and external debt were used as independent variable.
3. Description of Selected Models
3.1. Variable Selection Methodology
carried out for variable selection were assessed, it is observed that many methods were used. E.g. [18] [19] used Kernel principal components analysis, [20], [4]
used linear discriminant analysis, [17] used genetic algorithm, [21] used one way variance analysis (ANOVA), [22] used one way ANOVA, factor analysis and stepwise regression methods. In this study four different methods were imple-mented separately for variable selection and best considered stepwise regression analysis were preferred.
3.2. Logistic Regression Analysis
Simple and multiple linear regression models could be predicted by ordinary least squares (OLS). But due to the dependent variable is qualitative (disconti-nuous, categorical) OLS predicts are not reliable. For that reason, alternative models were developed such as logit and probit [23]. Logistic regression is a spe-cial condition of linear regression. But while a dependent variable could take any numeric value in logistic regression, this value should be dual or categorical [24]. In [16] and [25], logistic regression analysis is mentioned which successfully im-plemented statistical technique on credit rating studies and many fields.
3.3. Artificial Neural Network
Artificial neural network (ANN) is an advanced mathematical technique which uses intelligent learning paradigms and having several implementation fields such as social, science and engineering fields. The architectural structure of model consists of three layers such as input, hidden and output [26]. In [27]
each node in input layer transfers the value belonging to independent variable to the intermediate node and data coming to intermediate layer are combined in determined rules and transformed then mapped to target value in output layer. There is only one node in artificial neural network output layer which has been founded for credit rating. Artificial neural networks not to require to provide independent variables distributive characteristics or assumptions and they could model all non-linear relationships between input-output variables [28].
3.4. Adaptive Neuro Fuzzy Inference System
1: If is 1 and is 1then 1 1 1 1
R x A y B f = p x+q y+r (1)
2: If is 2 and is 2 then 2 2 2 2
R x A y B f = p x+q y+r (2)
Functions of node in each layer of ANFIS architecture and so the functions of layers are following respectively [31][32][33][34][35].
1st layer: Each node in this layer transfers the input signals to another layer
without implementing any collecting or activation process. 2nd layer: Node shown by square in this layer represent
i
A and Bi fuzzy clusters. The output values of these nodes are the membership levels bounded to input values and used membership functions (Equation (3)).
( )
( )
2
2 1, 2
i i i A i B O x i O y µ µ = = =
(3)
There are total four nodes for both inputs in the second layer. In this layer generally continuous or partial triangle, trapezoidal or bell shaped curve mem-bership functions is used as memmem-bership function.
Equation (4) which was formed by using a bell shape curve (Gaussian) mem-bership function density function could be used in each node for Ai and Bi expressions in order to calculate 0-1 membership levels.
( )
21 1 i i A x x m µ σ = − + (4)
Here mi and σi show the mean and standard deviation of the bell shaped curve membership function respectively. Parameters which are used in the meaning of “premise parameter” are adjusted while the network was being trained in this layer.
3rd layer: Each node was labeled by π in this layer and represents the
mul-tiply of all input signals. Here each node outputs which represents the firing strength of each rule is calculated by Equation (5).
( ) ( )
3, 1, 2
i i
i i A B
O =µ =µ x µ y i= (5)
4th layer: Outputs of node shown by N labeled circle in this layer means the
normalized threshold of the rules. Mentioned threshold could be calculated by Equation (6).
4
1 2
, 1, 2
i i i
O µ µ i
µ µ ′
= = =
+ (6) 5th layer: Each output of i node which was shown by square in this layer could
be calculated Equation (7).
(
)
5
i i i i i i i
O =µ′f =µ′ p x q y r+ + (7)
In equity, µ′i is the output of fourth layer and shows normalized firing strength. p q ri, i, i Parameter sets are used in the meaning of consequent para-meter.
output consisted in this layer (f) is calculated by Equation (8) as the sum of all coming signals.
6 i i i
i i i
i i
f
o f µ f µ
µ ′
= =
∑
=∑
∑
(8)4. Empirical Study
4.1. Data
Data of credit ratings of countries were compiled from the reports of three larg-est credit rating agencies as dependent variables. For that reason, the letter points of Moody’s, Standard & Poor’s and Fitch were transformed to numeric ratings by using a scale transformation and their averages were taken.
A variable pool was organized for the factors affecting credit rating, so coun-try risk after literature research result and data belonging to those variables and 2011-2013 years were collected for 180 countries over the world. Data belonging to three years is used as cross section data as separate units by not considering the time factor. The purpose of this increasing safe estimate ratio by providing ANFIS models better learning with more samples and neural networks. Due to deficiency of some data belonging to some countries, some countries were re-moved from the analysis. Data belonging to totally 230 units could be collected completely. Used variables and information where they obtained were submitted in Appendix A.
4.2. Variable Selection Methodology
Factor analysis, linear discriminant analysis, square discriminant analysis, step-wise regression analysis implementations were carried out in order to decrease the numbers of variable by selecting from the variable pool which was formed after a literature search. As a result of factor analysis, determined four factors. But we realized that if the number of samples increases, factor loads will change. So we decided not to use factor analysis in variable selection. When common va-riables which were used in similar studies were considered study was continued by the variables obtained from the regression analysis. The data set should pro-vide some assumption in parametric analysis. For that reason, variables were examined whether they are suitable for normal distribution and normality as-sumption was tried to provide by logarithmic transformations. Transformed va-riables were renamed by adding “LG” code. After the normality test, mul-ti-collinearity problem examination was carried out and some variables which have higher Variance Inflation Factor (VIF) values were removed from the anal-ysis.
4.3. Credit Rating Prediction Models
determinants for the credit rating problem so we decided to decrease the num-ber of determinants. After completing the variable selection process by using stepwise regression analysis; logistic regression analysis, artificial neural network and ANFIS model were implemented in order to determine the relationship of selected variables to credit rating. Finally, model performances were evaluated and predicts were made. In logistic regression analysis, which is implemented for credit rating estimate, the dependent variable was coded as (0 - 1) and possi-bility values which were calculated as analysis result were evaluated as default risks. 76% of 230 pcs data were shared for training, 13% were shared for test and 11% were shared for validation for ANN and ANFIS models. For assessing mod-el performances, total correct classification percentage and mean absolute error (MAE) scales were used. After the analysis, credit rating estimates were made for the countries which haven’t got credit ratings and models were compared.
5. Empirical Results
5.1. Variable Selection Model Results
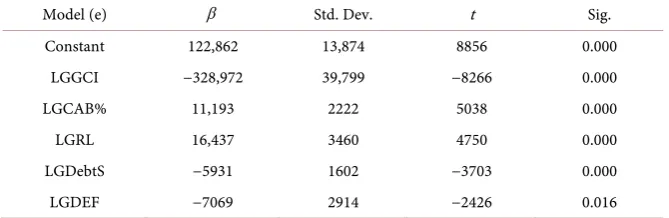
Variables determined by stepwise regression analysis in order to use for estima-tion models were submitted in Table 1.
Here; LGGCI is global competitiveness index, LGCAB% is current account balance % of export, LGRL is the rule of law, LGDebtS is debt service and LGDEF is GDP Deflator. All variables are logarithmic forms. The “grade” is the dependent variable in all models that represents credit rating of countries.
5.2. Logistic Regression Results
At this stage, variables obtained from stepwise regression analysis were used as explanatory variables. The categorical dependent variable has been formed with the classification which was made by credit rating agencies such as “investible” and “non-investible”. For that reason, “1” has been designated for the units which has credit note over 60 and “0” has been designated for the other units. As a result of logistic regression analysis, group memberships of countries were es-timated and non-default possibility (being investible country) has been calcu-lated.
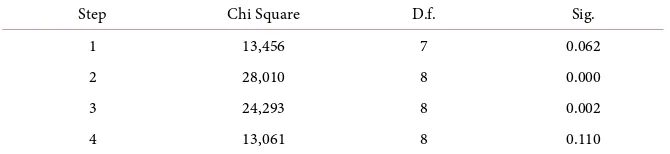
In Table 2, several explanatory coefficients used for model selection are seen and in Table 3, it is seen that the model
(
2)
13.061 ve p 0.05
[image:7.595.206.541.621.730.2]χ = > estimated
Table 1. Stepwise regression coefficient.
Model (e) β Std. Dev. t Sig.
Constant 122,862 13,874 8856 0.000 LGGCI −328,972 39,799 −8266 0.000
LGCAB% 11,193 2222 5038 0.000
LGRL 16,437 3460 4750 0.000
LGDebtS −5931 1602 −3703 0.000
Table 2. Model summary.
Step −2 Log Likelihood Cox & Snell R2 Nagelkerke R2
1 145,688 0.466 0.632
2 138,238 0.485 0.657
3 126,257 0.514 0.697
4 122,870 0.522 0.708
Table 3. Hosmer-Lemeshow test.
Step Chi Square D.f. Sig.
1 13,456 7 0.062
2 28,010 8 0.000
3 24,293 8 0.002
4 13,061 8 0.110
in fourth step according to the results of the Hosmer Lomeshow test which was implemented in order to assess model data compatibleness.
In Table 4, below logistic regression model obtained by forward selection method is as Equations (9)-(10).
A correct classification percentage which was realized by using that model as 0.88. This value is significantly higher. (The correct classification percentage was realized 72% in [36] ANN model, 75% in [2] and 92.4% in [37].) But the possi-bilities obtained from logistic regression model and credit notes comply with each other. In another saying, it is not proper to transform possibilities to credit notes. That reduces the advantage of the model.
1 2 3 4
ln 11,122 1, 982 3, 328 2, 908 68, 59
1
p
L X X X X
p
= = − + + −
− (9)
1 2 3 4
3
1 2 4
11,122 1,982 3,328 2,908 68,59
2,908
1,982 3,328 68,59
11,122 e 1
e e e e e
X X X X
X
X X X
p p
− + + −
− −
= −
=
(10)
5.3. ANN Results
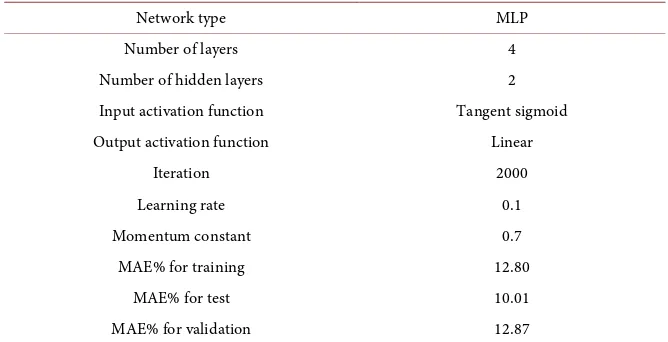
Here the relationship between dependent and independent variables was deter-mined by the multi-layer perception (MLP). Graphic examinations revealed that credit note was in the same direction with RL, CAB and GCI variables and op-posite direction with DebtS and DEF variables. Parameters about ANN archi-tectural structure and obtained error values are provided in Table 5.
5.4. ANFIS Results
[image:8.595.206.541.202.279.2]Table 4. Forward selection method results.
Step Variable β Std.
Dev. Wald D.f. Sig Exp(β)
4 LGDEF (X1)
LGCAB (X2)
LGRL (X3)
LGGCI (X4)
Constant
−1982 3328 2908 −68,590
11,122 1134 1028 1143 16,583
4966 3056 10,487
6477 17,113
5017 1 1 1 1 1
0.040 0.001 0.011 0.000 0.025
[image:9.595.205.539.229.400.2]0.138 27,892 18,322 0.000 67,670,180
Table 5. ANN model parameters and error results.
Network type MLP
Number of layers 4
Number of hidden layers 2 Input activation function Tangent sigmoid Output activation function Linear
Iteration 2000
Learning rate 0.1
Momentum constant 0.7
MAE% for training 12.80
MAE% for test 10.01
MAE% for validation 12.87
variables. Also model with five variables were trained by two membership func-tion, but good results were not taken.
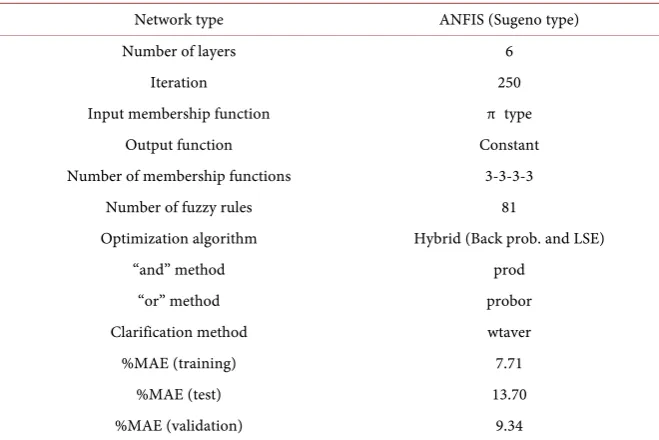
When mean absolute percentage errors (%MAE) related to ANFIS model in
Table 6 were examined and compared with in Table 5, it is understood that it was trained well compared to ANN and could make better estimations with lower error percentage.
Figure 1 and Figure 2 shows the training errors trend of ANFIS model addi-tion to MAE statistics in Table 6 which is an indicator of whether the network was trained or not. As seen both errors in percentage (E%) and absolute percen-tage errors (AE%) trends approach to zero by decrease rapidly. The horizontal axis represents the sample number.
Also, it is seen in the graphics that errors belong to 60 and 62 numbered units are extremely large. When these units were excluded to obtain a more realistic value, MAE% value for training data was reduced 0.0771 to 0.0684.
While prediction success was 87.13% in ANN model, the higher accuracy percentage was obtained as 90.66% in ANFIS model. Here it is seen that ANFIS model can comprehend nonlinear relationships between variables successfully.
6. Conclusions
Table 6. ANFIS model parameters and error results.
Network type ANFIS (Sugeno type)
Number of layers 6
Iteration 250
Input membership function π type
Output function Constant
Number of membership functions 3-3-3-3
Number of fuzzy rules 81
Optimization algorithm Hybrid (Back prob. and LSE)
“and” method prod
“or” method probor
Clarification method wtaver
%MAE (training) 7.71
%MAE (test) 13.70
[image:10.595.208.538.88.308.2]%MAE (validation) 9.34
Figure 1. ANFIS percentage training error.
Figure 2. ANFIS absolute percentage training error.
[image:10.595.60.536.513.672.2]ANN and ANFIS models were compared and credit rating predictions were made for the countries which have not. When several studies were examined about credit rating, these are seen as micro rating applications such as company or bond rating. Most of these studies handled the problem as a classification problem. Designed models here handled the credit rating problem as country risk graded and configured directly for predicting credit rating estimation. This study is considered to contribute to literature in respect to trying different statis-tical methods during variable selection, determining ANFIS model as the best among several prediction methods, success of credit rating prediction and risks of 21 countries firstly measured.
Besides the main targets of this study, another examined issue is whether group membership possibilities could have transformed into credit ratings. Even group membership shows significantly good predictions for countries which have higher credit ratings; it was not same for the countries which have lower credit ratings. It is clear that LR credit rating prediction which has 88% correct accuracy classification success is unsuccessful in respect to credit rating estima-tion.
ANN and ANFIS are the models which learn the relationships over case stu-dies and generate predictions. For that reason, it should be noted that as the number of samples increases, the correct estimation rates increase. Also, it is important that obtained data should be reliable. Relationships learned from in-correct data cause inin-correct predictions. These models are considered useful to determine more complicated relationships instead of simple linear relationships. But due to these complicated relationships, it cannot be expressed by a simple equation; prediction equation could not be revealed after analysis.
ANFIS method which was the best among three prediction models with 91% accuracy percentage was used for first credit rating predictions of 21 countries (Appendix B). Thereby the developed ANFIS model proved its prediction suc-cess on the verification data set. Consequently, it was revealed that ANFIS model is the most proper model in order to measure country risks and assign credit ratings and it could be used trustfully.
ANFIS model is selected as the best prediction model because of its mathe-matical hybrid structure and learning algorithm. All possible structure and pa-rameters are tried for LR and ANN. For the future research, it's possible to apply another artificial intelligence technic or heuristic-metaheuristic search technic for variable selection and credit rating prediction.
References
[1] Cantor, R. and Packer, F. (1996) Determinants and Impact of Sovereign Credit Ratings. Journal of Fixed Income, 6, 76-91. https://doi.org/10.3905/jfi.1996.408185
[2] Ratha, D., De, P.K. and Mohapatra, S. (2011) Shadow Sovereign Ratings for Unrated Developing Countries. World Development, 39, 295-307.
https://doi.org/10.1016/j.worlddev.2010.08.006
Appli-cations, 30, 415-425. https://doi.org/10.1016/j.eswa.2005.10.002
[4] Subasi, A. and Gursoy, I.M. (2010) EEG Signal Classification Using PCA, ICA, LDA and Support Vector Machines. Expert System with Applications, 37, 8659-8666.
https://doi.org/10.1016/j.eswa.2010.06.065
[5] Harris, T. (2015) Credit Scoring Using the Clustered Support Vector Machine. Ex-pert System with Applications, 42, 741-750.
https://doi.org/10.1016/j.eswa.2014.08.029
[6] Jones, S., Johnstone, D. and Wilson, R. (2015) An Empirical Evaluation of the Per-formance of Binary Classifiers in the Prediction of Credit Ratings Changes. Journal of Banking & Finance, 56, 72-85. https://doi.org/10.1016/j.jbankfin.2015.02.006
[7] Beers, T.D. and Cavanaugh, M. (2004) Sovereign Credit Ratings: A Primer. Stan-dard & Poor’s, New York.
[8] Bissoondoyal-Bheenick, E. (2005) An Analysis of the Determinants of Sovereign Ratings. Global Finance Journal, 15, 251-280.
https://doi.org/10.1016/j.gfj.2004.03.004
[9] Butler, A.W. and Fauver, L. (2006) Institutional Environment and Sovereign Credit Ratings. Financial Management, 35, 53-79.
https://doi.org/10.1111/j.1755-053X.2006.tb00147.x
[10] Depken, C., LaFountain, C. and Butters, R. (2007) Corruption and Creditworthi-ness: Evidence from Sovereign Credit Ratings. Working Papers 0601, Department of Economics, University of Texas at Arlington.
[11] Busse, M. and Hefeker, C. (2007) Political Risk, Institutions and Foreign Direct In-vestment. European Journal of Political Economy, 23, 397-415.
https://doi.org/10.1016/j.ejpoleco.2006.02.003
[12] Elkhoury, M. (2009) Credit Rating Agencies and Their Potential Impact on Devel-oping Countries. Compendium on Debt Sustainability, 165-180.
[13] Roychoudhury, S. and Lawson, R.A. (2010) Economic Freedom, the Credit Ratings and the Sovereign default spread. Journal of Financial Economic Policy, 2, 149-162.
https://doi.org/10.1108/17576381011070201
[14] Bundala, N.N. (2013) Do Economic Growth, Human Development and Political Stability Favour Sovereign Creditworthiness of a Country? A Cross Country Survey on Developed and Developing Countries. International Journal of Advances in Management and Economics, 1, 32-46.
[15] Williams, G., Alsakka, R. and Gwilym, O. (2013) The Impact of Sovereign Rating Actions on Bank Ratings in Emerging Markets. Journal of Banking & Finance, 37, 563-577. https://doi.org/10.1016/j.jbankfin.2012.09.021
[16] Leonard, K.J. (1995) The Development of Credit Scoring Quality Measures for Consumer Credit Applications. International Journal of Quality & Reliability Man-agement, 12, 79-85. https://doi.org/10.1108/02656719510087346
[17] Hajek, P. and Michalak, K. (2013) Feature Selection in Corporate Credit Rating Prediction. Knowledge-Based Systems, 51, 72-84.
https://doi.org/10.1016/j.knosys.2013.07.008
[18] Li, W., He, Q., Fan, X. and Fei, Z. (2012) Evaluation of Driver Fatigue on Two Channels of EEG Data. Neuroscience Letters, 506, 235-239.
https://doi.org/10.1016/j.neulet.2011.11.014
[19] Zhao, C., Zheng, C., Zhao, M., Tu, Y. and Liu, J. (2011) Multivariate Autoregressive Models and Kernel Learning Algorithms for Classifying Driving Mental Fatigue Based on Electroencephalographic. Expert System with Applications, 38, 1859-1865.
[20] Boostani, R., Sadatnezhad, K. and Sabeti, M. (2009) An Efficient Classifier to Diag-nose of Schizophrenia Based on the EEG Signals. Expert System with Applications, 36, 6492-6499. https://doi.org/10.1016/j.eswa.2008.07.037
[21] Huang, Z., Chen, H., Hsu, C.J., Chen, W.H. and Wu, S. (2004) Credit Rating Analy-sis with Support Vector Machines and Neural Networks: A Market Comparative Study. Decision Support Systems, 37, 543-558.
https://doi.org/10.1016/S0167-9236(03)00086-1
[22] Kim, K.S. and Han, I. (2001) The Cluster-Indexing Method for Case-Based Rea-soning Using Self-Organizing Maps and Learning Vector Quantization for Bond Rating Cases. Expert System with Applications, 21, 147-156.
https://doi.org/10.1016/S0957-4174(01)00036-7
[23] Gujarati, D.N. (2003) Student Solutions Manual for Use with Basic Econometrics. 4th Edition, McGraw Hill, New York.
[24] Hosmer, D.W. and Lemeshow, S. (2004) Applied Logistic Regression. 2th Edition, Wiley, New York.
[25] Hand, D.J. and Henley, W.E. (1997) Statistical Classification Methods in Consumer Credit Scoring: A Review. Journal of Royal Statistical Society, 160, 523-541.
https://doi.org/10.1111/j.1467-985X.1997.00078.x
[26] Yu, L., Wang, S. and Lai, K.K. (2008) Forecasting Crude Oil Price with an EMD- Based Neural Network Ensemble Learning Paradigm. Energy Economics, 30, 2623- 2635. https://doi.org/10.1016/j.eneco.2008.05.003
[27] Smith, K.A. and Gupta, J.N.D. (2002) Neural Networks in Business: Techniques and Applications. IGI Global, New York.
[28] Jardin, P. and Séverin, E. (2012) Forecasting Financial Failure Using a Kohonen Map: A Comparative Study to Improve Model Stability over Time. European Jour-nal of OperatioJour-nal Research, 221, 378-396.
https://doi.org/10.1016/j.ejor.2012.04.006
[29] Takagi, T. and Sugeno, M. (1985) Fuzzy Identification of Systems and Its Applica-tions to Modeling and Control. IEEE Transactions on Systems Man & Cybernetics, 15, 116-132. https://doi.org/10.1109/TSMC.1985.6313399
[30] Jang, J.S.R. (1993) ANFIS: Adaptive-Network-Based Fuzzy Inference system. IEEE Transactions on Systems Man & Cybernetics, 23, 665-685.
https://doi.org/10.1109/21.256541
[31] Jang, J. (1991) Fuzzy Modeling Using Generalized Neural Networks and Kalman Filter Algorithm. Proceeding of 9th National Conference Artificial Intelligence, 91, 762-767.
[32] Jang, J.S.R. (1993) ANFIS: Adaptive-Network-Based Fuzzy Inference System. IEEE Transactions on Systems Man & Cybernetics, 23, 665-685.
https://doi.org/10.1109/21.256541
[33] Jang, J.S.R. (1996) Input Selection for ANFIS learning. Proceeding IEEE 5th Inter-national Fuzzy Systems, 2, 1493-1499. https://doi.org/10.1109/FUZZY.1996.552396
[34] Fullér, R. (1995) Neural Fuzzy System.
[35] Lin, C.T. and Lee, C.S.G. (1991) Neural-Network-Based Fuzzy Logic Control and Decision System. IEEE Transaction on Computers, 40, 1320-1336.
https://doi.org/10.1109/12.106218
[36] Leshno, M. and Spector, Y. (1996) Neural Network Prediction Analysis: The Bank-ruptcy Case. Neurocomputing, 10, 125-147.
Appendix A
Variable Code Source
Credit rating Democracy index
External debt Exchange rate stability Economic freedom index
Inequality adjusted human development index GDP growth
GDP deflator Import (Percentage GDP) Export (Percentage GDP) Saving rate (Percentage GDP) Current account (Percentage GDP)
Human development index Current account balance (Percentage export)
Debt service (Percentage export) Employment (%Total) Easy of doing business
Rule of law GNP per capita Global competitiveness index
Population Political stability Consumer price index
Regulatory Quality Grade DI ExD ExSt EFI IHDI GdpGr DEF IMP EXP SAVE CAB HDI CAB% DebtS EMP EB RL GNP GCI POP POL CPI RQ
Moody’s, S&P and Fitch The Economist World Bank www.prsgroup.com www.heritage.org www.tr.undp.org World Bank World Bank World Bank World Bank World Bank World Bank www.tr.undp.org World Bank www.prsgroup.com World Bank World Bank World Bank World Bank www.weforum.org World Bank World Bank World Bank World Bank
Appendix B
Country GCI CAB RL DebtS Grade Grade Guyana 3.731 −24.047 −0.519 2.465 45.7 B Gambia 3.83 −13.3 −0.544 45.25 46.4 B Moldova 3.886 −8.153 −0.372 16.87 42.8 B Liberia 3.713 −39.2 −0.92 2.1 63 BB+ Sierra Leone 4.194 −9.8 −0.873 6.98 48.5 B+
Nicaragua 3.731 −15.741 −0.735 3.769 50.6 B+ Libya 3.679 11.46 −1.148 10.358 50.7 B+ Haiti 2.9 −5.261 −1.344 1.5038 51 B+ Guinea 2.904 −9.473 −1.437 13.143 51.2 B+ Zimbabwe 3.343 −18.505 −1.618 15.345 51.3 B+ Mali 3.427 −4.914 −0.692 0.388 50.6 B+ Malawi 3.379 12.177 −0.244 7.069 54.1 BB− Burkina Faso 3.342 −4.2 −0.433 38.46 49.9 B+
Madagascar 3.378 −6.2 −0.891 11.17 51.1 B+ Yemen 2.965 −5.2 −1.265 29.56 51 B+ Algeria 3.716 6.45 −0.795 1.974 50.8 B+ Tanzania 3.6 −10.7 −0.576 4.06 47.3 B South Korea 5.021 1.801 1.023 9.893 88.1 AA−
Submit or recommend next manuscript to SCIRP and we will provide best service for you:
Accepting pre-submission inquiries through Email, Facebook, LinkedIn, Twitter, etc. A wide selection of journals (inclusive of 9 subjects, more than 200 journals)
Providing 24-hour high-quality service User-friendly online submission system Fair and swift peer-review system
Efficient typesetting and proofreading procedure
Display of the result of downloads and visits, as well as the number of cited articles Maximum dissemination of your research work
Submit your manuscript at: http://papersubmission.scirp.org/