Munich Personal RePEc Archive
The effect of board structure on firm
value: a multiple identification strategies
approach using Korean data
Black, Bernard and Kim, Woochan
Northwestern University, KDI School of Public Policy and
Management
9 July 2011
The effect of board structure on firm value: a multiple identification
strategies approach using Korean data†
Bernard Blacka,*, Woochan Kimb a
Northwestern University, Evanston, USA
b
KDI School of Public Policy and Management, Seoul, Korea
Journal of Financial Economics, forthcoming 2011
ABSTRACT
Outside directors and audit committees are widely considered to be central elements of good corporate governance. We use a 1999 Korean law as an exogenous shock to assess how board structure affects firm market value. The law mandates 50% outside directors and an audit committee for large public firms, but not smaller firms. We study how this shock affects firm market value, using event study, difference-in-differences, and instrumental variable methods, within a regression discontinuity approach. The legal shock produces large share price increases for large firms, relative to mid-sized firms; share prices jump in 1999 when the reforms are announced.
Key words: Korea, outside directors, audit committees, corporate governance, board of directors
JEL classification: G32, G34, G38
† We thank Vladimir Atanasov, Shantanu Banerjee, Ryan Bubb, Jay Dahya, Sadok El Ghoul, Assaf Hamdani, Jay Hartzell, Jung-Wook Kim, Jonathan Klick, Kate Litvak, Yair Listokin, Andrew Metrick, David Musto, Oghuzan Ozbas, Sheridan Titman, Sonia Wong, Karen Wruck, Yin-Hua Yeh, Mengxin Zhao, an anonymous referee, and participants in workshops at Asia Finance Association 2007 Annual Meeting (where this paper received the Pacific Basin Award for best paper presented at the conference), American Law and Economics Association Annual Meeting, Canadian Law and Economics Association 2007 Annual Meeting, Columbia Law School Conference on Mel Eisenberg's The Structure of the Corporation: Thirty Years Later (2006), European Financial Management Association 2007 Annual Meeting, 2007 China International Conference in Finance, European Finance Association 2007 Annual Meeting, 2008 Conference on Financial Economics and Accounting, Third International Conference on Asia-Pacific Financial Markets (2008), 2010 University of Alberta Frontiers in Finance Conference, KDI School of Public Policy and Management, University of Southern California, Marshall School of Business, University of Texas, McCombs School of Business, Wharton School of Management for comments, and Hyun Kim for research assistance.
* Corresponding author.
2
-1. Introduction
A minimum number of outside directors (perhaps a majority), and an audit committee
staffed principally or solely by outside directors, are standard corporate governance prescriptions.
Both are prescribed by law in many countries, and are central components of most “comply or
explain” corporate governance codes. Yet convincing empirical strategies that can address the
likely endogeneity of governance and let us assess how these prescriptions affect firm value are
often not available.
The principal advance in this paper is to use a legal shock to governance as a basis for
identification for a connection between board structure and firm market value, proxied by
Tobin’s q. In 1999, in response to the 1997–1998 East Asian financial crisis, Korea adopted
governance rules, effective partly in 2000 and partly in 2001, which require "large" firms (assets
greater than 2 trillion won, around $2 billion) to have 50% outside directors, an audit committee
with an outside chair and at least two-thirds outside members, and an outside director nominating
committee. Smaller firms must have 25% outside directors.
Prior papers that seek to address endogeneity include Wintoki, Linck, and Netter (2009),
who use Arellano-Bond “internal” instruments and find no connection between board
composition and firm performance in the US. Dahya and McConnell (2007) report that UK
firms which comply with the voluntary Cadbury Committee recommendation to have at least
three nonexecutive directors experienced improved performance. Black, Jang, and Kim (2006a),
a predecessor to this paper (henceforth BJK), use the same legal shock as we do and find that
firms subject to these rules have higher Tobin’s q’s than smaller firms.
BJK use cross-sectional data from 2001. In contrast, we build a panel data set which
3
-covering almost all public companies listed on the Korea Stock Exchange (KSE). We seek to
identify a change in the market value of large firms, relative to mid-sized firms, both in size (is
there a jump in Tobin's q at the 2-trillion-won threshold) and in time (does the value of large
firms jump when the reforms are announced). We conduct event study and
difference-in-differences (DiD) estimation of the effect of adopting these rules, with large firms as the
treatment group and mid-sized firms as the control group. We support the event study and DiD
analyses with firm fixed effects and instrumental variable (IV) analyses. We report consistent
evidence across approaches for a connection between board structure (outside directors and audit
committees) and firm market value.
A central empirical challenge is to assess whether large firms rose in value for reasons
unrelated to the legal shock. We do so in a number of ways. First, we use a regression
discontinuity framework to control for a possible continuous effect of firm size on firm market
value. Second, the share prices and Tobin's q's of large firms jump relative to mid-sized firms
when they should—during the mid-1999 period when the main legislative events occur. Third,
we find no near-term changes in large firms' profitability or growth which might explain the
1999 jump. Fourth, we conduct event studies in six comparable East Asian countries and find
no evidence that large firms outperform mid-sized firms there during our event period. Fifth,
smaller firms which voluntarily adopt the principal reforms have similar value increases to those
we observe for large firms.
The estimated effects are economically important. In our event study, large firms' share
prices rise by an average of 15% relative to mid-sized firms over a broad window covering our
principal events. Our DiD results suggest a roughly 0.13 increase in ln(Tobin's q) from June 1,
The event study and DiD results cannot tell us how much of the value increase reflects
each of the reforms. To assess this question, we study both large and small firms, using firm
fixed effects. We find evidence supporting separate value from having (a) 50% outside directors,
(b) having more than 50% outside directors, and less strongly (c) an audit committee.
Some limitations of this research: First, the results may not generalize beyond Korea.
Second, we cannot assess to what extent large firms' market value gains reflect increases in
overall firm value (which implies that these firms were out of equilibrium before the reforms),
versus a transfer of value from insiders to outside investors. In related work (Black, Kim, Jang
and Park, 2011; henceforth BKJP), we find evidence for both sources. Large firms opposed the
reforms, which suggests that firm controllers did not expect net gains for them. Third, our
empirical strategy does not let us study how different aspects of board structure affect firm
market value.
Section 2 of this paper reviews the related literature and discusses the principal empirical
challenges. Section 3 describes our data sources and our governance indices. Section 4
presents event study results. Section 5 presents DiD results. Section 6 presents firm fixed
effects results. Section 7 presents IV results, and Section 8 concludes.
2. Literature review and empirical issues
Section 2.1 reviews the principal challenges for empirical research on the valuation
effects of board structure or corporate governance more generally. Section 2.2 discusses our
2.1. Empirical challenges
The literature on boards of directors is large, but most studies lack a sound basis for
causal inference (often, if imprecisely, called identification). For a recent review, see Adams,
Hermalin, and Weisbach, 2010).1 Board structure is usually chosen by the firm and thus could
be endogenous to other firm characteristics (see, e.g., Hermalin and Weisbach, 1998, 2003; Lehn,
Patro, and Zhao, 2009; Harris and Raviv, 2008). One problem is reverse causation, with firm
performance influencing board composition. In developed countries, firms respond to poor
performance by increasing board independence (Bhagat and Black, 2002; Erickson, Park,
Reising, and Shin, 2005). Thus, one cannot infer causation from studies which find an
association between board independence and firm performance – whether negative (Agrawal and
Knoeber, 1996; Bhagat and Black, 2002; Yermack, 1996, all studying the US)—or positive (Choi,
Park and Yoo, 2007(Korea); Dahya, Dimitrov, and McConnell, 2008 (multicountry); Yeh and
Woidtke, 2005 (Taiwan)). Optimal governance could also depend on firm characteristics.
There is evidence that board structure adapts to firm-specific circumstances (see, e.g., Agrawal
and Knoeber, 2001; Boone, Field, Karpoff, and Raheja, 2007; Coles, Daniel, and Naveen, 2008;
Gillan, Hartzell, and Starks, 2006; Linck, Netter, and Yang, 2007).2 Several articles contend
that due to these problems, we know little about how corporate governance affects firm value or
performance (see, e.g., Chidambaran, Palia, and Zheng, 2006; Lehn, Patro, and Zhao, 2007;
Listokin, 2007).
1
The Korean reforms have two central components—outside directors and audit committees. We discuss in the text the prior research on board composition. Research on the connection between audit committees and overall firm value is limited, and does not offer convincing identification. Klein (1998) finds a correlation between the presence of an audit committee and a variety of accounting and market performance measures. Vafaes and Theodorou (1998) and Weir, Laing, and McKnight (2003) find similar results in the UK.
2
Several prior studies address identification, but all have limitations. Wintoki, Linck, and
Netter (2009) (US) find that board independence predicts Tobin’s q with firm fixed effects, but
significance disappears if they use Arellano-Bond GMM “internal instruments” for board
independence. This could, however, reflect the limited power of the Arellano-Bond procedure.
Dahya and McConnell (2007) find improved operating performance for UK firms which increase
their number of nonexecutive directors to three to comply with the Cadbury Committee “comply
or explain” governance recommendation. However, this study has potential selection bias, both
in which firms had fewer than three nonexecutive directors prior to the Cadbury report, and
which firms chose to comply after the report was issued.3 Black and Khanna (2007) use an
event study of a broad Indian corporate governance reform, which emphasizes but is not limited
to board independence and audit committees. BJK is the most similar to this article and use the
same legal shock, but have only cross-sectional data in 2001; thus the main empirical strategies
used here, which focus on the time of the shock, are not available.
2.2. Multiple causal inference strategies approach
This paper builds on BJK. We seek to address the principal limitations of BJK and
strengthen the evidence for a causal connection between the 1999 reforms and the market values
of large Korean firms.4 We extend the BJK data, which is from mid-2001, back to 1996 and
forward to 2004, thus covering the period before, during, and after the 1999 reforms and the
3
Arcot and Bruno (2007) and MacNeil and Li (2006) report that well-performing UK firms are more likely to explain rather than fully comply with the current UK Combined Code of Corporate Governance, a successor to the Cadbury Code.
4
2000–2001 effective dates of those reforms. We then use event study and DiD analyses to
estimate the effect of the reforms on firm market value in time (when the reforms were adopted)
as well as in size. We confirm that large firms in other similar East Asian countries did not
experience a similar price rise at the same time as large Korean firms, that the value effect of the
reforms persists through the end of 2004, and that voluntary board changes by small firms
produce similar price effects to the large firm reforms. We search for, and do not find, evidence
to support a non-governance explanation for the mid-1999 jump in large firm prices. IV
analysis provides a robustness check on the DiD results. We use a regression discontinuity
approach (see, e.g., Angrist and Lavy, 1999; Imbens and Lemieux, 2008), in which we control
for a smooth effect of firm size on firm market value, and also limit the size range for control and
treatment firms, to the extent our sample size permits. We find consistent results across
approaches.5
We cannot assess here whether the shock-related increase in large firms' market values
reflects an initial out-of-equilibrium position, in which the legal shock improves firm efficiency;
wealth transfer from insiders to outsiders (which would increase market value but not
unobserved total value); or both. In a companion paper, BKJP find evidence for both broad
channels. The existence of plausible channels through which board structure could affect firms'
market values further supports a causal link between board structure and firm market value.6
5
Our identification strategy complements an alternate means of addressing endogeneity, by developing a structural model. Examples include Coles, Lemmon and Meschke (2007) for managerial ownership; Harris and Raviv (2008) for board structure; and Himmelberg, Hubbard, and Love (2002) for investor protection rules.
6
3. Data and governance index construction
3.1. Event dates
Prior to 1998, few Korean firms had outside directors and almost none had 50% outside
directors, except for a few banks and majority state-owned enterprises (SOEs). Corporate law
did not permit an audit committee or other board committees. Following the 1997–1998 East
Asian financial crisis, Korean firms elected more outside directors and introduced other
governance reforms, partly voluntarily and partly due to legal changes. Legal reforms in 1998
required all public firms to have at least 25% outside directors. The corporate law was
amended in 1999 to permit board committees. The large-firm rules we focus on here (50%
outside directors, audit committee, and outside director nominating committee) were adopted in
1999, with the principal legislative event dates in June-August, legislative action in December,
and the rules coming into force at firms’ annual shareholder meetings in spring 2000 (audit
committee and outside director nominating committee) and 2001 (50% outside directors).7
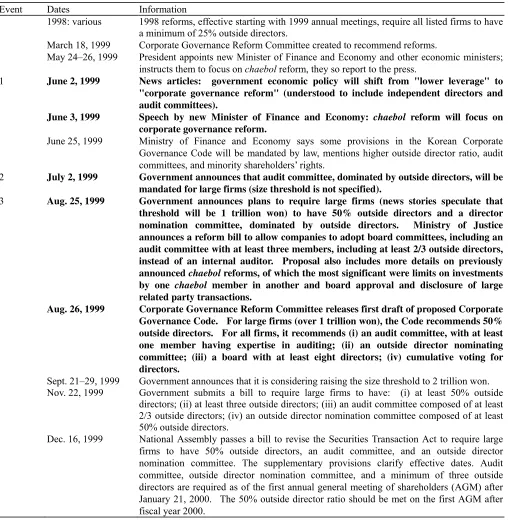
We search Korean newspapers for news announcements related to the 1999 legal reforms,
and extract four potential event dates, summarized in Table 1.8 Announcements on June 2–3,
1999 (event 1) indicated that the government would amend Korea's corporate governance rules,
focusing on chaebol reform. Prior news stories made it clear that the reforms would focus on
audit committees and on outside directors. A June 25, 1999 announcement provides detail, but
nothing significantly new, so we omit this date in the analysis below. On July 2, 1999, the
government announced that the rules would apply to “large” firms (rather than chaebol firms as
7
Large firms were required to have at least three outside directors by their 2000 meeting. This was primarily a transition rule, but also acted as a minimum board size requirement: A firm which wanted exactly 50% outside directors needed to have at least six directors.
8
such) but did not specify a size threshold (event 2). The first specification of the size threshold
came on August 25, 1999, when the Ministry of Finance circulated a draft law which specified a
1 trillion won threshold, and required large firms to have 50% outside directors and an audit
committee with at least two-thirds outside directors (event 3). There were conflicting
announcements over whether the size threshold would be raised to 2 trillion won during Sept.
21–29; the threshold was stated at 2 trillion won on October 20, but this was likely anticipated
due to the prior announcements. Legislative action was unlikely to be significant. There was
little doubt that the legislature would adopt the government's proposal and it did so, without
significant change, a few weeks after the government bill was introduced.
Given this history, we must decide which firms belong to the treatment group for each
event. The government's early public statements stressed chaebol reform, rather than large-firm
reform, so we treat chaebol firms as the treatment group for event 1. Event 2 included the first
statement that the reforms threshold would be size-based, but the size threshold was not stated.
The size threshold was first stated as 1 trillion won in August (event 3). The reforms were
developed by a public-private Corporate Governance Reform Committee, which surely consulted
informally with major Korean firms. Thus, market participants likely had a rough sense for the
likely size threshold before it was announced. For events 2 and 3, we use 1 trillion won in
assets at year-end 1998 as the dividing line between treatment and control firms. By the time of
legislative adoption, the threshold was raised to 2 trillion won. We therefore use a 2 trillion
won threshold for our DiD and IV results, for which the “after” date is December 1999, after the
reforms are complete. We refer to over-1-trillion (2-trillion) won firms as "large-plus" (large)
firms.
reforms.9 The chaebol were able to get the threshold raised to 2 trillion won and delay full
implementation until 2001, but could not block the reforms. The government also announced
some less significant reforms, limited to chaebol firms, during August 1999. We confirm in
horserace regressions that a large-plus dummy is significant, and a chaebol dummy is not, for
event periods that include these announcements.10
3.2. Sample, governance index, and variables
We study Korean companies listed on the Korea Stock Exchange, excluding banks and
SOEs (our sample would otherwise include 14 banks and six SOEs). We determine board
composition at six-month intervals from 1998–2004, relying on books published annually by the
Korea Listed Companies Association (KLCA).
To limit omitted variable bias, we want to control for other attributes of firm governance,
which often correlate with board structure and could separately predict firm market value. We
rely on a Korean corporate governance index (KCGI) from 1998–2004, developed and described
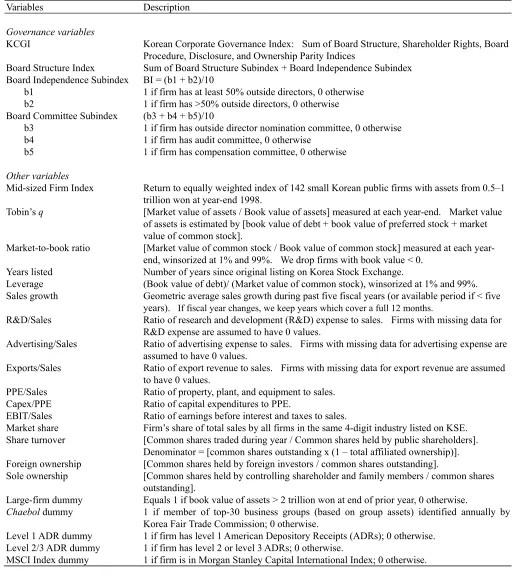
in BKJP, and summarized in Table 2. Observations of KCGIare at year-end, except for 2001,
when we also have mid-year data. KCGI (0 ~ 100) consists of five equally weighted indices:
Board Structure; Board Procedure; Shareholder Rights; Disclosure; and Ownership Parity.
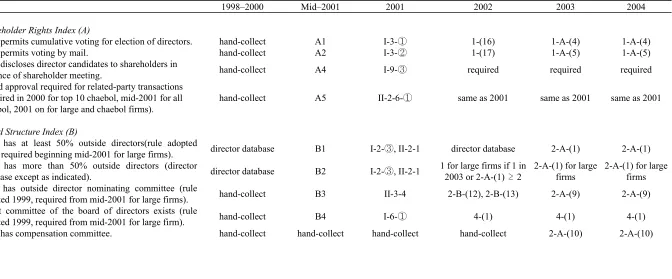
Board Structure index is composed of Board Independence subindex (2 elements, 0 ~ 10),
and Board Committee subindex (3 elements, 0 ~ 10), defined as:
Board Independence subindex = 10*(b1 + b2)/2:
9
See, for example, Ikwon Lee, FKI asks government to repeal outside director ratio, Korean Economic Daily (Sept. 7, 1999).
10
b1 = 1 if firm has 50% outside directors; 0 otherwise;
b2 = 1 if firm has > 50% outside directors; 0 otherwise.
Board Committee subindex = 10*(b3 + b4 + b5)/3:
b3 = 1 if firm has outside director nominating committee, 0 otherwise;
b4 = 1 if firm has audit director committee, 0 otherwise;
b5 = 1 if firm has compensation committee, 0 otherwise.
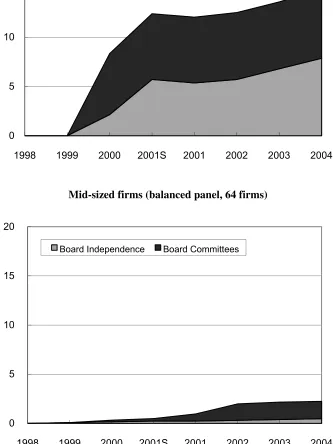
The 1999 law requires large firms to have elements b1, b3, and b4. For a firm which previously
had none of these elements, Board Structure Index will rise from zero to 11.67, out of 20
possible points. The large-firm mean in fact rises from 0.20 in 1998 (one large firm had 50%
outside directors, none had audit or other committees) to 12.47 in spring 2001. Figure 1 shows
the mean Board Independence and Board Committee subindex values over time for balanced
panels of large and small Korean public firms, respectively.
We use an extensive set of control variables, listed in Table 7, to further limit omitted
variable bias. Data come from various sources. Financial data, foreign ownership, and listing
year is from the KLCA’s TS2000 database; information on chaebol firms is from annual press
releases by the Korean Fair Trade Commission; stock market data are from the KSE; American
Depository Receipt (ADR) data are from JP Morgan and Citibank websites; and industry
classifications are the Korea Statistics Office. Table 3, Panel A defines the principal variables
4. Event study
If the 1999 rules for large-firm governance affect market value, investors anticipate this
effect when the legislation is proposed, and key legislative dates can be determined; an event
study can help to identify a causal impact of the reforms on market value.
4.1. Event study methodology
We use two principal event study methods. First, we use a regression approach to
estimate the returns to treatment group firms, relative to a control group, over each event period.
Recall from Section 3.1 that the treatment group is chaebol firms for event 1, and large-plus
firms (assets greater than 1 trillion won) for events 2 and 3. Consider events 2 and 3 first.
Ideally, to strengthen causal inference, one would want the treatment (control) group to include
only firms just above (below) the size threshold. This reduces the risk that firm size, rather than
governance reforms, explains our results. But narrow bands limit the number of sample firms,
thus reducing statistical power and raising the risk of a spurious result driven by non-governance
returns to a modest number of treated firms. We address these competing concerns by using
mid-sized firms with assets from 0.5–1 trillion won (n = 47) as the control group; and two
alternate treatment groups: a “main” treatment group of firms with assets from 1–4 trillion won
(n = 54), and a “narrow” group with assets from 1–1.5 trillion won (n = 18).
For event 1, the distinction between treatment and control groups is not size-based, but
most chaebol are large.11 We again exclude small firms from the sample entirely, as not
comparable to the treatment group. We also exclude very large chaebol firms (assets greater
than 8 trillion won) because there are no very large non-chaebol firms. Thus, the control group
11
is non-chaebol with assets from 0.5 to 8 trillion, and the treatment group is chaebol in this size
range.12
We compute cumulative market adjusted returns (CMARs) to the treatment firms during
the event period, relative to a "Mid-sized index"—an equally weighted index of control group
returns. The CMARs are the sum of daily market-adjusted returns over the event period. Size is
measured at year-end 1998.We regress the CMARs on a treatment group dummy variable and
control variables of interest. A typical regression is:
+
* ( * )
i treatment j j i
j
CMAR D
X (1)Here, Dtreatment is the treatment group dummy and Xj is a vector of control variables. The
coefficient captures the predicted CMAR for treatment group firms over the event period.
The event period is common to all firms in our sample. This makes it likely that
individual firm returns violate the usual regression assumption of independent observations.
Firms in the same industry could move together, or large-plus (small) firms could move with
other large-plus (small) firms. We therefore compute standard errors using industry-group
clusters, with industries based on four-digit Korea industry codes. We return to the problem of
cross-sectional correlation of returns below. We drop outlier observations for which a studentized
residual obtained by regressing the dependent variable (CMAR or CAR) on chaebol dummy (for
12
In robustness checks, we obtain similar results if we expand the sample for event 1 to go down to 0.25 trillion won or narrow it to go up only to 4 trillion won. In an unreported “horserace” regression with separate chaebol
and large-plus (assets greater than 1 trillion won) dummies, similar to Table 4, Panel A, regression (2), the coefficient on chaebol dummy is positive and significant (0.0382, t = 2.65); while the coefficient on large-plus dummy is small and insignificant (-0.0028, t = 0.16). We further confirm that investors saw event 1 as about
event 1) or large-plus firm dummy (for other events) is greater than ±1.96. These returns likely
reflect firm-specific events rather than governance rules.
Our second event study approach uses a standard event study of abnormal returns over
each event period (Brown and Warner, 1985; MacKinlay, 1997). For each firm, we compute
cumulative abnormal returns (CARs) based on the market model, using the Mid-sized index as
the market index. We estimate the market model during January–May and September–December,
1999. We exclude the June–August 1999 event period.
4.2. Graphical overview of event study results
Figure 2 provides a graphical overview of returns to an equally weighted index of
large-plus versus a similar index of mid-sized firms during 1999. Each index is set to 100 at year-end
1998. The two indices move together through 1998 and the first five months of 1999. They
diverge, beginning in June, around the time of event 1, and remain separated thereafter. This is
consistent with our story: Large-plus firms gain relative to mid-sized firms when they should, if
governance changes are driving share price changes. The divergence is not related to overall
market movements. There is little divergence in late 1998 and early 1999, when prices rise
strongly. The divergence appears instead during a period when an equally weighted index of all
firms' share prices (dominated by smaller firms) is slightly declining.
Figure 3 narrows the time period and shows the cumulative difference between the
large-plus and mid-sized indices from April 30, 1999 (roughly one month before event 1) to the end of
1999. Each index is renormalized to 100 at April 30, 1999. There is an overall rise, consistent
with gradual release of information, or gradual investor assessment of the implications of the
no significant trend thereafter. If one focuses more narrowly on the event dates, which are
shown with vertical lines in the figure, there is a rise prior to event 1, consistent with potential
leakage of information (though we interpret event 1 as being about chaebol firms, rather than
large-plus firms as such), and a rise around events 2 and 3.
4.3. CMAR regression results
Table 4, Panel A reports regression results for market-adjusted returns. We report results
for a (-2,+3) window around each event, and also for two long windows, one window covering
the period from day -2 preceding event 2 through day +3 for event 3, and one which goes from
day -2 preceding event 1 through day +3 for event 3.13 Regression sets (1)–(3) use our “main”
treatment group (assets from 1-4 trillion won). In regression set (1), the short window returns
for each event are positive, economically meaningful, and statistically significant, for chaebol
firms relative to non-chaebol firms for event 1, and for large-plus firms relative to mid-sized
firms for events 2 and 3 and the long windows. The cumulative return over events 2–3 is 13.69%
(t = 3.16). These results are consistent with investors reacting positively to the large-firm rules.
A central issue for this paper is whether we are observing a size-based effect, which is
correlated with but unrelated to the regulatory threshold. We address this question in several
ways. First, the narrower the event window, the less likely is this alternate explanation. Yet
we obtain positive returns over narrow event windows around all three events. Second, we
search for and do not find news announcements during the event period, or during the rest of
1999, suggesting that economic times are unusually good for large firms or chaebol firms.
13
Third, in regression set (2) we control for a smooth parametric effect of firm size on
Tobin’s q, by adding ln(market capitalization) as a control variable. For the size-based events,
the returns to large-plus firms are somewhat larger with this control; t-statistics also increase
despite some loss of statistical power due to the 0.48 correlation between large-plus dummy and
ln(market cap). In regression set (3), we address the possibility that the relation between event
period returns and firm size might not be captured by a simple ln(market cap) specification, by
including the first six powers of ln(market cap) as additional independent variables, to provide a
flexible form for this relation.14 Large-plus dummy remains positive and significant for the
size-based events, and t-statistics again increase for the size-based windows. For the events 2–3
long window, the estimated gain for large-plus firms is 15.8% (t = 3.34) with the full six-powers
control. Here and in later tables, we obtain similar results in robustness checks with other
polynomial forms for our firm size control.
Fourth, in regression set (4), we obtain similar results for size-based events (events 2 and
3 and long windows including these events) with the “narrow” treatment group, limited to assets
from 1–1.5 trillion won. Set (4) is otherwise similar to set (2), and controls for ln(market cap).
For event 3—the first time the government specified the size threshold at 1 trillion won—share
prices for large-plus firms jump by 6.4% (t = 4.64), relative to mid-sized firms. Large-plus
dummy is also economically large and statistically significant for longer windows including
event3. For event 2, the return to large-plus firms is positive but not significant; insignificance
is not surprising since the treatment group includes only 18 firms and this announcement did not
specify a size threshold. The coefficient for event 2 becomes significant (coefficient = 4.1%, t
= 2.09) if we expand the treatment group to cover firms with assets from 1–2 trillion won (n =
14
31).
The coefficients in regression sets (2) and (4) for windows including event 3 are virtually
the same. The t-statistics are lower for the narrower group, as expected due to the smaller
number of treatment group firms. Thus, the jump at the threshold remains roughly constant as
one approaches the discontinuity. This supports a causal interpretation (Imbens and Lemieux,
2008).15
The final regression in each set is a “horserace” regression with two treatment groups:
chaebol firms and large-plus, non-chaebol firms; the control group is mid-sized non-chaebol
firms. This tests our interpretation of event 2 and 3 as being principally about large firm reform,
rather than chaebol reform. Chaebol dummy is positive but insignificant in all sets; large-plus
dummy is similar in size to the event 2-3 regression without chaebol dummy, and is significant
with a firm size control (sets (2)-(4)) and marginally significant without this control. For the
narrow treatment group, large-plus dummy takes a 0.18 coefficient (t = 2.32), while chaebol
dummy takes a small .01. This is consistent with our interpretation of events 2 and 3.
In Figure 4, we return to graphical depiction. The left-hand figure shows a scatter plot
of CMARs over the events 1-3 window, for firms with assets from 0.5–4 trillion won, a vertical
line at 1 trillion won, and horizontal lines on either side of the vertical line. The line to the left
of the vertical line shows mean returns to control firms (= 0 by definition). The longer line on
the right shows the mean return to the main treatment group; the shorter line shows the mean
return for the narrow treatment group. The right-hand figure is similar, for a window covering
events 2–3. Each figure shows an economically and statistically significant jump for the main
15
treatment group at the threshold (equivalent to Table 4, Panel A, regression set (1)), and a similar,
marginally significant jump for the narrow treatment group. The jump for the narrow group
becomes significant if we control for ln(market cap) or use CARs instead of CMARs.
4.4. CAR (event study) results
In Table 4, Panel B, we switch to a classic event study methodology, and do not exclude
outliers. The index is non-chaebol firms for event 1 and mid-sized firms for other events. We
report results based on two sets of firm groupings: First, we use industry portfolios. This
allows for cross-sectional correlation within industry, but assumes independence across
industries (Brown and Warner, 1980, 1985). These results are the most comparable with Panel
A, where we use industry-group clusters to address intra-industry and intra-group correlations.
The CAR results are consistent with the CMAR results. Using the main treatment group, the
CAR for combined event 2–3 CAR is 14.3% (z = 4.78). For individual events, the CARs are
positive and significant for events 1 and 2, and become so for event 3 if we exclude the outliers
from the CMAR analysis, or include firms with assets from 0.25–0.5 trillion won in the control
group. In regression set 3, which uses the narrow treatment group, the results are significant for
all windows.
A further response to the risk of cross-sectional correlation in returns is to combine all
treatment group firms into a single, equally weighted portfolio. This fully controls for
cross-sectional dependence at the cost of lower statistical power. We implement this approach in the
second set of results in Panel B. The z-statistics generally weaken, as expected, but remain
reasonably strong. All events that were significant with industry portfolios remain significant,
event 3 increases to 3.7% and is marginally significant (z = 1.69).16
We apply a battery of robustness checks to our results, in addition to those described
above. We obtain similar results if we: (i) use log returns instead of fractional returns, (ii) use
"jump" (buy-and-hold) returns for the entire window instead of summing daily returns; (iii) vary
the estimation period for the CAR results;17 (iv) do not exclude outliers in the CMAR results,
exclude them for the CAR results, or winsorize returns at 1%/99% instead of excluding outliers;
and (viii) add the firm-level control variables used in Table 7 (other than ln(assets), which we
omit since we control for ln(market cap)). As is expected when returns are positive over a
period of time, the long-window buy-and-hold returns exceed the CMAR or CAR returns. For
example, in the buy-and-hold equivalent of Panel A, regression set 2, the predicted return to
large-plus firms over the event 2–3 window is 0.1547% (t = 2.79).
4.5. Comparison to other East Asian countries
If June-August 1999 was a good period for large Korean firms, for reasons unrelated to
governance, it may have been good for large firms in similar countries. We therefore study the
returns to large firms in six other East Asian countries: Hong Kong, Indonesia, Malaysia,
Singapore, Taiwan, and Thailand. We conduct an event study of the daily returns to large
public firms in these six countries over 1999 (n = 428), using different size thresholds, including
the large plus threshold (local currency equivalent of 1 trillion won) and the large-firm threshold
16
In unreported regressions, firm-level CARs are similar to the industry results; the t-statistics are larger, as expected. On the choice between industry portfolios and a single treatment group portfolio, industry portfolios are often a reasonable compromise between test power and the potential for cross-sectional correlation to produce biased standard errors. Brown and Warner (1985, p. 22) suggest that there can be "gains from procedures assuming independence [across industries] . . . even when . . . all [firms] have the same event date." Bernard (1987, p. 11 and Table 1) concurs with Brown and Warner that intraindustry correlation can be important but finds that "interindustry cross-sectional correlation is small relative to intraindustry correlation."
17
(2 trillion won), relative to an index of mid-sized firms (0.25–1 trillion won). There is no
evidence of positive returns to large firms. Figure 5 shows results for a pooled sample of all six
countries, for large-plus relative to mid-sized firms. The two groups move together. In a
pooled regression similar to Table 4, regression set (1), the returns to large-plus firms over the
long window covering events 1–3 is close to zero (coefficient = 0.0051; t = 0.24).18
We obtain similar non-results for individual countries. In regressions similar to Table 4,
Panel A, regression set (1), the returns to large-plus firms over the events 1–3 window are
insignificant for four countries, positive for Taiwan, and negative for Indonesia. Over the
events 2–3 window, the returns are insignificant for four countries, positive for Singapore, and
negative for Thailand. For none of the countries are the returns significant for both of these
windows. The positive returns for Taiwan over the 1–3 window and for Singapore over the 2–3
window change sign and become insignificant if we control for ln(market cap), similar to
regression set (2). Thus, there is no evidence of gains for large firms relative to mid-sized firms
in these other countries, and no evidence of a break in returns around the large-plus threshold.
5. Difference-in-differences analysis
Difference-in-differences analysis offers an alternative way to assess whether the
governance reforms predict a value increase for large firms, at the right time (when the reforms
are adopted). If investors assign higher value to firms with 50% outside directors and an audit
committee, then the Tobin's q's of large firms should rise, relative to mid-sized firms, between
May 1999 (just before the legislative reforms began) and the end of 1999, when the legal rules
requiring these governance elements are adopted, controlling for other factors that affect Tobin's
18
q. One has no reason to expect similar relative gains for large firms at other times. DiD
analysis, extended for a period after the reforms take effect, can also let us assess whether
investors’ initial views persist or fade, once they see the reforms’ actual results.
5.1. DiD methodology
We again exclude small firms from the sample. Our control group is mid-sized firms
with assets from 0.5–2 trillion won at May 1999 (t = 0). We use large firms with assets from 2–
8 trillion won at year-end 1999 (n = 39) as the main treatment group, and large firms with assets
from 2–4 trillion won (n = 19) as the narrow treatment group.19 We compute Tobin's q at
six-month intervals from June 30, 1996, through Dec. 31, 2004, except that June 30, 1999 lies in the
middle of the legal reform period, so we move the measurement date back to May 31, 1999,
which precedes the reforms.20 We use Tobin's q as our principal measure of firm value, but
obtain similar results for market/book.
We take logs of Tobin's q (or market/book) to address skewness in non-logged values.
We also drop outliers for each year if a studentized residual, obtained from a regression of
ln(Tobin’s q) (or ln(market/book)) on large-firm dummy is greater than ±1.96.21 Equation (2)
provides our main DiD specification. All regressions use robust standard errors.
19
We exclude from the treatment group one firm that alre ady had 50% outside directors at May 1999. In robustness checks, we obtain similar results if we drop firms from the control group if they voluntarily adopt 50% outside directors. The logic behind this specification is as follows. We find evidence below that small firms who voluntarily adopt the reforms experience similar price increases to large firms; thus, including the voluntary adopters in the control group could bias against finding an effect of the reforms.
20
We use six-month periods because we have financial data available every six months. In robustness checks, we obtain similar results if we measure firm size at year-end 1998 or year-end 1999. To measure firm size, Tobin’s q, and market/book at May 31, 1999, we interpolate between December 1998 and June 1999.
21
-0 , 0 , , , 0 ,
[ln(Tobin's ) ]i i ln( )i t j i j i
j
q L assets X
(2)Here τ is a date from June 1996 through Dec. 1994 (other than the base date of May 1999), the
dependent variable is the change in ln(Tobin’s q) from time 0 to time τ; Li is a large-firm dummy
variable (= 1 if firm i is large at both date 0 and date τ, 0 otherwise); and X is a vector of control
variables. Since we difference our dependent variable, we also difference the control variables.
The exception is ln(assets), which captures a potential direct influence of firm size on the change
in Tobin’s q, which might otherwise be captured by large-firm dummy.
For each date τ, the constant ατ gives the predicted change in ln(Tobin’s q) for mid-sized
firms from date 0 to τ. The coefficient of interest is λτ, which gives the predicted additional
change in ln(Tobin’s q) over this period for large firms. If the governance reforms positively
affected Tobin's q, these coefficients should be positive beginning in December 1999, but
insignificant before that. Also, if large firms and small firms otherwise generally move together,
there should not be large jumps in λτ between adjacent time periods, except at December 1999.
5.2. DiD main results
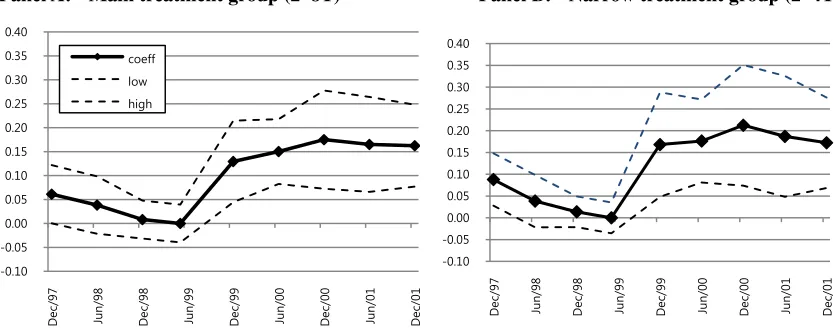
We begin in Figure 6 with a graphical presentation. Figure 6A shows, for the main
treatment group, the λτ coefficients from a simple regression of Δ(ln(Tobin’s q)) on a constant
term and large-firm dummy, for December 1997 through December 2001, together with dotted
lines showing 5%–95% confidence bounds around these point estimates. The estimates are
small and insignificant prior to May 1999, zero by construction for May 1999, jump in
December 1999, and remain positive, statistically significant, and roughly flat thereafter. An
extended graph covering the full period from June 1996 through December 2004 would be
Tobin's q (0.97) and leverage (0.68), this increase in ln(Tobin's q) implies a 46% increase in
share price.22 These results are consistent with investors revaluing large firms relative to
mid-sized firms at the time of the reforms, and not at other times. The lack of significant movement
after 1999 is consistent with investors retaining their initial beliefs about the value of the
governance reforms, and not making large reassessments of their value, in either direction.23
Figure 6B uses the narrow treatment group (2–4 trillion won). Standard errors increase,
as expected due to smaller sample size. The point estimate for December 1999 increases to
0.168 (t = 2.31). Overall, point estimates are similar for both treatment groups. These figures
visually support the view that something happened to large firms during the treatment window of
May-December 1999. Changes in Tobin’s q for large and mid-sized firms are similar at other
times.
In Table 5, we turn to regression analysis and focus on the core treatment period from
May to December 1999. Panel A shows results for Tobin’s q. Odd- (even)-numbered
regressions use the main (narrow) treatment group. Regression (1) is equivalent to the
December 1999 estimate in Figure 6A. Regression (2) is similar to regression (1), but uses the
narrow treatment group. The coefficient on large-firm dummy is 0.13 (0.17) for the main
(narrow) treatment group and is significant for both groups.
22
Tobin’s q = (debt/assets) + (market value of equity/assets). A shock to share price affects only the second term: Let T be the fractional increase in Tobin's q and S be the fractional share price increase. S = [New (market equity/assets)]/[Old (market equity/assets)] – 1 = [New q – (debt/assets)]/[Old q – (debt /assets)] – 1 = [(Old
q)*(1+T) – (debt/assets)]/[Old q – (debt /assets)] – 1. This equation can be solved for S if we know debt/assets, old
q, and the fractional change T. 23
In regressions (3)–(6), we implement the regression discontinuity approach, by adding
ln(assets) as a control variable.24 In regressions (3)–(4), we control for ln(assets). This has
only a minor effect on the coefficient on large-firm dummy. This coefficient is about 0.15 and
marginally significant for both groups. The lower significance level likely reflects colinearity
between large-firm dummy and ln(assets); the Pearson correlation coefficient is 0.76 (0.84) for
the main (narrow) treatment group (see last row of Panel A). In regressions (5)–(6), we address
this colinearity issue by expanding the control group to include all small firms. The correlation
coefficient drops, as expected, and large-firm dummy is again statistically significant.
In regressions (7)–(8), we again limit the control group to mid-sized firms (0.5–2 trillion
won), and add controls for first differences in the first six powers of ln(assets). The coefficient
on large-firm dummy rises to 0.17 (0.18) for the main (narrow) treatment group. the t-statistics
drop, similar to regressions (3)–(4); we retain marginal significance for the narrow treatment
group and barely lose it for the main treatment group. Finally, in regressions (9)–(10), we add a
battery of first differences in control variables, and also expand the control group slightly to
extend down to 0.25 trillion won. The coefficients on large-firm dummy are 0.12 (0.17) for the
main (narrow) treatment group and are statistically significant.25 In robustness checks, we vary
control variables, treatment group range, and control group range. The coefficients on
large-firm dummy are consistently within the 0.12–0.19 range shown in Panel A. They are also
usually, as in Panel A, somewhat larger if we use the narrow treatment group or more extensive
24
In our event study, we used ln(market cap) as a size measure. In the DiD analysis, we use Tobin's q as dependent variable and ln(assets) as the size control. We need a different size control, because Tobin's q is a scaled version of market capitalization. In robustness checks, we obtain similar results with ln(sales) as a size measure. We measure ln(assets) at May 1999. We have semiannual data for assets, and interpolate between December 1998 and June 1999 to estimate ln(assets) at May 1999.
25
controls; are statistically significant except when we use both extensive controls and a narrow
control group; and are marginally significant, or nearly so, throughout.26
In Panel B, we use market/book as a dependent variable, with consistent results.
Ln(Market/book) is economically large in all regressions, with both the main and narrow
treatment groups. It is significant or marginally significant in all regressions except regressions
(9)–(10), where we use a limited control group, thus creating strong colinearity between
large-firm dummy and ln(assets), and extensive controls. We can recover significance in these
regressions by using a broader group of control firms.
In both panels, the coefficient on ln(assets) is small, always insignificant, and of varying
sign. Thus, there is no evidence of a smooth size effect on firm market value, separate from the
discontinuous effect at the treatment threshold.
The treatment time period in our DiD analysis is common to all large firms, which could
lead to cross-sectional correlation in the treatment effects. Thus, customary DiD standard errors
could be biased downward. In the event study, we addressed cross-sectional correlation by
studying returns to a portfolio of all large firms. For the DiD analysis, we use a bootstrap
approach. We compute the coefficient on large-firm dummy for all seven-month periods
between June 1996 to December 2004, excluding the treatment period (May-December 1999).
This provides 81 DiDcoefficients for partly overlapping periods. For the main treatment group,
none equal or exceed the 0.130 coefficient in Table 5, regression (1); the largest is 0.107. For
the narrow treatment group, the largest bootstrap coefficient is 0.102, well below the 0.168
26
coefficient in Table 5, regression (2).27
The DiD results are consistent with the event study. Large firms gain, relative to small
firms, when the legal changes are adopted. They do not gain or lose relative to small firms at
other times. The regression discontinuity approach provides evidence that we are not simply
capturing a size effect which coincides with but is unrelated to the governance reforms. The
gain to large firms remains stable, and perhaps even grows, as we shrink the size band for the
treatment group.
5.3. DiD for other East Asian countries
As a further check on whether our results are likely to be causal, we assess in Table 6
whether large firms gained relative to mid-sized firms in other East Asian countries during
May-December 1999. If regional factors (such as recovery from the crisis, or exports to China)
disproportionately benefited large firms, this might be reflected in these other countries. This
check is similar in spirit to a triple-difference analysis; the third difference is Korea versus
comparable countries.
Table 6, Panel A presents simple results, with Δ[ln(Tobin’s q)] as dependent variable, and
constant term and large-firm dummy (local currency equivalent of 2 trillion won) as independent
variables. The control group is mid-sized firms with assets at year-end 1998 of 0.5–2 trillion
won; the treatment group is large firms with assets from 2–8 trillion won. The first three
columns present separate results for Hong Kong, Singapore, and Taiwan. Column (4) presents
pooled results for Indonesia, Malaysia, and Thailand. These countries are the most similar to
Korea in the intensity of the East Asian crisis, but have too few large firms to make
27
country regressions meaningful. Column (5) pools all six countries. Regressions that cover
more than one country include country dummies.
There is no evidence of positive returns to large firms, relative to mid-sized firms. The
coefficients on large-firm dummy are small, more often negative than positive, and negative and
marginally significant in the pooled regression (5). If we expand the control group down to
0.25 trillion won, and expand the treatment group to include all firms over 2 trillion won, to
increase the chance that we would find relative gains to large firms if they exist, the coefficient
for Hong Kong becomes significant and negative [-0.0191 (t = 2.38)], as does the pooled
coefficient [-0.0117 (t = 2.13)].
In Table 6, Panel B, we assess whether there is any evidence of relative gains for larger
firms, by replacing large-firm dummy with ln(assets). The coefficients on ln(assets) are
insignificant and of mixed sign. If we expand the sample size range to 0.25 trillion and up, the
coefficients on ln(assets) are negative for all countries and significant for Hong Kong and for all
six countries together. Thus, the multicountry DiD results, like the event study results above,
show no evidence of gains to large firms in other East Asian countries during our event period.
5.4. Post-reform trends in profitability and growth
As a further plausibility check on the governance explanation for our results, we assess
whether large-firm profitability or growth changed after the reforms, relative to mid-sized firms.
The governance rules adopted in 1999 came into force partly in 2000, and fully only with spring
2001 annual shareholder meetings. Also, a change in board structure is likely to affect firm
behavior with a lag of uncertain duration. Thus, if governance affects large firms’ performance,
improved in the second half of 1999, relative to mid-sized firms, for reasons unrelated to
governance, performance measures might show different trends for the two groups during
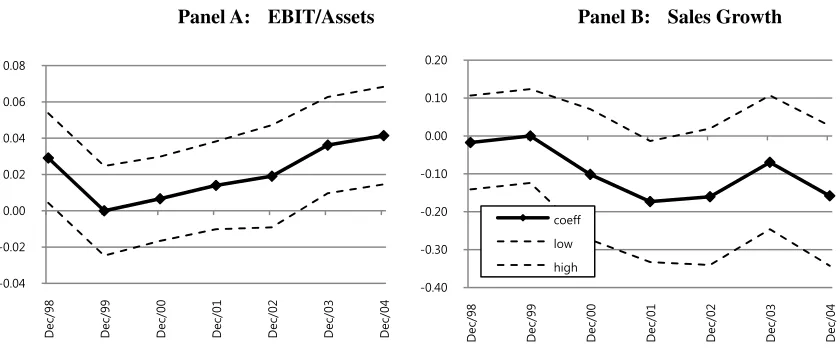
1999-2000, which is too early for the changes to be explained by governance. Figure 7, Panel A
shows profitability trends for large firms, relative to mid-sized firms. Panel B shows sales
growth trends. The DiDspecification is similar to that for Figure 6, with different dependent
variables and annual instead of semiannual data.
The relative profitability of large firms, measured as earnings before interest and taxes
(EBIT)/assets, drops in 1999, and then gradually returns to its 1998 level by 2002. The further
rise in 2003, to above the 2002 level, could plausibly be partly because of the governance
reforms. Sales growth is flat in 1999, and then drops beginning in 2000. For both variables,
the lack of a favorable trend in 1999 or soon thereafter is consistent with a governance rather
than a performance explanation for the 1999 rise in large firms’ share prices. In unreported
regressions, we also find no evidence of a change in dividends, capital expenditures, or other
measures of firm-level outcomes, which occurs during or soon after the 1999 share price rise, yet
too soon for the reforms to contribute to a change in firm-level outcomes.
6. Firm fixed effects and random effects regressions
We next examine the reaction of both large and small firms to governance reforms, using
a firm fixed effects framework. This analysis has three main goals. First, the inference that
investors assigned value to mandatory board reforms for large firms will be stronger if investors
assign similar value to voluntary changes at smaller firms. Conversely, the large-firm results
will be less convincing if voluntary adopters see no share price reaction. Since small-firm
these firms. Thus, the small-firm results are a robustness check on the large-firm results, and do
not provide a separate basis for causal inference.
Second, the firm fixed effects regressions let us estimate how much of the value increase
is due to each of the three requirements: 50% outside directors; audit committees; and outside
director nominating committees. Small firms can choose which of these measures to adopt, and
can adopt different measures at different times. We use this variation to estimate the separate
association between each reform and Tobin’s q. The fixed effects regressions also let us assess
board structure elements which are not legally required—more than 50% independent directors
or a compensation committee.
Third, these results provide evidence on the within-firm, across-time association between
governance and firm market value for smaller Korean firms.28
6.1. Methodology
Although we lack an identification strategy for small firms, we have several reasons to
believe that endogeneity concerns for these firms are likely to be limited. First, we use firm
fixed effects to control for time-invariant firm characteristics, year dummies to control for time
trends, and extensive control variables to control for time-varying firm characteristics. Table 3
defines our control variables. Second, we find in separate work (Black, Jang, and Kim, 2006b)
that firm characteristics only weakly predict small firms’ governance choices. Third, in
unreported results, we assess the extent of endogeneity using three-stage least squares (3SLS)
regressions, and find only mild evidence that Tobin’s q predicts governance. Our 3SLS
28
specification is discussed in section 7.
A separate concern is that different aspects of governance often correlate with each other.
For example, firms that change board structure may also change board procedures; firms with
independent boards may have better disclosure practices; and so on. This could introduce
omitted variable bias if one studies board structure without controlling for other aspects of
governance. To address this risk, in regressions with Board Structure Index as an independent
variable of interest, we control for (KCGI - Board Structure) or sometimes separately for
Ownership Parity and (KCGI - Board Structure - Ownership Parity). In regressions with Board
Independence Subindex as the independent variable of interest, we control for (KCGI - Board
Independence) and so on.29
In Korea, outside directors were rare prior to the East Asian financial crisis, but firms
rapidly adopted them thereafter, partly due to the legal rules discussed above, but also voluntarily.
Audit committees were not permitted prior to the crisis, but once they were authorized, a
significant number of small firms adopted them. By the end of our sample period, 44 small
firms (10% of our sample) had voluntarily adopted 50% outside directors, 59 firms (9% of our
sample) had more than 50% outside directors, 67 small firms (15% of our sample) had
voluntarily adopted audit committees, and 90 small firms (21% of our sample) had voluntarily
adopted an outside director nominating committee. These changes provide enough time variation
to make a firm fixed effects specification feasible.
6.2. Results for board structure
29
In Table 7, we report OLS, firm random effects, and firm fixed effects (with an
unbalanced panel) regressions; results are similar in all cases. All regressions use year
dummies, robust standard errors, and firm clusters.30 Regressions (1)–(3) show full sample
results. Regression (4) reports fixed effects results for small firms. The coefficient on Board
Structure Index is economically and statistically significant, and is similar for all firms and for
only small firms. The predicted increase in Tobin’s q for a small firm that adopts the three
large-firm reforms is 0.0088 * 12-point increase in Board Structure Index = 10.6%, which is
comparable to the large firm increase shown in the DiD results in Section 5. This is consistent
with governance driving the large-firm results, rather than an omitted factor associated with firm
size.31
6.3. Results for components of board structure
In Table 8, we examine the components of Board Structure Index. We show firm
random effects and firm fixed effects results.32 In Panel A, we use Board Independence and
Board Committee Subindices as separate independent variables. Each is significant for the full
sample.
30
We obtain similar fixed effects results with a balanced panel, and similar results with ln(market/book) as dependent variable. With regard to regression method, a Breusch-Pagan test strongly rejects pooled OLS compared to firm random effects. The choice between random and fixed effects is closer. A Hausman test usually, but not always, finds a significant difference in coefficients. For Table 7, regression (2), the λ coefficient, which expresses whether random effects is closer to OLS (λ=0) or fixed effects (λ=1) (see Wooldridge, 2008, chapter 14.2) is 0.71, indicating similarity to fixed effects. Thus, any bias in random effects coefficients is likely to be limited.
31
Commenters suggested the following story for our large-firm results: The 1999 reforms signaled that the government would monitor and regulate large firms; the price rise is due to the signal, rather than the specific reforms adopted in 1999. In DiD terminology, the treatment applied to large firms was board structure reform plus other unspecified government oversight, and we cannot untangle the effects of each. If this story is right, and board structure reforms do not explain our large-firm results, we might expect to find no or smaller effects for smaller firms which voluntarily change board structure, because there is no reason for these firms to face increased government oversight. We instead find similar value increases for large and small firms. This provides evidence that investors expecting other unspecified government oversight of large firms does not drive our large-firm results. 32
The next two panels in Table 8 break down each subindex into its individual elements. In
Panel B, the components of Board Independence—element b1 (50% outside directors) and
element b2 (> 50% outside directors)—are separately positive and significant. Getting to 50%
outside directors predicts 8% higher Tobin's q, while going beyond 50% predicts an additional 6%
increase. In Panel C, we study the components of Board Committee Index. Audit committee
is significant and predicts a 4% increase in Tobin's q, director nominating committee is
marginally significant, and compensation committee is positive but insignificant.33
In each panel, regression (3) is limited to small firms. The board independence results
are similar to those for all firms. The board committee results for small firms are weaker and
are not statistically significant, but are not statistically distinguishable from the large-firm results.
In sum, we find for small firms strong evidence that 50% outside directors predicts higher
market value; reasonably strong evidence that having more than 50% outside directors also does
so; and some evidence that having an audit committee separately predicts higher market value.
This evidence is consistent with the investment strategy of the Korea Corporate Governance
Fund, managed by Lazard Asset Management. This fund invests in small firms, pressures them
to add outside directors and an audit committee, and sells after the reforms are adopted.34
33
In robustness checks with ln(market/book) as dependent variable, Board Independence Subindex remains significant. Board Committee Subindex as a whole is positive but insignificant; audit committee (in Panel C) is marginally significant. We also study various subsamples: (i) financial vs. non-financial firms (our sample already excludes banks), (ii) chaebol firms vs. non-chaebol firms, and (iii) manufacturing vs. non-manufacturing firms. Board Structure Index, Board Independence Subindex, and 50% outside directors are positive and significant across all subsamples.
34
7. Instrumental variable analysis
Our final methodological approach is instrumental variable analysis. Our instrument for
board structure is "large-firm IV," defined to equal large-firm dummy during 1999-2004, but zero
in 1998 regardless of firm size.35 We place the IV analysis last not because it is least important,
but because it is least new, for two reasons. First, BJK relies on a similar analysis using this
instrument, with cross-sectional data from 2001, Second, the mathematical structure of
two-stage least squares (2SLS) analysis is closely similar to a DiD analysis in which we use the full
post-reform period to estimate the impact of the reforms (rather than the period-by-period
approach we adopt in Part 5).36 The IV analysis can be seen as providing a robustness check on
the DiD results.
7.1. IV validity
A valid instrument must be exogenous, correlated with the instrumented variable (Board
Structure Index), and should predict the dependent variable (ln(Tobin's q) only indirectly and
only through the instrumented variable, and not directly. We address each requirement in turn.
7.1.1. Exogeneity
Large-firm IV is likely to be exogenous. The large firm rules do not correspond to
voluntary firm behavior prior to the 1999 adoption of the rules. At year-end 1998, only one of
the 51 large firms in our sample with available data had 50% outside directors; none had an audit
committee or an outside director nominating committee. There is no evidence that firms reduce
35
We confirm in unreported regressions that large-firm dummy predicts Tobin's q beginning at year-end 1999, but not before. We thank Oghuzan Ozbas for suggesting this form for our instrumental variable.
36
or limit their size to avoid compliance with the rules. We have heard no anecdotal evidence of
this, there is no clustering of firms at a size just below the regulatory threshold, and of the four
firms which become subject to the rules but later drop below the threshold, three retain 50%
outside directors and all retain an audit committee.37
7.1.2. Correlation between instrument and instrumented variable
Large-firm IV correlates strongly with Board Structure Index. The overall correlation
over 2000–2004 is r= 0.69; annual correlations are at least 0.70 in each year during this period.38
7.1.3. Direct or indirect prediction of Tobin’s q?
The harder questions for instrument validity are first, whether large-firm IV predicts
Tobin's q directly or only indirectly; and second, whether indirect prediction is only through
Board Structure Index, or also partly through the rest of KCGI.
With regard to direct prediction of Tobin's q: First, in all regressions, we control for the
continuous effect of ln(assets) on Tobin's q. Second, the coefficient on ln(assets) is negative and
significant, both for all firms and for subsamples of large and small firms. This implies that
larger firms are worse at turning asset dollars into market value dollars. Yet large-firm IV is
large and positive. It would be a remarkable coincidence for the ability of firms to turn assets
37
We examine the shrinkers individually and confirm that three of the four shrinkers suffer business reversals. The fourth conducts a spinoff, but this firm retains the large firm governance elements and promptly grows to become large again; thus the spinoff could not have been intended to avoid the governance rules. There are also three firms which shrink from large to small during the period of adoption of the reforms (June-December, 1999). Two later become large again; the third continues to shrink.
38