© 2017, IRJET | Impact Factor value: 6.171 | ISO 9001:2008 Certified Journal
| Page 180
Optimization of Process Parameters for CNC Turning using Taguchi
Methods for EN8 Alloy Steel with Coated/Uncoated Tool Inserts
Rahul R. Deshpande
1, Reena Pant
21
P.G. Student, Department of Mechanical Engineering,
2Bharti Vidyapeeth College of Engineering,
Kharghar ,Navi Mumbai, Maharashtra, India.
2
Associate Professor in Mechanical Engineering Department,
2Bharti Vidyapeeth College of Engineering,
Kharghar ,Navi Mumbai, Maharashtra, India.
---***---Abstract—Coated and uncoated tool inserts offers certaindegrees of control on desired rate of Tool Wear and surface roughness to an extent. Significant input parameters are selected in order to get influence on the response variables. Experiments were conducted on specimens of EN8 alloy steel material with the help of PVD coated TiALN insert and uncoated carbide insert. The experimental analysis is based on Taguchi method. Taguchi method has become increasingly popular in recent years. It involves both experimental design and analysis aspects. Taguchi methods employ special fractional experiment design called orthogonal array. Notation of orthogonal array is La where “ L” is symbol for orthogonal array, “a” stands for the number of experiments required for this array. Taguchi methods (For the data analysis, Statistical Techniques of ANOVA was used) are performed find out significant parameters. Optimization of process parameters is carried out by Grey Relational Analysis method. GRA method is powerful and most versatile tool which can manipulate the input data as per requirement and comes with results that can be used to have best multi performance in response concerns.
Keywords—Coated and uncoated tool inserts, Surface roughness, Material removal rate, ANOVA, Grey relational analysis.
1.
INTRODUCTION
Optimization is one of the effective techniques used in manufacturing sectors to arrive at the best manufacturing conditions, which is an essential need for industries towards manufacturing of quality products at lower cost .
The Taguchi method involves reducing the variation in a process through robust design of experiments. The overall objective of the method is to produce high quality of product at low cost to the manufacturer. The Taguchi method was developed by Genichi Taguchi. He developed method for designing experiments to investigate how different parameters affect the mean and variance of a process performance characteristic that defines how well the process is functioning. The experimental design proposed by Taguchi involves using orthogonal arrays to
organize the parameters affecting the process and the levels at which they should be varied.
Surface roughness is an indicator of surface quality and is one of the most specified customer requirements in a machining process. For efficient use of machine tools, optimum cutting parameters (speed, feed, depth of cut) are required. So it is necessary to find a suitable optimization method which can find optimum values of cutting parameters for minimizing surface roughness. In modern industry, the goal is to manufacture low – cost high quality products with maximum productivity in a short time. Turning is the most common method for cutting and especially for the finishing of machined parts. Furthermore, in order to produce with desired quality and maximum productivity of machining, cutting parameters selected properly. In turning process, parameters such as materials, tools geometry and cutting conditions (depth of cut, feed rate, cutting speed) have impact on material removal rate and the machining qualities like surface roughness.
Analysis of variance is a hypothesis – testing technique used to test the equality of two or more population means by examining the variances of samples that are taken . ANOVA allows one to determine whether the differences between the samples are simply due to random error or whether there are systematic treatment effects that causes the mean in one group to differ from the mean in another . ANOVA is based on comparing the variance between the data samples to variation within each particular sample . If the between variation is much larger than the within variation , the means of difference samples will not be equal . If the between and within variation are approximately the same size, then there will be no significant difference between samples means .
© 2017, IRJET | Impact Factor value: 6.171 | ISO 9001:2008 Certified Journal
| Page 181
machining parameters optimization of Inconel 718. Thecombined effects of cutting speed, feed, and depth of cut on the performance measures of surface roughness and flank wear were investigated by the analysis of variance.
Radhakrishnan Ramanujam et al [2] investigation of turning on Aluminium Silicon Carbide particulate metal matrix composite (Al-SiC–MMC) using polycrystalline diamond (PCD) 1600 grade insert. Analysis of variance is used to investigate the machining characteristics of metal matrix composite (A356/10/SiCP). The objective was to establish a correlation between cutting speed, feed and depth of cut to the specific power and surface finish on the work piece. Analysis of Variance is a method of apportioning variability of an output to various inputs. The purpose of the analysis of variance is to investigate which machining parameters significantly affect the performance characteristic.
Chinnasamy Natarajan et al [3] surface roughness is an indicator of surface quality and is one of the most-specified customer requirements in a machining process. For efficient use of machine tools, optimum cutting parameters (speed, feed, and depth of cut) are required. So it is necessary to find a suitable optimization method which can find optimum values of cutting parameters for minimizing surface roughness. In this work, machining process has been carried out on brass C26000 material in dry cutting condition in a CNC turning machine and surface roughness has been measured using surface roughness tester. To predict the surface roughness, an ANN model has been designed through feed-forward back-propagation network using “Matlab” software for the data obtained. Comparison of the experimental data and ANN results show that there is no significant difference and ANN has been used confidently. The results obtained conclude that ANN is reliable and accurate for predicting the values.
S. Rajesh et al [4] presents the findings of an experimental investigation into the effects of cutting speed, feed rate, depth of cut, and nose radius in CNC turning operation performed on red mud-based aluminum metal matrix composites and investigates optimization design of a turning process performed on red mud-based aluminum metal matrix composites. The major performance characteristics selected to evaluate the process are surface roughness, power consumption, and vibration, and the corresponding turning parameters are cutting speed, feed, depth of cut, and nose radius.
Tian-Syung Lan et al [5] surface roughness, tool wear, and material removal rate are major intentions in the modern computer numerical controlled machining industry. Through the machining results of the CNC lathe, it was shows that both tool wear ratio and MRR from our optimum competitive parameters are greatly advanced with a minor decrease in the surface roughness in
comparison to those of benchmark parameters. Surface roughness, tool life, and cutting force are commonly considered as manufacturing goals for turning operations in many of the existing research studies. It is also recognized that lighter cutting force often results in better surface roughness and tool life.
Lakhdar Bouzid et al [6] in modern industry, the goal is to manufacture low-cost, high quality products with maximum productivity in a short time. Turning is the most common method for cutting and especially for the finishing of machined parts. Furthermore, in order to produce with desired quality and maximum productivity of machining, cutting parameters selected properly. In turning process, parameters such as materials, tool’s geometry and cutting conditions (depth of cut, feed rate, cutting speed) have impact on the material removal rate and the machining qualities like the surface roughness. Usually, roughness is taken as a good criterion for a mechanical component performance and to appraise production cost, while material removal rate can be defined as the volume of material removed divided by the machining time. Another way to define MRR is to imagine an "instantaneous" material removal rate as the rate at which the cross-section area of material being removed moves through the workpiece.
P. Jayaraman et al [7] have used grey relational analysis to perform multi-objective optimization of surface roughness, roundness and MRR in turning of AA6063 T6 Aluminium Alloy and determined that cutting speed is the most influencing parameter affecting combined grey relational grade followed by depth of cut and feed rate. A grey relational grade is determined from the grey analysis. Optimum levels of parameters have been identified based on the values of grey relational grade and then the significant contribution of parameters is determined by ANOVA.
Shreemoy Kumar Nayak et al [8] was investigated the influence of different machining parameters such as cutting speed (Vc), feed (f) and depth of cut (t) on different performance measures during dry turning of AISI 304 austenitic stainless steel. ISO P30 grade uncoated cemented carbide inserts was used as a cutting tool for turning. Three important characteristics of machinability such as material removal rate, cutting force (Fc) and surface roughness was measured.
© 2017, IRJET | Impact Factor value: 6.171 | ISO 9001:2008 Certified Journal
| Page 182
S.J. Raykar et al [10] the high-speed turning is emerging asa key manufacturing technology in aerospace industry. High-speed turning is generally performed on the order of five to ten times the conventional cutting speed. It has several advantages such as reduction in cutting forces and temperature, low power consumption, improvement in surface finish, low stress components, burr-free surfaces, better dimensional accuracy, and better part quality.
V. Bushlya et al [11] presents results of superalloy machinability study with uncoated and coated PCBN tools aiming on increased speed and efficiency. Aspects of tool life, tool wear and surface integrity were studied. It was found that protective function of the coating, increasing tool life up to 20%, is limited to low cutting speed range.
Harsh Y Valera et al [12] study of power consumption and roughness characteristics of surface generated in turning operation of EN-31 alloy steel with TiN+Al2O3+TiCN coated tungsten carbide tool under different cutting parameters. The study shows the influences of three cutting parameters like spindle speed, depth of cut and feed rate affecting surface roughness as well as power consumption while turning operation of EN-31 alloy steel. Coating is also used on cutting tools to provide improved lubrication at the tool/chip and tool/work piece interfaces and to reduce friction, and to reduce the temperatures at the cutting edge. During machining, coated carbide tools ensure higher wear resistance, lower heat generation and lower cutting forces, thus enabling them to perform better at higher cutting conditions than their uncoated counterparts.
S. Jadhav et al [13] have used grey relational analysis to perform multi-objective optimization of surface roughness & MRR in turning of EN24 alloy steel with coated /uncoated tool inserts. From , it is concluded that spindle speed & depth of cut are prominent factors which affect the turning of EN24 alloy steel. Optimum level of parameters has been identified based on the values of grey relational grade & then the significant contribution of parameters is determined by ANOVA.
2.
EXPERIMENTAL DETAILS
EN8 is a medium-carbon low-alloy steel and finds its typical applications in the manufacturing of automobile and machine tool parts. Properties of EN8 steel, like low specific heat, and tendency to strain-harden and diffuse between tool and work material, give rise to certain problems in its machining such as large cutting forces, high cutting-tool temperatures, poor surface finish and built-up-edge formation. This material have wide range of applications such as General purpose axles, shafts, gears, bolts and studs, spindles, automotive and general engineering components etc.
[image:3.595.324.551.150.288.2]For experimental study, EN 8 alloy steel material was taken of size 32 mm diameter and 60 mm length work piece as shown in figure 1.
Fig. 1: EN8 workpiece
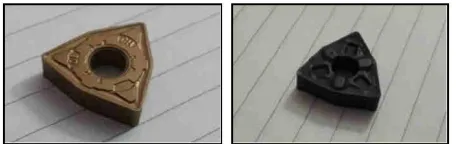
The machining of EN 8 alloy steel was done under dry cutting condition with the help of coated and uncoated inserts. Selection of inserts was done with the help of manufacturing catalogue and finally selected inserts are PVD coated TiAlN insert and uncoated carbide insert for general turning having geometry WNMG 12 04 08 as shown in figure 2.
Fig. 2: PVD coated TiAlN and uncoated carbide insert
Spindle speed, feed and depth of cut are the three cutting parameters taken for consideration for investigating the effect on response variables i.e. surface roughness and material removal rate. Surface roughness was measured with the help of Handysurf E-35 B surface roughness tester and material removal rate calculated by mathematical equation;
MRR = 1000×Vc ×f ×d cut mm3/min
Where, ‘Vc’ is cutting speed in m/min. ‘f ’ is feed rate in mm/rev. and ‘d cut’ depth of cut in mm.
[image:3.595.322.550.399.471.2]© 2017, IRJET | Impact Factor value: 6.171 | ISO 9001:2008 Certified Journal
| Page 183
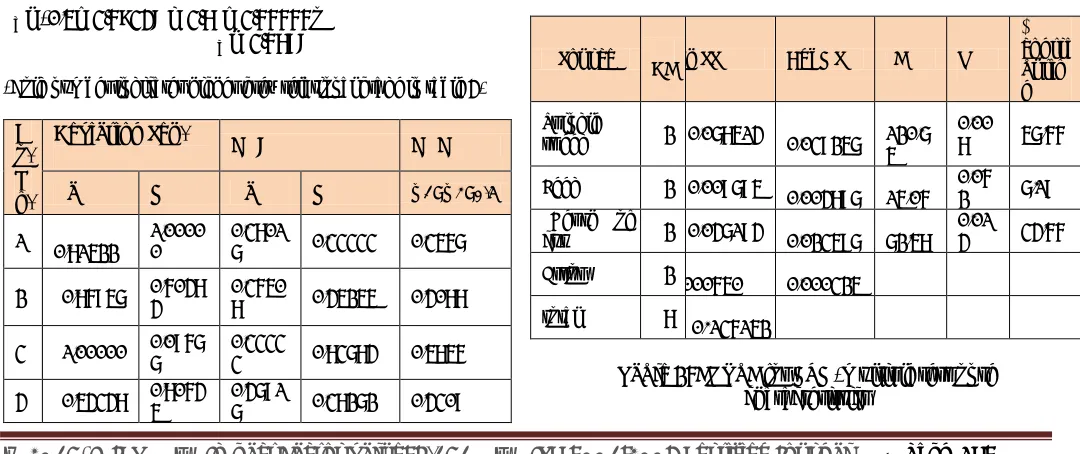
Factors Level 1 Level 2 Level 2Spindle speed (rpm) 1400 1600 1800
Feed (mm/rev.) 0.10 0.15 0.20
[image:4.595.310.564.216.367.2]Depth of cut (mm) 0.8 1.0 1.2
Table 1 – Final Levels
3.
EXPERIMENTAL WORK
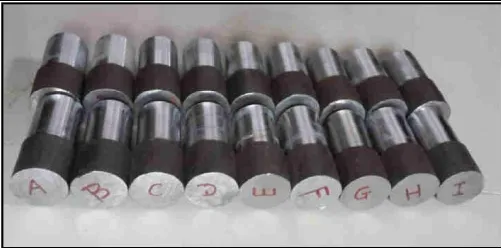
Three factors, three levels and nine experiments are taken in consideration according to Taguchi approach with the help of “MINITAB 17” software. Experimentation is carried out according to the L9 orthogonal array for each insert individually. Precut of 0.5 mm depth of cut was performed before actual trail on each work piece up to the length 35 mm in order to remove the rust layer. Table 2 shows the surface roughness values and material removal rate obtained during experimentation for coated and uncoated inserts. Figure 3 shows the samples after actual experimentation. The samples A, B, C...I stands for the Experiments 1, 2, 3…9 respectively as shown in figure3.
Fig. 3: Turned samples during final experimentation
Ex . No .
N (rpm)
F (m m/r ev.)
dcu t (mm)
Coate d insert
Unco ated Inser
t MRR
Ra Ra
1 1400 0.10 0.8 1.49 1.52 10907.98
2 1400 0.15 1.0 1.54 1.62 20452.46
3 1400 0.20 1.2 1.66 1.73 32723.94
4 1600 0.10 1.0 1.24 1.30 15582.83
5 1600 0.15 1.2 1.12 1.18 28049.09
6 1600 0.20 0.8 1.48 1.57 24932.53
7 1800 0.10 1.2 0.74 0.94 21036.82
8 1800 0.15 0.8 0.96 1.28 21036.82
9 1800 0.20 1.0 1.43 1.66 35061.32
Table.2: Experimental results for Ra and MRR for coated and uncoated inserts
Fig. 4: Graphical representation of surface roughness with coated/uncoated inserts
Figure 4 shows the variation of surface roughness for coated and uncoated insert at different cutting conditions. General tendency is that coated and uncoated insert gives close to similar surface roughness values up to the speed 1600 rpm and after that the difference in surface roughness goes on increasing. Lower value of surface roughness is obtained at experiment no. 7 i.e. for coated insert it is 0.74 and for uncoated insert it is 0.94. Higher value of surface roughness is obtained at experiment no. 3 i.e. for coated insert it is 1.66 and for uncoated insert it is 1.73. At 1800 rpm speed the maximum difference occurred in surface roughness for coated and uncoated insert as shown in figure 4. From experimental study it is conclude that coated insert provides better results at dry cutting condition over the uncoated insert.
4.
MULTI-OBJECTIVE OPTIMIZATION BY GREY
RELATIONAL ANALYSIS (GRA)
[image:4.595.37.288.414.538.2]© 2017, IRJET | Impact Factor value: 6.171 | ISO 9001:2008 Certified Journal
| Page 184
Experimental data will be normalize in the rangebetween zero and one.
Next, the grey relational coefficient is calculate from the normalized experimental data to express the relationship between the ideal (best) and the actual experimental data.
Grey relational grade is then computed by averaging
the weighted grey relational coefficients
corresponding to each performance characteristic.
Statistical analysis of variance is performed for the input parameters with the GRG and the parameters significantly affecting the process are found out.
Optimal levels of process parameters are then choose. A confirmatory test will be done to support the findings and an improvement in grey relational grade [13].
4.1 GRA for coated insert
Step 1: Normalization:
The first step in grey relational analysis is normalization and which is performed to prepare raw data for the analysis where the original sequence is transferred to a comparable sequence. Normalization of response variables is done in the range between zero and one. The indication of better performance in turning process for surface roughness is “Lower the better” whereas it is “Higher the better” for material removal rate. In grey relation analysis, for “Lower is better” response normalizing done by equation (1) and when the response is “Higher the better”,normalizing done by equation (2).
Smaller is better i.e. for surface roughness
( ) ( ) ( )
( ) ( ) ( ) For Expt. 1;
( )
( )
Larger is better i.e. For material removal rate; ( ) ( ) ( )
( ) ( ) ( )
( )
( )
Where ( ) and ( ) are the normalized data and observed data respectively, for ith experiment using kth response. The smallest and largest values of ( )in the kth response are minxi(k) and maxxi (k) respectively. The normalized values are shown in table 3.
Expt.
No. Ra (μm)
MRR (mm3 /min)
Normalized
Ra MRR
1. 1.49 10907.98 0.18478 0.00000 2. 1.54 20452.46 0.13043 0.39516 3. 1.66 32723.94 0.00000 0.90323 4. 1.24 15582.83 0.45652 0.19355 5. 1.12 28049.09 0.58696 0.70968 6. 1.48 24932.53 0.19565 0.58065 7. 0.74 21036.82 1.00000 0.41936 8. 0.96 21036.82 0.76087 0.41936 9. 1.43 35061.32 0.25000 1.00000
Table.3: Comparability sequence after normalization
Step 2: Determination of deviation sequence:
The deviation sequence Δ0i (k) is the absolute difference
between the reference sequence ( ) and the
comparability sequence ( ) after normalization.
Mathematically it is denoted by;
Δ0I (k)=| ( )- ( )|………..(3)
Δ0i(k)=| |
= 0.81522 For MRR;
Δ0i(k)=|
= 1
Step 3: Determination of grey relational coefficient:
The grey relation coefficient ( ) for the kth response
characteristics in the ith experiment can be expressed as; ( ) ( ) ………. (4)
Where ∆min is the smallest value of ∆oi(k) = mini mink|x0*(k)− xi*(k)| and ∆max is the largest value of ∆oi(k) = maxi maxk|x0*(k)− xi*(k)|, x0∗(k) denotes reference sequence and xi∗(k)denotes the comparability sequence and is the distinguishing coefficient. The value of can be adjusted with the systematic actual need and defined in the range between 0 and 1.
For Surface roughness;
( ) ( )
© 2017, IRJET | Impact Factor value: 6.171 | ISO 9001:2008 Certified Journal
| Page 185
Where ( ) ( ) | | and ∆max||x0∗(k) − x∗(k)|| = ||1 − 0|| = 1
Where; ζ = distinguishing coefficient between [0, 1] = (0.5) selected.
( )
( )
For MRR;
( )
( )
Step 4: Determination of grey relational grade:
The overall evaluation of the multi-performance characteristics is based on the grey relational grade and it is defined as an average sum of the grey relational coefficients which is defined as follows;
∑
(
)
……… ( 5 )Where is grey relational grade; n is the number of performance characteristics. Influence of the response variables can be controlled by deciding the optimum machining parameters varying the value of w keeping in mind ∑ should be equal to 1. The GRC and
corresponding GRG for each experiment for turning operation are calculated. The value of GRG is near to the product quality for optimum process parameters.
GRG ( ) for first experiment calculated as:
(0.5 )
(Bold number indicates higher grey relational grade in table 4)
E x. N o.
Deviation Seq. GRC GRG
Ra MRR Ra MRR w1=w2=0.5
1 0.81522 1.00000 0.38017 0.33333 0.3567
2 0.86957 0.60484 0.36508 0.45255 0.4088
3 1.00000 0.09677 0.33333 0.83784 0.5856
4 0.54348 0.80645 0.47917 0.38272 0.4309
5 0.41304 0.29032 0.54762 0.63265 0.5901
6 0.80435 0.41935 0.38333 0.54386 0.4636
7 0.00000 0.58064 1.00000 0.46269 0.7313
8 0.23913 0.58064 0.67647 0.46269 0.5696
9 0.75000 0.00000 0.40000 1.00000 0.7000
Table.4: Deviation sequence, grey relational coefficient and grey relational grades
Average mean of GRG (ᵞm) =Total sum of
grades / 9
= 0.5374
Step 5: Determination of optimal parameters:
The grey relational grade calculated for each sequence (as shown in table 4) is taken as a response for the further analysis. The larger-the better quality characteristic was used for analyzing the GRG, since a larger value indicates the better performance of the process. The response table of Taguchi method is employed here to calculate the average grey relational grade for each factor level (Table 5)
Level Spindle speed Feed Depth of cut
1 0.4504 0.5063 0.4633
2 0.4949 0.5228 0.5132
3 0.6670* 0.5831* 0.6357*
Delta 0.2166 0.0768 0.1724
Rank 1 3 2
[image:6.595.35.575.559.786.2]Table.5: Response table for GRG
Table 6:ANOVA for GRG (multiple response characteristics
Source DF seq SS Adj MS F P
% contri butio n
Spindle
speed 2 0.078514 0.039257 120.7 5
0.00
8 57.66
Feed 2 0.009795 0.004897 15.06 0.062 7.19 Depth of
cut 2 0.047194 0.023597 72.58 0.014 34.66
0.000650 0.000325 total 8
Error 2
© 2017, IRJET | Impact Factor value: 6.171 | ISO 9001:2008 Certified Journal
| Page 186
Fig. 5: Main effects plot for Means for GRGFigure 5 shows the finest combination values for maximizing the multi-objective characteristics or grey relational grade were spindle speed of 1800 rpm, feed rate of 0.2 mm/rev. and depth of cut of 1.2 mm. The response table for the means of grey relational grade is shown in table 5. The ANOVA output of the multi-objective characteristics is given in table 6. From the analysis of this table, it is concluded that spindle speed (57.66 % contribution) followed by feed and depth of cut, is the most significantly affecting the grey relational grade.
Step 6: Confirmatory experiment:
Once the optimum level of machining parameters is selected then the final step is to predict and verify the improvement of the performance characteristics using the optimum level of the machining parameters. The estimated or predicted GRG (ᵞpredicted) at the optimum level of the machining parameter can be calculated by equation (6).
ᵞ
predicted= ᵞ
m+
∑
qi=1ᵞ
i −
ᵞ
m) ………….(6)
Where ᵞm is the total mean of the grey relational grade ᵞi is the mean of GRG at the optimum level of ith parameter, and q is the number of machining parameters that significantly affect GRG. Results are shown in table 7.
From equation (6),
ᵞpredicted= 0.5374 + [(0.6670 ‒ 0.5374) + (0.5831 ‒ 0.5374)+ (0.6357‒ 0.5374)]
= ᵞpredicted = 0.8107
Factors
Optimum
by grey analysis
N
3f
1d
cut3Optimum cutting parameters
Prediction
N
3f
3d
cut3Experiment
N
3f
3d
cut3Ra(µm) 0.74 0.98
MRR(mm3/
min) 21036.82 42072.20
[image:7.595.45.284.102.254.2]GRG 0.7313 0.8107 0.8554
Table.7: Results of confirmation experiment for GRG Improvement in GRG = 0.8554 - 0.7313
=0.1241
%error=100- (Predicted GRG / Experimental GRG) × 100 =100 - (0.8107 / 0.8554) × 100
=5.23 %
4.2 GRA for uncoated insert
Similar procedure carried out for the uncoated insert and it results are shown in table 8, 9, 10, 11 and 12 respectively;
Table 8: Comparability Sequence after normalization
Ex No
0 GRC GRG
Ra MRR Ra MRR w1=w2=0.5
1 0.73418 1.00000 0.40513 0.33333 0.3692
2 0.86076 0.60484 0.36744 0.45255 0.4100
3 1.00000 0.09677 0.33333 0.83784 0.5856
Expt.
No. Ra (μm)
MRR (mm3 /min)
Normalized
Ra MRR
1. 1.52 10907.98 0.26582 0.00000 2. 1.62 20452.46 0.13924 0.39516 3. 1.73 32723.94 0.00000 0.90323 4. 1.30 15582.83 0.54430 0.19355
5. 1.18 28049.09 0.69620 0.70968 6. 1.57
24932.53 0.20253 0.58065 7. 0.94
21036.82 1.00000 0.41936 8. 1.28 21036.82 0.56992 0.41936 9. 1.66 35061.32 0.08861
[image:7.595.320.551.395.609.2]© 2017, IRJET | Impact Factor value: 6.171 | ISO 9001:2008 Certified Journal
| Page 187
4 0.45570 0.80645 0.52318 0.38272 0.4529
5 0.30380 0.29032 0.62205 0.63265 0.6274
6 0.79747 0.41935 0.38537 0.54386 0.4646
7 0.00000 0.58064 1.00000 0.46269 0.7313
8 0.43038 0.58064 0.53741 0.46269 0.5001
9 0.91139 0.00000 0.35426 1.00000 0.6771
Table.9:Deviation sequence, grey relational coefficient and grey relational grades
Sour ce
D F
Seq
SS Adj MS F P
% Co
Contributi on
Spind le speed
2 0. 051139
0 0..025 569
16.8 1
0. 0 56
40 40.63
Feed 2 0.00979 5
0.0036 95
2.43
0 0. 2 92
5.8 5.87
D Dept h of cut
2
0.06428 0
0.0321 4
21.1 3
0. 0 45
3 51.07
Error 2 0.00304 2
0.0003 25
total 8 0 0.12585 2
Table.11: ANOVA for GRG (multiple response characteristics)
Fig. 6 :Main effects plot for Means for GRG
Figure 6 shows the finest combination values for maximizing the multi-objective characteristics or grey relational grade were spindle speed of 1800 rpm, feed rate of 0.2 mm/rev. and depth of cut of 1.2 mm. The response table for the means of grey relational grade is shown in table 10. The ANOVA output of the multi-objective characteristics is given in table 11. From the analysis of this table, it is concluded that depth of cut (51.07 % contribution) followed by speed and feed, is the most significantly affecting the grey relational grade.
Factors
Optimum by gGrey analysis
N
3f
1d
cut3Optimum cutting parameters Prediction
N
3f
3d
cut3Experiment
N
3f
3d
cut3Ra 0.74 0.98
MRR 21036.82 42072.20
GRG 0.7313 0.7895 0.8224
Table.12: Results of confirmation experiment for GRG
Improvement in GRG = 0.8224 – 0.7313 = 0.0911
Percentage error = 100 - (Predicted GRG / Experimental GRG) × 100
=100 - (0.7895 / 0.8224) × 100
=4.01 %
5. CONCLUSIONS
[image:8.595.317.555.59.259.2]The surface roughness and material removal rate were measured under dry cutting condition for different combinations of machining parameters for both the coated and uncoated inserts separately. The final conclusions arrived, at the end of this work are as follows:
[image:8.595.314.563.427.532.2] [image:8.595.49.273.466.693.2]© 2017, IRJET | Impact Factor value: 6.171 | ISO 9001:2008 Certified Journal
| Page 188
From GRA, it is concluded that spindle speed anddepth of cut are prominent factors which affect the turning of EN8 alloy steel. For coated insert the spindle speed with 57.66% contribution is the most influencing factor in determining the multi-objective characteristics or grey relational grade with equal weights for Ra and MRR followed by feed 7.19% contribution and depth of cut 34.66% contribution.
For uncoated insert the depth of cut with 51.07% contribution is the most influencing factor in determining the multi-objective characteristics with equal weights for Ra and MRR followed by spindle speed 40.63% contribution and feed 5.87% contribution.
The best multi-objective characteristics obtained for PVD coated TiAlN insert for turning of EN 8 alloy steel with the higher spindle speed of 1800 rpm, higher feed of 0.2 mm/rev. and higher depth of cut of 1.2 mm with the estimated multi-objective characteristics 0.8107. The experimental value of GRG for this combination of parameters is 0.8554.
For coated insert, the percentage of error between the predicted and experimental values of the multi-objective characteristics during the confirmation experiments is almost within 5.23%.
The best multi-objective characteristics obtained for uncoated insert for turning of EN 8 alloy steel with the higher spindle speed of 1800 rpm, higher feed of 0.2 mm/rev. and higher depth of cut of 1.2 mm with the estimated multi-objective characteristics of 0.7895. The experimental value of GRG for this combination of parameters is 0.8224.
For uncoated insert, the percentage of error between the predicted and experimental values of the multi-objective characteristics during the confirmation experiments is almost within 4.01%
6.
REFERENCES[1.] J. S. Senthilkumaar, P. Selvarani, R. M. Arunachalam, “Intelligent optimization and selection of machining parameters in finish turning and facing of Inconel 718”, International Journal of Advanced Manufacturing Technology (2012) 58,885–894
[2.]Radhakrishnan Ramanujam, Nambi Muthukrishnan, Ramasamy Raju, “Optimization of Cutting Parameters for Turning Al-SiC(10p) MMC Using ANOVA and Grey Relational Analysis”, International Journal of Precision Engineering and Manufacturing, Vol. 12, pp. 651-656.
[3.] Chinnasamy Natarajan, S. Muthu, P. Karuppuswamy,
“Prediction and analysis of surface roughness
characteristics of a non-ferrous material using ANN in CNC turning”, International Journal of Advanced Manufacturing Technology (2011) 57, 1043–1051.
[4.] S. Rajesh, D. Devaraj, R. Sudhakara Pandian, S. Rajakarunakaran, “Multi-response optimization of machining parameters on red mud-based aluminum metal matrix composites in turning process”, International Journal of Advanced Manufacturing Technology (2013) 67, 811–821.
[5.] Tian-Syung Lan, Ming-Yung Wang, “Competitive parameter optimization of multi-quality CNC turning”, International Journal of Advanced Manufacturing Technology (2009) 41, 820–826.
[6.] Lakhdar Bouzid, Smail Boutabba, Mohamed Athmane Yallese, Salim Belhadi, Francois Girardin, “Simultaneous optimization of surface roughness and material removal rate for turning of X20Cr13 stainless steel”, International Journal of Advanced Manufacturing Technology (2014)74, 879–891.
[7.] P. Jayaraman, L. Mahesh kumar, “Multi-response Optimization of Machining Parameters of Turning AA6063 T6 Aluminium Alloy using Grey Relational Analysis in Taguchi Method”, Procedia Engineering 97 (2014 ), 197 – 204.
[8.] Shreemoy Kumar Nayak, Jatin Kumar Patro, Shailesh Dewangan, Soumya Gangopadhyay, “Multi-Objective Optimization of Machining Parameters During Dry Turning of AISI 304 Austenitic Stainless Steel Using Grey Relational Analysis”, Procedia Materials Science 6 ( 2014), 701 – 708.
[9.] Anders Nordgren, Baktash Zargari Samani, RachidM´Saoubi, “Experimental Study and Modelling of Plastic Deformation of Cemented Carbide Tools in Turning”, Procedia CIRP 14 (2014 ), 599 – 604.
[10.] S.J. Raykar, D.M. D'Addona, A.M. Mane, “Multi-objective optimization of high speed turning of Al 7075 using grey relational analysis”, Procedia CIRP 33 ( 2015 ) 293 – 298.
[11.] V. Bushlya, J. Zhou, J.E. Stahl, “Effect of Cutting Conditions on Machinability of Superalloy Inconel 718 During High Speed Turning with Coated and Uncoated PCBN Tools”, Procedia CIRP 3 ( 2012 ), 370 – 375.
[12.] Harsh Y Valera, Sanket N Bhavsar, “Experimental Investigation of Surface Roughness and Power Consumption in Turning Operation of EN 31 Alloy Steel”, Procedia Technology 14 (2014) 528 – 534.