http://dx.doi.org/10.4236/jpee.2015.34002
Obstacles Facing Developing Countries in
Power System Planning
Abdullah M. Al-Shaalan
Electrical Engineering Department College of Engineering King Saud University, Riyadh, Saudi Arabia Email: [email protected]
Received October 2014
Abstract
The problem of power system planning, due to its complexity and dimensionality, is one of the most challenging problems facing the electric power industry in developing as well as developed countries. In planning phase, two of the most important decision-making parameters are the re-liability and costs. The latter includes both system investment costs and outages costs. In this pa-per, these parameters are described and the interrelation between them is evaluated. Some pre-vious approaches and developed techniques will he applied to a particular planning problem in a developing country and some aspects having a significant impact on the decision making process in the planning phase will be considered.
Keywords
Power System Planning, Developing Countries, Reliability Evaluation, System Cost, Outages Cost, Systems Interconnection, Load Uncertainty
1. Introduction
The main issue regarding power system planning in developing countries is to establish basic principles and cri-teria to serve as a framework within which the process of planning may proceed. The framework of power sys-tem planning should be flexible, with the broad objectives of finding a plan (or plans) which guarantee a desired degree of continuous and least cost service. Good service or, in other words, acceptable reliability level of a power system usually requires the addition of more generating capacity to meet the ever increasing electrical demand [1] [2]. However, in many fast developing countries with vast, sparsely populated areas reliability-cost tradeoffs exist to satisfy the fast load growth either by investment in additional generating capacity for isolated systems or by building transmission lines to interconnect these systems in such a way as to transfer power be-tween their load centers in case of emergencies and power shortages. Therefore, reliability and cost constraints are major considerations in power system planning process [3].
2. Reliability Aspects in Power System Planning
manage-ments in the utilities to establisharget reliability levels and to consistently analyze and compare the future relia-bility levels with feasible alternative expansion plans. This need has resulted in the development of comprehen-sive reliability evaluation in power system planning modeling and techniques [4]-[8].
One reliability index, known as the Loss of Load Expectation (LOLE), is presently the most commonly adopted and used probabilistic criterion in power system generation expansion planning. This index computes the expected (long term average) number of days per year on which the available generating capacity is not suf-ficient to supply all the period peak load levels. The first step in evaluating this index is to define models that describe two situations of interest, namely, the capacity model and the load model. These two models are con-volved together to produce the risk index known as the LOLE.
In order to derive the capacity model, each unit in the system is represented by a 2-state capacity model (i.e. available full capacity or unavailable capacity). Each state is then weighted by its probability of occurrence. This process creates the capacity model known as the “Capacity Outage Probability Table, COPT” which contains an array of capacity states and their associated probabilities of occurrences.
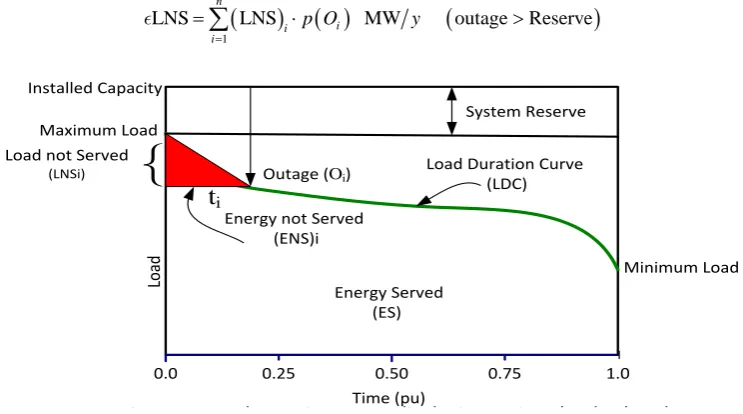
The other load model needed for the LOLE index evaluation is known as the “Load Duration Curve, LDC” which represents an arrangement of a typical period individual load levels in a descending order of magnitude (i.e. starting with the peak load level and ending with the minimum load level) as the one shown in Figure 1.
2.1. Loss of Load Expectation (LOLE)
The two models: COPT and LDC mentioned above are to be combined together in order to yield the required re-liability risk index LOLE as can be exhibited in the following equation:
( ) (
) (
)
1
LOLE days/year outage Reserve
n
i i
i
t p O
=
=
∑
⋅ >where
: time duration of that sever outage
i i
t O
( )
th: probability of loss of load due to the severe outage of size
i i
p O i O
: total number of severe outages ocurred during that period considered
n
2.2. Expected Load Not Served (
LNS)
In power system reliability evaluation, sometimes another reliability index beside the LOLE is needed to know the magnitude of loads that have been lost due to severe outages (i.e. when the existing loads exceed the available sys-tem capacity). So, this index is known as the Expected Load Not Served
(
LNS)
and can be evaluated as in the following equation:(
) ( )
(
)
1
M
LNS LNS W outage Reserve
n
i i i
p O y
=
=
∑
⋅ >
System Reserve
Outage (Oi)
Installed Capacity
Maximum Load
Minimum Load Energy Served
(ES)
Load Duration Curve (LDC) Energy not Served
(ENS)i
{
Load not Served
(LNSi)
_
0.25 0.50 0.75 1.0
0.0
Time (pu)
Load
[image:2.595.111.483.501.708.2]t
iFigure 1. Load Duration Curve displaying various load-related variables
2.3. Expected Energy Not Served (
ENS)
Since the energy not served
(
ENS)
i caused by power outages reflects great damages and heavy losses to the entire consumers classes, so, another essential and most needed reliability index known as the Expected Energy not Ser- ved(
ENS)
can be deduced as in the following equation:(
) ( )
(
)
1
ENS ENS MWh outage Reserve
n
i i i
p O y
=
=
∑
⋅ >
where
(
ENS) (
i = LNS)
i⋅ti: The energy not served due to severeth
i outage of size Oin time t
3. Economic Aspects in Power System Planning
There are several costs that are associated with power systems planning and can be manifested in the following sections
3.1. Fixed Cost
The fixed cost
( )
FC represents the cash flow at any stage of the planning horizon resulting from the costs of installing new generating units during the planning period. It depends on the current financial status of the utility, the type and size of generating units and the cost of time on money invested during the planning period. The to-tal fixed costs(
FCT)
for unit(s) being installed can be computed as:(
)
FCT CAP CCk k NUk t
t k
=
∑∑
⋅ ⋅where
CAP : unit capacity added to the system of type k k.
(
)
CC : capital cost of unit of type k k $/kW .
( )
NU : number of unit s added to the system of type at each interval of time k k t
: interval period of time considered in the planning horiozon, 1, ,
t t= T
3.2. Variable Cost
The variable cost, (VC), represents the cost of energy served by the system. It is affected by the load variation, the type and size of generating units and the number of hours of operation. Also these costs are related to the cost of operation and maintenance (fuel, scheduled maintenance, interim spare parts, repair, staffing, wages and miscel-laneous expenses) and can be evaluated as:
(
)
VCT ESk ESCk NUk t t k
=
∑∑
⋅ ⋅where
ESk
: expected energy served by unit of type k
ESCk: energy served cost of unit of type k ($/kWh)
The total system costs
(
SCT)
for the entire expansion plan can be estimated by summing all the above indi-vidual costs at every stage of the planning period as being expressed in the following equation:SCT =FCT+VCT
3.3. Outages Cost
outages and energy shortages differently. A residential consumer may suffer a great deal of anxiety and incon-venience if an outage occurs during a hot summer day or deprives him from domestic activities or causes food spoilage. For a commercial user, he will also suffer a great hardship and losses of being forced to close until power is restored. Also, an outage may cause a great damage to an industrial customer if it occurs disrupting and disabling the production processes [9] [10].
One method of evaluating the ENS is described in [11]. Therefore, for estimating the outages cost (OC) is to multiply the value of that ENS by an appropriate Outage Cost Rate (OCR), as follows:
(
)
OCT ENS OCR t
t
=
∑
⋅where OCR: US$/kwh and ENS: kWh lost.
The total cost of supplying the electric energy to the consumers is the sum of system cost that will generally increase as consumers are provided with higher reliability and customer outages cost that will, however, de-crease as system reliability inde-creases or vice versa. This total system cost (TSC) can be expressed as in the fol-lowing equation:
TSCT =SCT +OCT
The prominent role of outage cost estimation, as revealed in the above equation, is to assess the worth of power system reliability by comparing this cost (OC) with the size of system investment (SC) in order to arrive at the least overall system cost that will establish the most appropriate system reliability level that ensures ener-gy continuous flow as well as the least cost of its production.
The incorporation of customer outage costs in investment models for power system expansion plans is very difficult for planners in fast developing countries. This difficulty stems principally either from the lack of system records of outage data, failure rate, frequency, duration of repair etc., or the failure to carry out customer surveys to estimate the impact and severity of such outages in terms of monetary value.
4. Models Developed for the Reliability and Cost Evaluation Utilized in This Study
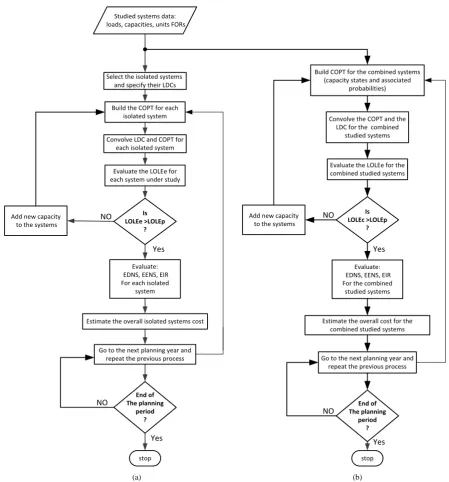
To perform the assessments and analyses of this study, a computer program containing four basic models has been developed at the King Saud University. These models, shown in Figure 2, assess the requirements of veloping power systems in order to satisfy specified reliability and economic criteria and they are briefly de-scribed as follows:SYSDAT model: This model prepares two essential data files, namely, the capacity file and the load file. The first one is known as the Capacity Outage Probability Table (COPT) which contains all the outage capacity states with their associated probabilities of occurrence. The second one is known as the Load Duration Curve (LDC) which arranges the load levels in a typical load variation curve in a descending order of magnitude start-ing with the maximum load and endstart-ing with the minimum load. This preparation process starts by the SYSDA at the beginning of each year of the planning period and then is sent to the SYSREL in the next stage of the planning process in order to perform system reliability evaluation task.
SYSREL model: Receives the data files of both the COPT and the LDC. These two files are then convolved (combined together) to yield the system evaluated risk level, i.e., the Loss of Load Expectation (LOLEe). This LOLEe is then compared with the risk level prescribed by the utility management (LOLEp). If The LOLEe ex-ceeds the LOLEp, an additional capacity should be added to the system in order to maintain itsrisk level within the satisfactory and accepted level prescribed by management decision, otherwise it proceeds to the next year.
SYSENR model: estimates the energy served (ES) by each generating unit residing in the system as well as the energy not served (ENS) due to forced power outages. It adopts a priority loading order, i.e. the generating units are loaded according to their least operation cost. Hence, operating, first, the most efficient and economic oper-ating units (called the base units), followed by the more costly operoper-ating units (called the intermediate units), then followed by the most costly operating units (called the peak units), and so on. This means that the least cost operat-ing units occupy the lower levels in the LDC area, and the more expensive operatoperat-ing units occupy the upper levels in the LDC respectively.
SYSCOS model: computes all system pertinent costs mentioned in the scope and contained in the context of this study like: fixed costs (FC), variable cost (VC), outages cost (OC) and total system cost (TSC).
Studied systems data: loads, capacities, units FORs
Build the COPT for each isolated system
Convolve LDC and COPT for each isolated system
Evaluate the LOLEe for each system under study Select the isolated systems
and specify their LDCs
Evaluate: EDNS, EENS, EIR For each isolated
system
Build COPT for the combined systems (capacity states and associated
probabilities)
Is LOLEc >LOLEp
?
stop
Go to the next planning year and repeat the previous process
End of The planning
period ?
Go to the next planning year and repeat the previous process
Is LOLEe >LOLEp
?
Add new capacity to the systems
Estimate the overall isolated systems cost
End of The planning
period ?
stop
Convolve the COPT and the LDC for the combined
studied systems
Evaluate the LOLEe for the combined studied systems
Add new capacity to the systems
Evaluate: EDNS, EENS, EIR For the combined
studied systems
Estimate the overall cost for the combined studied systems
(A) isolated systems (B) Interconnected Systems
Yes NO
Yes NO
NO
Yes Yes
NO
[image:5.595.84.534.80.563.2]Figure 2. Flowchart for the proposed planning approach
(a) (b)Figure 2. Flowchart for the proposed planning approach. (a) Isolated systems. (b) Interconnected systems.
the merits and advantages of system interconnection in terms of reliability level improvement and reserve ca-pacity saving.
5. Case Study
to the event occurrence. The impacts may then be probability-weighted, and a composite system impact value can be computed. This process may be repeated by examining alternative or contingency plans [12] [13].
5.1. Separate and Integrated Systems
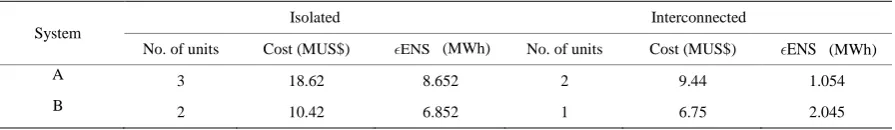
Most power systems have grid interconnections either within the country or among neighboring countries. One objective reported in this paper is to evaluate the reliability benefits associated with the interconnection of power systems. Therefore, study is focused on reliability evaluation of systems A and B both as isolated systems and as interconnected systems. Analysis of this type enables the benefits, if any, that may accrue from integrated rather than isolated systems, to be explored as well as deciding viable generation expansion plans. Therefore, a 6-year expansion plan for systems A and B, assuming a reliability criterion (LOLE) of 0.1 days/year (frequently quoted as a practical value), is determined by implementing the methodology exhibited in Figure 2. The analysis repre- sents the expansion plans for both systems as being isolated and interconnected. A summary of these expansion plans is shown in Table 1 and plotted in Figure 3.
The two systems are reinforced whenever the reliability index exceeds the prescribed risk level at any year of the planning horizon. At years 2 and 4, when both systems reliability levels exceed the prescribed limit, unit (s) must be added. The results, displayed in Table 2, show that the number of units and the present value costs are reduced if the two systems are interconnected rather than being isolated which means saving in both units num-bers and installation costs.
10-3 10-1 1
10-2 0 102
1 2 3 4 5 6
Future planning years
Standard risk (0.1 d/y)
A(B)
A(A)
B(A) 10
10
LOLE
(days
/ year
)
B(B) A(B): system A before interconnection
[image:6.595.185.409.330.478.2]B(B): system B before interconnection A(A): system A after interconnection B(A): system B after interconnection
[image:6.595.84.542.522.629.2]Figure 3. Variations of LOLE before and after interconnection.
Table 1. LOLE index for both systems as isolated and as interconnected.
Year A(B) A(A) B(B) B(A)
1 00.07234 0.00637 0.00926 0.00006
2 00.68861 0.00709 0.06790 0.00313
3 00.96242 0.08670 0.51488 0.00645
4 00.85371 0.13842 4.62191 0.08838
5 30.16790 0.75614 9.95545 0.21623
6 80.93185 8.29678 30.60693 0.94383
Table 2. Systems costs for isolated and interconnected systems.
System Isolated Interconnected
No. of units Cost (MUS$) ENS (MWh) No. of units Cost (MUS$) ENS (MWh)
A 3 18.62 8.652 2 9.44 1.054
[image:6.595.91.539.656.721.2]From the above analysis, it can be concluded that both systems will benefit from the interconnection in terms of saving in installation costs as well as reduction in size of energy interruptions. However, the next step must assess the economic and technical merits that may result from either building costly high voltage transmission lines in order to integrate isolated systems or instead, adding generating capacity to each system independently.
5.2. Uncertainty in Future Loads Growth
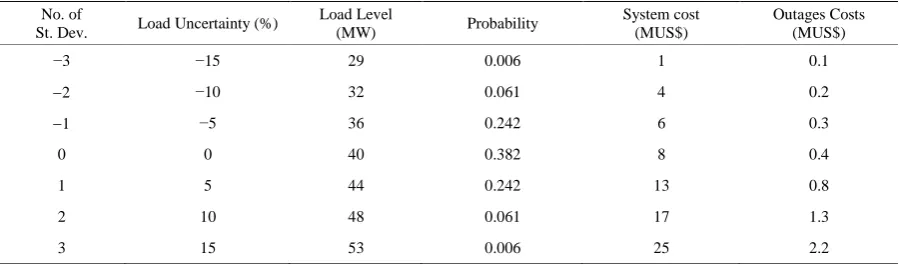
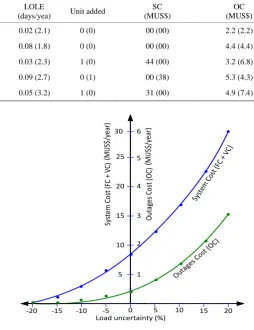
In some existing generation expansion planning methods it has been assumed that the forecast peak demands do not change. In fast developing countries, this assumption does not hold rigorously and there is always some de-gree of uncertainty in future loads growth forecasting. This uncertainty is likely to affect the system reliability levels and consequently to influence the capacity planning decision [8]. To investigate the uncertainty impact System “A” was chosen to be analyzed. The forecasted peak load was represented by a normal distribution hav-ing a standard deviation of 10% and this remained constant for the plannhav-ing period. There are several important aspects associated with load uncertainty were evaluated such as system cost and outages costs using a load mod-el having 7 discrete intervals. The effect of load uncertainty upon both system costs and outages costs are tested and the results are shown in Table 3 and depicted in Figure 4 which reveals that these costs (i.e. SC and OC) increase with increasing loads which implies reduction in the prescribed reliability level and hence requires more investment and operation costs [14].
5.3. Uncertainty in Unit Installation Date
In developing countries, a delay in unit installation date, due to probable undesirable economic conditions (e.g. lack of investment, rare resources, political havoc etc.) should be expected and taken into consideration in the planning horizon. Hence, to show the effect of more than on year’s delay in unit installation dates has been in-vestigated using system A. Figure 5 shows the effect of delaying unit installation date for an extended number of future years and its consequences upon both system cost (SC) and outage cost (OC). It is evident from the ta-ble that installation delay has an adverse impact upon system reliability index (LOLE) as well as system costs that are directly related to it.
If more uncertainties in installation dates are assumed, results depicted by Figure 4 show that, as unit defer-ring is increased, the outages cost increase rapidly but that the system cost steadily decreases. On the contrary, the timely installation has less effect on the outage costs than in the delayed case. Consequently, incentives should exist to justify decisions upon delaying or complying with the scheduled date of unit addition. One rea-son could be that it would be a catastrophic if unit installation is postponed for longer periods as shown in Fig-ure 5.
In developing countries data collection is not an easy task and it is often difficult to establish probabilistic da-ta for a system which did not have regular and organized collection of dada-ta for the use in probabilistic techniques. It is, therefore, important to establish systematic data collections describing all behavior aspects of power system which can then be used in reliability and economic evaluation for future planning and studies which are critical-ly needed for power system planning in developing countries.
[image:7.595.88.538.587.719.2]The effect of advancing unit installation date has been analyzed again using the same system A. The sensitiv-ity analysis results are is shown in Table 4 and depicted in Figure 5, The results indicate that advancing unit
Table 3. Data for load forecast uncertainty.
No. of
St. Dev. Load Uncertainty (%)
Load Level
(MW) Probability
System cost (MUS$)
Outages Costs (MUS$)
−3 −15 29 0.006 1 0.1
−2 −10 32 0.061 4 0.2
−1 −5 36 0.242 6 0.3
0 0 40 0.382 8 0.4
1 5 44 0.242 13 0.8
2 10 48 0.061 17 1.3
Table 4. System costs variation for timely and (delayed) installation dates.
Year Peak Load
(MW)
LOLE
(days/yea) Unit added
SC (MUS$) OC (MUS$) Percentage Increase (decrease)
1 435 0.02 (2.1) 0 (0) 00 (00) 2.2 (2.2) 2.0 (2.3)
2 511 0.08 (1.8) 0 (0) 00 (00) 4.4 (4.4) 5.4 (5.4)
3 571 0.03 (2.3) 1 (0) 44 (00) 3.2 (6.8) 7.2 (7.8)
4 632 0.09 (2.7) 0 (1) 00 (38) 5.3 (4.3) 10.3 (10.4)
5 712 0.05 (3.2) 1 (0) 31 (00) 4.9 (7.4) 13.7 (14.8)
0 10 15 20
-5 5 -10 -15 -20 5 10 15 20 25 30 Syste m Cost
(FC + VC ) Outage s Cost (OC) 1 2 3 4 5 6 Syste m Cost (FC + VC ) Outage s Cost (OC )
Figure 4. Effect of load uncertainty on system and outages costs
(MUS $/ year ) (MUS $/ year )
Load uncertainty (%)
Figure 4. Effect of load uncertainty on system and outages costs.
0.1
0 1 10 100
1 2 3 4 5
SC and OC
(
MUS
$
)
Delayed / Advanced unit installation dates (Years)
2.3% 5.4% 7.8% 10.4% 14.8% 2.0% 5.4%
7.2% 10.3%
13.7%
0.01
Advance case
Delay case
Figure 5. Effect of delay/advance in installation dates
Percentage decrease in SC
[image:8.595.178.417.458.630.2]Percentage increase in SC
Figure 5. Effect of delay/advance in installation dates.
6. Conclusions
In this paper, significant issues that may arise in power system planning in developing countries have been con-sidered, analyzed and discussed. Two major constraints associated with power planning process, namely, relia-bility and cost have been modeled and applied to particular systems expansion planning in a developing country. The results demonstrate the benefits and merits associated with both reliability and cost of interconnecting iso-lated power systems into an integrated system. The uncertainly in future loads growth and unit installation time can be costly and undesirable. Therefore, their effects should be anticipated and studied in order to mitigate their effects so that possible deterioration in system reliability level as well as unnecessary additional expenditure can be averted.
In developing countries data collection is not an easy task and it is often difficult to establish probabilistic da-ta for a system which did not have regular and organized collection of dada-ta for the use in probabilistic techniques. It is, therefore, important to establish systematic data collections describing all behavior aspects of power system which can then be used in reliability and economic evaluation for future planning and studies which are critical-ly needed for power system planning in developing countries.
References
[1] Covarrubias, A.J. (1988) Expert Systems and Power System Planning in Developing Countries. IEEE Conference Proceedings, Southeastcon’88, 11-13 April 1988, 551-555.
[2] Shaalan, A.M. (2011) Essential Aspects of Power System Planning in Developing Countries. Journal of King Saud University—Engineering Sciences, 23, 27-32.
[3] Schramm, G. (1990) Electric Power in Developing Countries: Status, Problems, Prospects. Annual Review of Power, 15, 307-333. http://dx.doi.org/10.1146/annurev.energy.15.1.307
[4] El-Zayyat, H., et al. (1991) Power System Planning in Developing Countries, the Case of Jordan. Mansoura Engineer-ing Journal (MEJ), 16.
[5] Meier, P. (1990) Power Sector Innovation in Developing Countries: Implementing Investment Planning under Capital and Environmental Constraints. Annual Review of Power, 15, 277-306.
http://dx.doi.org/10.1146/annurev.eg.15.110190.001425
[6] Agalgaonkar; A.P. and Kulkarni, S.V. (2006) Evaluation of Configuration Plans for DGs in Developing Countries Us-ing Advanced PlannUs-ing Techniques. IEEE Transaction on Power Systems, 21, 973-981.
[7] Wilbanks, T.J. (1990) Implementing Environmentally Sound Power Sector Strategies in Developing Countries. Annual Review of Power, 15, 255-276. http://dx.doi.org/10.1146/annurev.eg.15.110190.001351
[8] Sadeghzadeh, S.M. and Ansarian, M. (2006) Techno-Economic Power System Planning in Developing Countries. 7th IET International Conference on Advances in Power System Control, Operation and Management (APSCOM), Hong Kong, 30 October-2 November 2006, 216. http://dx.doi.org/10.1049/cp:20062083
[9] Billinton, R. and Allan, R.N. (1984) Reliability Evaluation of Power Systems. Pitman Books, London.
http://dx.doi.org/10.1007/978-1-4615-7731-7
[10] Shaalan, A. M. (2012) Reliability Evaluation in Generation Expansion Planning Based on the Expected Energy Not Served. Journal of King Saud University (Engineering Sciences), 1.
[11] Shaalan, A.M. (1984) Reliability Evaluation in Long-Range Generation Expansion Planning. PhD Thesis, Victoria University of Manchester, Manchester, UK, April 1984, 51-58.
[12] Rudnick, H. and Quinteros, R. (1998) Power System Planning in the South America Electric Market Restructuring. VI Symposium of Specialists in Electric Operational and Expansion Planning—VI SEPOPE, Bahia, 24-29 May 1998. [13] Weber, A., et al. (2013) Long-Term Power System Planning in the Context of Changing Policy Objectives. Workgroup
for Infrastructure Policy (WIP), University of Technology, Berlin, June 2013.