6
II
February 2018
Comparative Study of Different Classification
Algorithms on ILPD Dataset to Predict Liver
Disorder
Ayesha Pathan1, Diksha Mhaske2, Shrutika Jadhav3, Rupali Bhondave4, Dr.K.Rajeswari5 1, 2, 3
Student, Department of Computer Engineering, PCCOE 4, 5
Professor, Department of Computer Engineering ,PCCOE
Abstract: Data mining techniques can be applied in various fields such as Information Retrieval, Business analytics, Medicine and many more. This paper deals with medical field which mainly focuses on liver disease diagnoses. The aim of this study is to implement different classification algorithms on Indian Liver Patient Dataset (ILPD) using WEKA in order to get proper prediction of liver disorders. Feature selection is carried out on the dataset. Pre-processing is carried out to pre-process and cluster the data. K means clustering algorithm is used for pre-processing the data. The clustered data is further applied to various classification algorithms such as Naive Bayes, Ada Boost, J48, Bagging and Random Forest. A comparison is carried out considering performance measures such as Accuracy, Error rate, Precision, Recall and F measure. On the basis of comparison, the results are concluded. Random Forest algorithm provides best performance among all.
Keywords: ILPD, Pre-processing, Classification algorithms, Performance Measures, WEKA.
I. INTRODUCTION
Data mining uncover patterns from the large amount of information stored and is used to build predictive models. Medical field consist of large amount of data that needs to be processed. Data mining in medical field improves the accuracy of prediction of healthcare patterns. Data mining techniques such as classification and prediction, clustering, association rule mining and various mining methods can be useful to apply on medical data.
Several machine learning algorithms for data mining tasks are included in WEKA. Users can use their own algorithm in the form of java code or use inbuilt algorithms to be applied on data sets. WEKA provides general purpose environment tools for data pre-processing, classification, clustering, regression, association rules, visualization feature and selection. This tool allows us to view and modify the data attributes. Further this data can be passed to any of the algorithms. A detailed result along with summary of all the calculations is generated. The prime focus is to implement the classification algorithms using WEKA to make predictions in order to help physicians, by providing accurate patients pathological status. Pre-processing helps to improve the accuracy of classification algorithms. Pre-processing technique is applied on the dataset to remove noise and cluster the data. The pre-processed data is applied to various classification algorithms and their performance is compared.
II. LITERATURE SURVEY
Medical Diagnosis is a difficult process which requires experience and proficiency to deal with medical data [1]. Various diseases like heart disease, diabetes, breast cancer and liver disorder are diagnosed using various data mining techniques. Data mining provides better results in disease diagnosis when appropriate tools and techniques are applied. Several target values are combined to obtain disease prediction using various clustering and classification methods [1-2].
Data mining deals with large databases that impose on clustering analysis. Clustering deals with grouping of data into clusters. Various clustering methods are introduced for cluster analysis purpose [3-4]. Enhanced K-Means, DB-Scan and Fuzzy C Means algorithms are applied on medical data.
III. DATASET
[image:3.612.170.442.142.385.2]The dataset used in this paper is ILPD dataset. This dataset is available on UCI machine learning repository [15]. This dataset contains 583 records with 11 attributes. It contains 416 liver patient records and 167 non liver patient records. Attributes detail is mentioned in Table 1.
Table 1. ILPD Dataset Attributes
Attribute Number
Attribute Name with description
1 Age : Age of the patient
2 Gender : Gender of the patient
3 TB : Total Bilirubin
4 DB : Direct Bilirubin
5 Alkphos : Alkaline Phosphotase
6 SGPT : Almine Aminotransferase
7 SGOT : Aspartate Aminotransferase
8 TP : Total Proteins
9 ALB : Albumin
10 A/G Ratio : Albumin and Globulin Ratio
11 Selector: Field used to split data into two set
IV.METHODOLOGY
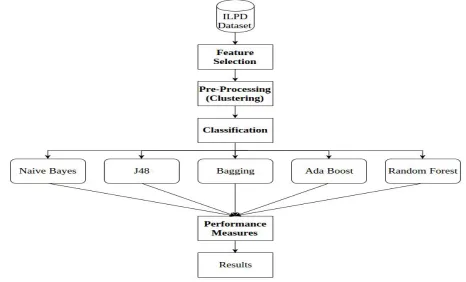
The work is divided into three parts: Feature selection, Pre-processing and Classification. The flow diagram of entire work described in this paper is mentioned in the Fig4.1.
[image:3.612.71.537.442.724.2]A. Feature Selection
The dataset contains n number of attributes. Usually data is represented by L dimension vector. L represents the total number of features. All the features are not so useful. Instead of using all the features, we can select the best feature for clustering. This will improve the performance of a clustering task. The process of selecting the best feature is called feature selection. There are many feature selection techniques that can be used to improve the performance. The features selected are selector and age.
B. Pre-processing Technique
The pre-processing technique used in this paper is K means clustering algorithm[6]. K means algorithm is as follows-
1) Input
K – It represents the number of clusters D – It is the dataset containing N objects
2) Output
A Set of clusters
3) Method
a) Arbitrary choose k objects from D as in initial cluster centre
b) Repeat
c) Reassign each object to the most similar cluster based on the mean value of the objects in the cluster
d) Update the cluster means Until no change This technique clusters the data into two sets - liver data and non-liver data.
C. Classification Techniques
1) Naive Bayes [11]:The Naive Bayes algorithm is a simple probabilistic classifier that is used to calculate a collection of probabilities by investigating frequency and combination of values in a given data set. The algorithm is based on applying Bayes theorem with the “naive” assumption of independence between every pair of features. Model of Naive Bayes can be defined by
( | ) = ( | ) × ( )
( ) ...Equation (1)
2) AdaBoost [12]: AdaBoost is used to boost the performance of decision trees on binary classification problems. It is also termed as discrete AdaBoost because this algorithm is mostly used for classification rather than regression. Each instance in the training dataset is weighted. The initial weight is set to: weight (xi) = 1/n, where xi is the i’th training instance and n is the number of training instances.
3) J 48 [11: J48 is an extension of C4.5 algorithm. It allows classification either using decision trees or rules generated from them. This technique is used to construct a tree. It works on categorical as well as continuous values. The nodes of tree denote different attributes. The branches between nodes represent the possible value of attributes and the terminal node represents the final values of the dependent variables.
4) Bagging [13]: Bagging is a simple and powerful ensemble method. It randomly generates bootstrap samples from the training set using sampling without replacements. Each sample is used to train a different component of classifier. Classification is carried out by plurality voting.
5) Random Forest [14]: Random Forest is an ensemble algorithm with Decision tree model. It builds multiple CART models with different sample and initial variables. This algorithm potentially improves classification accuracy. Random forest is similar to bagging and results in a very powerful classifier
V. RESULTS AND DISCUSSIONS
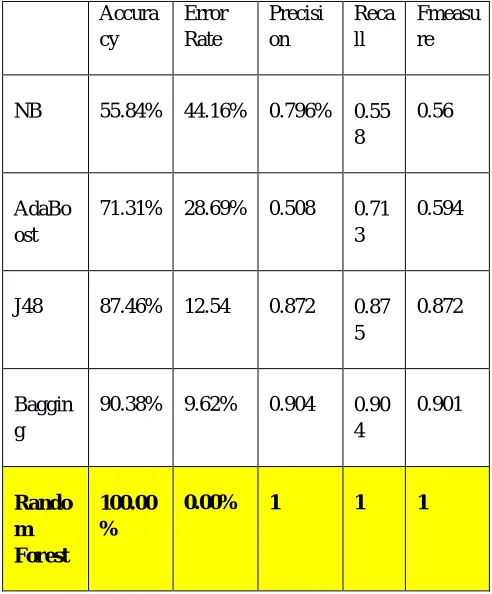
Table 2. Performance comparison of classification algorithms Accura cy Error Rate Precisi on Reca ll Fmeasu re
NB 55.84% 44.16% 0.796% 0.55
8
0.56
AdaBo ost
71.31% 28.69% 0.508 0.71
3
0.594
J48 87.46% 12.54 0.872 0.87
5
0.872
Baggin g
90.38% 9.62% 0.904 0.90
4 0.901 Rando m Forest 100.00 %
0.00% 1 1 1
Accuracy: It is the ratio of correctly classified observation to the total observations.
Accuracy, acc =
A comparison on accuracy easure of classificaion algorithms is given in Fig 5.1.
Fig 5.1 Accuracy of classification algorithms
Error Rate : It is the ratio of incorrectly classified observation to the total observations.
Error rate, err =
[image:5.612.170.433.459.642.2]Fig 5.2 Error Rate of classification algorithms
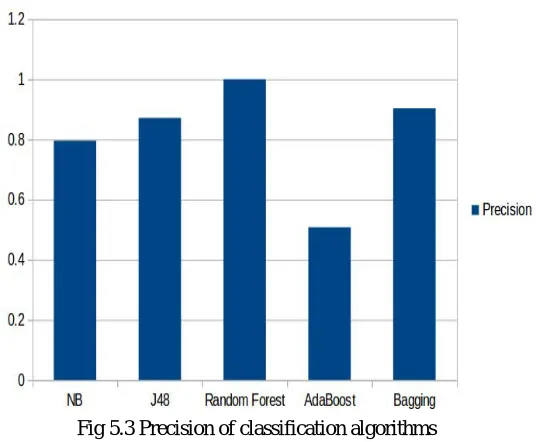
Precision: It is the ratio of correctly classified positive observations to the total classified positive observations.
Precision, p =
A comparison on precision measre of classification algorithms is given in Fig 5.3.
Fig 5.3 Precision of classification algorithms
Recall: It is the ratio of correctly classified positive observations to the all observations in actual class.
Recall, r =
[image:6.612.178.446.375.596.2]Fig 5.4 Recall of classification algorithms
F measures: It is weighted average of precision and recall.
F measure = = ×
×
[image:7.612.205.456.342.535.2]A comparison on F-measure of classification algorithms is given in Fig 5.5.
Fig 5.5 Fmeasure of classification algorithms
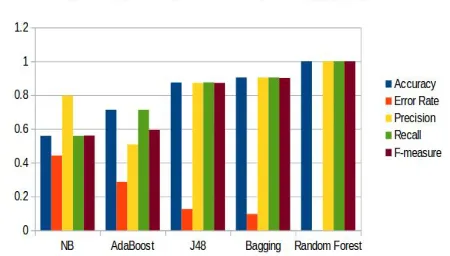
The overall comparison of performance measures of all classification algorithms is given in Fig 5.6.
[image:7.612.195.420.584.712.2]It can be noted from the results that the parameters accuracy, error rate, precision, recall and F-measure are high for Random Forest algorithm.
VI.CONCLUSION
The main aim of this paper is to improve the accuracy of classification of liver disorders. The aim is achieved by performing a comparative study of classification algorithms on the ILPD dataset. Pre-processing technique is used to divide the data into two groups- liver patients and non liver patient. This is done using K means clustering algorithm. Further the clustered dataset is applied to various classification algorithms. The performance of each algorithm is evaluated and a comparative study has been carried out. Based on the performance comparison, it is clear that Random Forest algorithm provides better performance as compared to Naive Bayes, AdaBoost, J48 and Bagging.
REFERENCES
[1] Sridevi Radhakrishnan, Dr D. "A CRITICAL STUDY ON DATA MINING TECHNIQUES IN HEALTHCARE DATASET." (2015). [2] Kirubha, V., and S. Manju Priya. "Survey on Data Mining Algorithms in Disease Prediction." (2016): 124-128.
[3] Xu, Rui, and Donald Wunsch. "Survey of clustering algorithms."IEEE Transactions on neural networks 16.3 (2005): 645-678. [4] Rai, Pradeep, and Shubha Singh. "A survey of clustering techniques."International Journal of Computer Applications 7.12 (2010): 1-5 [5] Kalyani, P. "Approaches to partition medical data using clustering algorithms."International Journal of Computer Applications 49.23 (2012).
[6] Babu, MS Prasad, et al. "Implementation of partitional clustering on ILPD dataset to predict liver disorders."Software Engineering and Service Science (ICSESS), 2016 7th IEEE International Conference on. IEEE, 2016.
[7] Pakhale, Harsha, and Deepak Kumar Xaxa. "A Survey on Diagnosis of Liver Disease Classification."International Journal f Engineering and Techniques 2.3 (2016): 2395-1303
[8] Sindhuja, D., and R. Jemina Priyadarsini. "A Survey on Classification Techniques in Data Mining for Analyzing Liver Disease Disorder."International Journal of Computer Science and Mobile Computing 5.5 (2016).
[9] Ghosh, S. R., and S. Waheed. "Analysis of classification algorithms for liver disease diagnosis."Journal of Science, chnology and Environment Informatics 5.01 (2017): 361-370.
[10] Ramana, Bendi Venkata, M. Surendra Prasad Babu, and N. B. Venkateswarlu. "A critical study of selected classification algorithms for liver disease diagnosis."International Journal of Database Management Systems 3.2 (2011): 101-114.
[11] atil, Tina R., and S. S. Sherekar. "Performance analysis of Naive Bayes and J48 classification algorithm for data classification." International Journal of Computer Science and Applications 6.2 (2013): 256-261.
[12] Schapire, Robert E. "A brief introduction to boosting." Ijcai. Vol. 99. 1999.
[13] Bauer, Eric, and Ron Kohavi. "An empirical comparison of voting classification algorithms: Bagging, boosting, and variants." Machine learning 36.1 (1999): 105-139.
[14] Breiman, Leo. "Random forests." Machine learning 45.1 (2001): 5-32.