0095-1137/09/$08.00⫹0 doi:10.1128/JCM.00221-09
Accuracy of Commercial and Reference Susceptibility Testing Methods
for Detecting Vancomycin-Intermediate
Staphylococcus aureus
䌤
Jana M. Swenson,* Karen F. Anderson, David R. Lonsway, Angela Thompson, Sigrid K. McAllister,
Brandi M. Limbago, Roberta B. Carey, Fred C. Tenover,† and Jean B. Patel
Clinical and Environmental Microbiology Branch, Division of Healthcare Quality Promotion, Centers for Disease Control and Prevention, Atlanta, Georgia 30333
Received 2 February 2009/Returned for modification 12 March 2009/Accepted 29 April 2009
We compared the results obtained with six commercial MIC test systems (Etest, MicroScan, Phoenix, Sensititre, Vitek Legacy, and Vitek 2 systems) and three reference methods (agar dilution, disk diffusion, and vancomycin [VA] agar screen [VScr]) with the results obtained by the Clinical and Laboratory Standards Institute broth microdilution (BMD) reference method for the detection of VA-intermediateStaphylococcus aureus(VISA). A total of 129S. aureusisolates (VA MICs by previous BMD tests,<1g/ml [nⴝ60 strains], 2g/ml [nⴝ24], 4g/ml [nⴝ36], or 8g/ml [nⴝ9]) were selected from the Centers for Disease Control and Prevention strain collection. The results of BMD with Difco Mueller-Hinton broth were used as the standard for data analysis. Essential agreement (percentⴞ1 dilution) ranged from 98 to 100% for all methods except the method with the Vitek Legacy system, for which it was 90.6%. Of the six commercial MIC systems tested, the Sensititre, Vitek Legacy, and Vitek 2 systems tended to categorize VISA strains as susceptible (i.e., they undercalled resistance); the MicroScan and Phoenix systems and Etest tended to categorize susceptible strains as VISA; and the Vitek Legacy system tended to categorize VISA strains as resistant (i.e., it overcalled resistance). Disk diffusion categorized all VISA strains as susceptible. No susceptible strains (MICs < 2 g/ml) grew on the VScr, but all strains for which the VA MICs were 8g/ml grew on the VScr. Only 12 (33.3%) strains for which the VA MICs were 4g/ml grew on VScr. The differentiation of isolates for which the VA MICs were 2 or 4g/ml was difficult for most systems and methods, including the reference methods.
In January 2006, the Clinical and Laboratory Standards In-stitute (CLSI) published new interpretive criteria for vanco-mycin andStaphylococcus aureus. The breakpoints were low-ered fromⱕ4g/ml toⱕ2g/ml for susceptible, 8 to 16g/ml to 4 to 8g/ml for intermediate, andⱖ32g/ml toⱖ16g/ml for resistant (2). The vancomycin breakpoints for coagulase-negative staphylococci were not changed. The rationale for lowering theS. aureusintermediate breakpoint to 4g/ml was (i) that intermediateS. aureusisolates, although they are rare, likely represented a population of organisms that demonstrate heteroresistance, and (ii) limited outcome data suggested that infections with these isolates are likely to fail vancomycin ther-apy (9). The results of broth microdilution performed by use of the CLSI reference method were the primaryS. aureus suscep-tibility data evaluated before the CLSI breakpoint change was made. We undertook the study described here to determine the accuracy of commercial systems and reference methods for the detection of decreased vancomycin susceptibility among isolates ofS. aureus.
(This work was presented in part at the 47th Interscience Conference on Antimicrobial Agents and Chemotherapy, Chi-cago, IL, 17 to 20 September 2007.)
MATERIALS AND METHODS
Bacterial strains.One hundred twenty-nine isolates ofS. aureusfor which the vancomycin MICs ranged fromⱕ1 to 8g/ml were selected from the Centers for Disease Control and Prevention (CDC) strain collection. The original vancomy-cin MICs for the isolates wereⱕ1g/ml for 60 isolates tested, 2g/ml for 24 isolates tested, 4g/ml for 36 isolates tested, and 8g/ml for 9 isolates tested. All isolates were subcultured twice after their removal from frozen storage. We tested all methods and systems on the same day using inocula taken from blood agar medium (Trypticase soy agar containing 5% sheep blood) that had been subcultured from a common blood agar plate. The quality control strains tested wereS. aureusATCC 29213 andEnterococcus faecalisATCC 29212 for MIC testing andS. aureusATCC 25923 for disk diffusion testing.
Reference antimicrobial susceptibility testing (AST) methods.The CLSI ref-erence methods used included the broth microdilution, agar dilution, and disk diffusion methods and the vancomycin agar screen (2, 3). We prepared MIC panels at CDC by using concentrations of vancomycin ranging from 0.25 to 128
g/ml and Mueller-Hinton broth from Difco (BMIC-Difco; cation adjusted after preparation; Becton Dickinson, Sparks, MD) and BBL (BMIC-BBL; received as cation-adjusted Mueller-Hinton broth; Becton Dickinson). Of the reference methods tested, we chose the MICs obtained with BMIC-Difco as the standard for data analysis because BMIC-Difco is routinely used in our laboratory. We used Difco Mueller-Hinton agar (Becton Dickinson) with the same drug dilu-tions used for preparation of the broth microdilution plates to prepare the agar dilution plates. Commercially prepared BBL Mueller-Hinton agar plates (Bec-ton Dickinson) were used for disk diffusion and Etest. Vancomycin agar screen plates were obtained from Remel (Lenexa, KS).
Commercial AST systems.AST was performed with the following six com-mercial systems: the MicroScan system (inoculated with the Prompt, type 20A, MIC panel with vancomycin concentrations from 2 to 16g/ml; Siemens Health-care Diagnostics, Deerfield, IL), the Vitek Legacy system (GPS-109 card with a reportable vancomycin MIC range from 0.5 to 32g/ml; bioMe´rieux, Durham, NC), the Vitek 2 system (AST-GP61 with a reportable vancomycin range from 1 to 32g/ml; bioMe´rieux), the Sensititre system (GPN3F panel with a vancomycin range from 1 to 128g/ml; TREK Diagnostic Systems, Cleveland, OH), the Phoenix system (PMIC-102 card with a vancomycin range from 0.5 to 16g/ml; Becton Dickinson), and Etest (vancomycin range, 0.016 to 256g/ml; AB Bio-disk, Solna, Sweden). We used the revised CLSI breakpoints to analyze the MICs
* Corresponding author. Mailing address: Centers for Disease Con-trol and Prevention, Mailstop G08, 1600 Clifton Road, Atlanta, GA 30333. Phone: (404) 639-0196. Fax: (404) 638-1381. E-mail: jswenson @cdc.gov.
† Present address: Cepheid, 904 Caribbean Drive, Sunnyvale, CA 94089.
䌤Published ahead of print on 6 April 2009.
2013
on May 16, 2020 by guest
http://jcm.asm.org/
obtained with each system. Essential agreement (the MIC⫾1 log2dilution) and
category interpretations of susceptible, intermediate, or resistant were calculated by use of the revised breakpoints. For Etest, non-log2 concentrations were
rounded up to the next log2concentration for data analysis.
Following testing of the 129 selected isolates with the systems and by the methods described above, updated panels for the commercial systems became available. These updated panels (MicroScan system, Pos MIC 26; Phoenix sys-tem, PMIC/ID-104; Sensititre syssys-tem, GPALL1F; and Vitek 2 syssys-tem, AST-GP67) were used to retest the 43 organisms in the original study for which a category error occurred with any of the systems or by any of the test methods used. These included 20 organisms for which the vancomycin MICs with BMIC-Difco wereⱕ2g/ml, 22 organisms for which the vancomycin MICs were 4
g/ml, and 1 organism for which the vancomycin MIC was 8g/ml.
RESULTS AND DISCUSSION
MIC results and category interpretations for all methods are shown in Table 1. For the method with BMIC-Difco, which we designated as the standard for our study, 34.9% of the results were in the intermediate category (that is, the isolates were vancomycin-intermediateStaphylococcus aureus [VISA]) and 65.1% were in the susceptible category. The percentage of results in the intermediate category for the other methods ranged from 0% with the Vitek Legacy system to 50.4% with the Phoenix system.
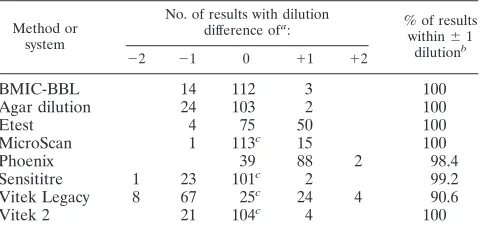
The differences in MIC results among the eight methods compared with the results obtained with BMIC-Difco are shown in Table 2, along with the percentage of results within
⫾1 dilution (essential agreement) of the result obtained with BMIC-Difco. Essential agreement was excellent (98.4 to 100%) for all methods except that performed with the Vitek Legacy system.
We compared the ability of the testing methods to deter-mine the correct category interpretation compared with the category interpretations obtained with BMIC-Difco. The com-parison and the kinds of discrepancies that occurred are shown in Table 3. The method with BMIC-BBL was the only one with
ⱖ95% overall category agreement compared with the results obtained with BMIC-Difco. Except for the Vitek Legacy sys-tem, the category agreements for the other seven MIC meth-ods varied within a close range of 84.5 to 92.2%. Category agreement between the method with BMIC-Difco and the Vitek Legacy system was only 64.8%. For the discrepancies
that occurred, the method with BMIC-BBL, the agar dilution method, the Sensititre system, and the Vitek 2 system tended to categorize more VISA isolates as susceptible than the method with BMIC-Difco; Etest, the MicroScan system, and the Phoenix system categorized more susceptible isolates as VISA. The Sensititre system categorized one VISA isolate as resistant. None of the isolates tested with the Vitek Legacy system yielded MICs of 4 or 8g/ml; with that system, 35 of the VISA strains were categorized as susceptible and 10 were categorized as resistant.
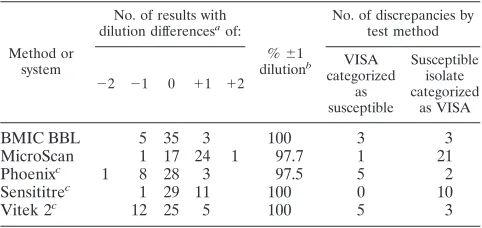
The results obtained by retesting of the 43 organisms for which a category discrepancy had occurred in the original study but with updated commercial panels for four of the systems are shown in Table 4. Again, essential agreement was excellent (97.5 to 100%) compared to the MICs obtained by the method with BMIC-Difco, although there were some differences in the trend toward higher or lower MICs and the kinds of category discrepancies noted. The MicroScan system again tended to categorize susceptible isolates as VISA and the Vitek 2 system tended to categorize VISA isolates as susceptible. The results for the Sensititre system changed from tending to undercall resistance to overcalling resistance. However, 40 of the 43 organisms retested had vancomycin MICs at the breakpoint (2 to 4g/ml), making minor errors more likely and complicating the conclusions that can be drawn from the retesting.
[image:2.585.42.283.89.223.2]The vancomycin agar screen test (data not shown) and the disk diffusion test (Fig. 1) were both insensitive for the detec-tion of VISA isolates. None of the isolates with vancomycin MICs ofⱕ2g/ml grew on the agar screen plates, but isolates with vancomycin MICs of 8 g/ml did grow. The results for isolates with vancomycin MICs of 4g/ml were variable; only 12 of 36 (33.3%) of these isolates grew on the agar screen plates. All of the VISA isolates, regardless of whether the MIC was 4 or 8g/ml, were categorized as vancomycin susceptible by disk diffusion (zone diameters, ⱖ15 mm) (Fig. 1). CLSI recently rescinded the vancomycin disk diffusion breakpoints forS. aureus and they no longer appear in Table 2C of the CLSI performance standards (4).
TABLE 1. Vancomycin MICs and MIC categories determined by three reference methods and six commercial systems
Method or system
No. of results with vancomycin MIC (g/ml) ofa
:
% of results with vancomycin category ofb
: 0.5 1 2 4 8 16 S I R
BMIC-Difco 7 53 24 36 9 65.1 34.9 0
BMIC-BBL 9 53 26 35 6 68.2 31.8 0
Agar dilution 9 54 33 29 4 74.4 25.6 0
Etestc 4 22 48 47 8 57.4 42.6 0
MicroScan 74 42 13 57.4 42.6 0
Phoenix 9 55 42 23 49.6 50.4 0
Sensititre 64 33 28 1 1 76.4 22.8 0.8
Vitek Legacy 46 1 71 10 92.2 0 7.8
Vitek 2 68 24 29 8 71.3 28.7 0
a
Boldface indicates that the MICs for the isolates were less than or equal to the MIC listed.
b
S, susceptible; I, intermediate; R, resistant.
c
Values are rounded up to log2concentration.
TABLE 2. Dilution difference of eight test methods compared with result by BMIC-Difco reference method
Method or system
No. of results with dilution difference ofa
: % of resultswithin⫾1 dilutionb
⫺2 ⫺1 0 ⫹1 ⫹2
BMIC-BBL 14 112 3 100
Agar dilution 24 103 2 100
Etest 4 75 50 100
MicroScan 1 113c 15 100
Phoenix 39 88 2 98.4
Sensititre 1 23 101c 2 99.2
Vitek Legacy 8 67 25c 24 4 90.6
Vitek 2 21 104c 4 100
a⫺2, result by the test method is 2 log
2concentrations lower than the
BMIC-Difco MIC;⫺1, result by the test method is 1 log2concentration lower than the
BMIC-Difco MIC; 0, result by the test method is the same as that of the BMIC-Difco MIC;⫹1, result by the test method is 1 log2concentration greater
than the BMIC-Difco MIC;⫹2, result by the test method is 2 log2concentrations
greater than the BMIC-Difco MIC.
bEssential agreement. cIncludes off-scale results.
on May 16, 2020 by guest
http://jcm.asm.org/
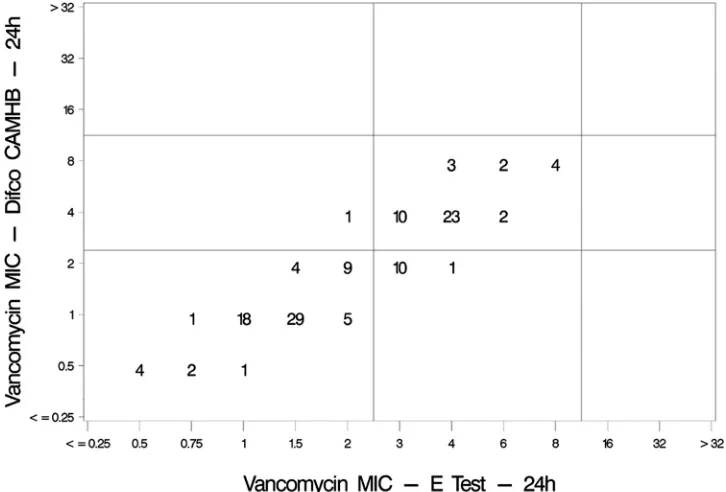
[image:2.585.302.542.90.205.2]The results obtained by Etest compared with those obtained with BMIC-Difco are shown in Fig. 2.
Only a few studies have assessed the accuracy of suscepti-bility testing methods for detecting VISA strains. In 1998, CDC tested eight VISA strains using Etest, conventional and rapid MicroScan panels, the Sensititre system, the Vitek Leg-acy system, and the vancomycin agar screen method. All the commercial MIC methods, except the MicroScan rapid panels, gave acceptable results under the CLSI interpretive criteria used before 2006 (8). The authors reported that the vancomy-cin agar screen plates prepared in-house did not perform as well as commercially prepared plates. The commercially pre-pared plates detected all the isolates (n⫽8) with vancomycin MICs of 8g/ml and only one of four isolates with MICs of 4
g/ml. These findings are consistent with the findings of the present study.
Recently, Wootton et al. compared the results of three methods for their ability to differentiate
vancomycin-suscepti-ble isolates from VISA and heteroresistant VISA (hVISA) strains: the CLSI vancomycin agar screen method; an agar screen method that uses Mueller-Hinton agar containing 5
g/ml of teicoplanin; and the macro-Etest, a method that uses vancomycin and teicoplanin Etest strips on brain heart infusion agar seeded with an inoculum suspension equivalent to a 2.0 McFarland standard (10). These methods were compared to population analysis, which is considered the gold standard for the identification of hVISA. It is difficult to compare the results of their study with the results of our study because their strains were grouped by MIC categories that overlap the current CLSI criteria; i.e., vancomycin-intermediate strains were those for which the MICs wereⱖ8g/ml, heteroresistant strains were those for which the MICs were 1.5 to 4g/ml, and susceptible strains were those for which the MICs wereⱕ1 g/ml. The success of the macro-Etest method in that study was contingent upon the definition of a VISA isolate as one for which the vancomycin MIC wasⱖ8g/ml.
When the MIC results for a large number of organisms are close to the susceptible or intermediate breakpoint, as is true in this study, it is possible to have excellent essential agreement but relatively poor category agreement. Our data show that when the MICs range from 2 to 8g/ml, Etest, the MicroScan system, and the Phoenix system tended to give higher vanco-mycin MIC results than the broth microdilution reference method; agar dilution, the Sensititre system, and the Vitek 2 system tended to give results lower than those obtained by other methods, even though the essential agreement of all the methods was excellent (Table 2). When the organisms respon-sible for the category errors were retested on newer panels for the MicroScan, Phoenix, Sensititre, and Vitek 2 systems, cat-egory discrepancies continued to occur, despite the excellent essential agreement.
Recognition of intermediate vancomycin resistance among
S. aureusisolates can be medium dependent (8).When we used Mueller-Hinton broth from a different manufacturer with the broth microdilution reference method, the results yielded ap-proximately 5% minor errors (Table 3) compared to the results obtained with the gold standard broth. Although subtle differ-ences in the performance of the susceptibility testing methods could be because of differences in the media or the
concentra-TABLE 3. Comparison of two reference and six commercial susceptibility testing methods and discrepancies for categorization of 129S. aureusisolates compared with categorization by BMIC-Difco reference method
Method or system
No. (%)a
of isolates
categorized as: No. (%) of isolates with overall category agreement (n⫽129)
No. of discrepancies by test method
Susceptible (n⫽84)
Intermediate (n⫽45)
VISA categorized as susceptible
VISA categorized as resistant
Susceptible isolate categorized as
VISA
BMIC-BBL 83 (98.8) 40 (88.9) 123 (95.3) 5 1
Agar dilution 82 (97.6) 31 (68.9) 113 (87.6) 14 2
Etest 73 (86.9) 44 (97.8) 117 (90.7) 1 11
MicroScan 74 (88.1) 45 (100) 119 (92.2) 10
Phoenix 64 (76.2) 45 (100) 109 (84.5) 20
Sensititreb 84 (100) 29 (64.4) 113 (89.0) 13 1
Vitek Legacyc 83 (100) 0 (0) 83 (64.8) 35 10
Vitek 2 82 (97.6) 35 (77.8) 117 (90.7) 10 2
aThe percentage is based on 84 susceptible strains and 45 VISA strains.
[image:3.585.44.542.89.223.2]bThe final number of results was 127 (84 susceptible, 43 intermediate) because of insufficient growth of two isolates in the test panel. cThe final number of results was 128 (83 susceptible, 45 intermediate) because of insufficient growth of one isolate in the test panel.
TABLE 4. Dilution differences of five test methods compared with result by BMIC-Difco reference method for 43 isolates
demonstrating category discrepancies in the original study
Method or system
No. of results with dilution differencesaof:
%⫾1 dilutionb
No. of discrepancies by test method
⫺2 ⫺1 0 ⫹1 ⫹2
VISA categorized
as susceptible
Susceptible isolate categorized
as VISA
BMIC BBL 5 35 3 100 3 3
MicroScan 1 17 24 1 97.7 1 21
Phoenixc 1 8 28 3 97.5 5 2
Sensititrec 1 29 11 100 0 10
Vitek 2c 12 25 5 100 5 3
a⫺
2, result by the test method is 2 log2concentrations lower than the
BMIC-Difco MIC;⫺1, result by the test method is 1 log2concentration lower than the
BMIC-Difco MIC; 0, result by the test method is the same as that of the BMIC-Difco MIC;⫹1, result by the test method is 1 log2concentration greater
than the BMIC-Difco MIC;⫹2, result by the test method is 2 log2concentrations
greater than the BMIC-Difco MIC.
b
Essential agreement.
c
Three isolates failed to grow on the Phoenix panel, two isolates failed to grow on the Sensititre panel, and one isolate failed to grow on the Vitek 2 panel.
on May 16, 2020 by guest
http://jcm.asm.org/
[image:3.585.43.284.538.652.2]tions tested, such as the half intervals of the Etest, all the VISA isolates tested in our study (i.e., isolates with vancomycin MICs of 4 to 8g/ml with BMIC-Difco) produced MICs ofⱖ2g/ml by the other test methods. Therefore, to increase the rate of detection of VISA strains in the laboratory, the laboratory could consider testing allS. aureus isolates with vancomycin MICs of 2g/ml by an alternate method. Unfortunately, the vancomycin agar screen test was not very sensitive for detecting strains when the vancomycin MICs were 4g/ml. For the users
of automated systems, Etest may be a good alternative testing method because it detected 44 of 45 (97.8%) VISA isolates.
In a recent review, Appelbaum (1) suggested thatS. aureus
strains for which the vancomycin MICs are 1 or 2g/ml and that are isolated from patients who are failing vancomycin therapy with a glycopeptide should be investigated further. Some isolates with vancomycin MICs in this range have been identified as hav-ing vancomycin heteroresistance and have been associated with therapeutic failures (8). Although it is true that efforts to
[image:4.585.134.449.66.284.2]investi-FIG. 1. Scatterplot of vancomycin MICs (g/ml) determined by broth microdilution with BMIC-Difco compared with vancomycin MICs determined by disk diffusion (mm). CAMHB, cation-adjusted Mueller-Hinton broth.
FIG. 2. Scatterplot of vancomycin MICs (g/ml) determined by broth microdilution with BMIC-Difco compared with vancomycin MICs determined by Etest. CAMHB, cation-adjusted Mueller-Hinton broth.
on May 16, 2020 by guest
http://jcm.asm.org/
[image:4.585.110.473.456.702.2]gate these isolates further would likely identify more vancomycin-intermediate strains, most clinical laboratories are unaware of poor treatment outcomes that would trigger further investigation. Furthermore, given that the modal vancomycin MIC ofS. aureus
isolates in the United States is 1.0g/ml, as reported in several surveillance studies (5–7) and in additional data at the EUCAST website (http://www.eucast.org), testing of all strains with vanco-mycin MICs of 1.0 g/ml would be burdensome. Limiting of further testing by any of the test methods evaluated in the present study to strains with vancomycin MICs of 2g/ml may be more feasible.
In summary, with the exception of the Vitek Legacy system, the performance characteristics of all the MIC susceptibility testing methods, when they were measured by essential agreement, were excellent. However, the Phoenix system, Etest, and the Micro-Scan system tended to yield MIC results 1 dilution higher than those obtained by the broth reference method; and agar dilution, the Sensititre system, and the Vitek 2 system yielded results that were 1 dilution lower than those obtained by the broth reference method. The Vitek Legacy system gave no MIC results of 4 or 8
g/ml, and thus, it is difficult to compare the results obtained with the Vitek Legacy system with those obtained by the reference method. The disk diffusion test did not distinguish vancomycin-intermediate strains from vancomycin-susceptible strains, and the vancomycin agar screen lacked sensitivity for strains with MICs of 4g/ml. Clinical laboratories may enhance their ability to detect
S. aureus isolates with reduced susceptibility to vancomycin by performing further testing (e.g., by the vancomycin Etest) with isolates for which the MICs are 2g/ml with one of the commer-cial systems evaluated in the present study.
ACKNOWLEDGMENT
The use of trade names is for identification purposes only and does not constitute endorsement by the Public Health Service or the U.S. Department of Health and Human Services.
The findings and conclusions in this report are those of the authors and do not necessarily represent those of the Centers for Disease Control and Prevention.
REFERENCES
1.Appelbaum, P. C.2007. Reduced glycopeptide susceptibility in methicillin-resistantStaphylococcus aureus(MRSA). Int. J. Antimicrob. Agents30:398– 408.
2.Clinical and Laboratory Standards Institute.2006. Methods for dilution antimicrobial susceptibility tests for bacteria that grow aerobically; approved standard, 7th ed. CLSI document M7-A7. Clinical and Laboratory Standards Institute, Wayne, PA.
3.Clinical and Laboratory Standards Institute. 2006. Performance stan-dards for antimicrobial disk susceptibility tests; approved standard, 9th ed. CLSI document M2-A9. Clinical and Laboratory Standards Institute, Wayne, PA.
4.Clinical and Laboratory Standards Institute.2009. Performance standards for antimicrobial susceptibility testing: 19th informational supplement. CLSI document M100-S19, 19th ed. Clinical and Laboratory Standards Institute, Wayne, PA.
5.Jones, R., M. Stilwell, H. Sader, T. Fritsche, and B. P. Goldstein.2006. Spectrum and potency of dalbavancin tested against 3322 gram-positive cocci isolated in the United States Surveillance Program (2004). Diagn. Microbiol. Infect. Dis.53:149–153.
6.Rybak, M. J., E. Hershberger, T. Moldovan, and R. G. Grucz.2000. In vitro activities of daptomycin, vancomycin, linezolid, and quinupristin-dalfopristin against staphylococci and enterococci, including vancomycin-intermediate and -resistant strains. Antimicrob. Agents Chemother.44:1062–1066. 7.Streit, J., R. Jones, and H. Sader.2004. Daptomycin activity and spectrum:
a worldwide sample of 6737 clinical gram-positive organisms. J. Antimicrob. Chemother.53:669–674.
8.Tenover, F. C., M. V. Lancaster, B. C. Hill, C. D. Steward, S. A. Stocker, G. A. Hancock, C. M. O’Hara, N. C. Clark, and K. Hiramatsu.1998. Char-acterization of staphylococci with reduced susceptibility to vancomycin and other glycopeptides. J. Clin. Microbiol.36:1020–1027.
9.Tenover, F. C., and R. C. Moellering, Jr.2007. The rationale for revising the Clinical and Laboratory Standards Institute vancomycin minimal inhibitory concentration interpretive criteria forStaphylococcus aureus. Clin. Infect. Dis.44:1208–1215.
10.Wootton, M., A. P. MacGowan, T. R. Walsh, and R. A. Howe.2007. A multicenter study evaluating the current strategies for isolating Staphylococ-cus aureusstrains with reduced susceptibility to glycopeptides. J. Clin. Mi-crobiol.45:329–332.