Journal of Chemical and Pharmaceutical Research, 2015, 7(3):1164-1169
Research Article
CODEN(USA) : JCPRC5
ISSN : 0975-7384
A method of variables selection for soft sensor based on distributed
mutual information
Xia Yuan
1*, Huizhong Yang
1and Nam Sun Wang
21Key Laboratory of the Ministry of Education for Advanced Control in Light Industry Process, Jiangnan University,
China
2Department of Chemical & Biomolecular, University of Maryland, College Park, MD, 20742, US
____________________________________________________________________________________________
ABSTRACT
A method of distributed mutual information is proposed for selecting secondary variables in a soft sensor. The mutual information between the predicted primary variable and the secondary variables is obtained by estimating the probability distribution of every secondary variable and the predicted variable. This information indirectly reflects the linear or nonlinear correlations between the predicted variable and the secondary variables. A threshold value is obtained by t-test approach as a criterion to judge the correlation of variables. Subsequently, the variables whose mutual information is greater than the threshold value are further screened to be selected as the relevant variables or to be discarded as weakly relevant variables. Finally, a soft sensor model is built based on the support vector machine algorithm with the selected secondary variables.
Key words: Soft sensor modeling; distributed; mutual information; support vector machine
_____________________________________________________________________________________________
INTRODUCTION
Data-driven soft sensors have been developed and implementedfor a long time. They gained on popularity with the increasing availabilityof recorded data in the process industries and availabilityof computational power to process the data. The collected data,also referred to as historical data, can be exploited by statisticaland machine learning techniques to obtain additional informationthat can be used to make decisions towards more efficient andsafe process operation. This kind of information can, for instance,be an instant prediction of the variables that are related to theproduct quality, which can be achieved using online predictionsoft sensors, or the estimation of current process state, which can beachieved using process monitoring and fault detection soft sensors[1-2]. However,this task is not trivial because historical data are often data richbut information poor (Dong &McAvoy, 1996) and therefore themodel building on its basis is a challenging task.
A prominent issue in the process industry is the accurate online measurement of important quality parameters to ensure product quality, smooth continuous unit operation, and maximum production capacity. As production processes involve a large number of complex physical interactions, chemical reactions, and conversion and transfer of materials and energy, existing hardware cannot directly yield accurate on-line measurement of quality parameters. Instead, soft measurement technique estimates primary variables indirectly by mapping the relationship between readily measured variables and the primary variables that cannot be directly measured according to a set of optimization rules.
The first step in the implementation of soft measurement technology is the selection of auxiliary variables. The auxiliary variables are selected mainly based on sensitivity, accuracy, specificity, and robustness. The impor1tance of variable selection has been mentioned in the literature [5-6]. A well-selected set of auxiliary variables can effectively overcome the dimensionality problem and improve the model’s validity. One way to select auxiliary variables is to identify a set of measurable auxiliary variables that affect primary variables based on a mechanistic analysis. An alternative way is based on a statistical analysis of the correlation in the sample data to exclude irrelevant variables. Variable selection methods based on PLS and PCA have been reported in the literature [7]. Other variable selection methods are based on mutual informationcalculated indirectly from the entropy and conditional entropy [8]. Another approach estimates joint probability density function (multi-dimensional Gaussian distribution) to determine the input variables of a neural network according to mutual information[9].
In this paper, the number of auxiliary variables is determined by mutual information. An example of estimating the concentration of phenol with a soft sensor model illustrates how to calculate the mutual information between auxiliary variables and primary variables from a set of samples. Subsequently, a threshold is determined by the t-test method for judging the correlation between the primary variable and every auxiliary variable[10-11], and the variables meeting the threshold criterion areselected. Finally, a soft sensor model of phenol is refined by removing redundant variables.
MUTUALINFORMATIONAND T-TEST
Mutual information is defined as the amount of information of a random variable that is contained in another random variable. The mutual information of variables between X and Y is definedas[12]:
(
)
( )
( ) ( )
( )
dxdy
y
m
x
m
y
x
m
y
x
m
Y
X
I
Y X,
log
,
;
=
∫∫
(1)where
m ,
( )
x
y
describes the joint probability density of X and Y, andm
X( )
x
andm
Y( )
y
respectively describe the marginal probability density of X and Y. A high value of the mutual information means variable Y contains more information on variable X, thus, a greater correlation between the two variables. Therefore,mutual information can be used to select auxiliary variables in a soft senor.In the case of unknown variance
σ
2, estimation and hypothesis testing for the mean value of a normal population is commonly carried out with t-statistic.(Assumethe sampleI
~
N
( ,
µ σ
2)
(for mean valueµ
and variance2
σ
),thesample[ ,
I I
1 2,...,
I
n]
of general statistic, the statistics~ (
1)
/
I
T
t n
S
n
m
-=
-
is constructed with the meanvalue
I
and variance 2S .Given the problem
H
0:
m
=
I
0,
H
1:
m
≠
I
0(whereI
0describes the correlation between the primary variable and other random variables) and under the testlevela
, the probability of an unlikely event is givenby
t
(
n
)
a
n
S
m
I
P
a=
−
≥
−
1
/
2and the rejection domain is
(
)
(
)
+∞ − ∪ − − ∞
− , 1 1 ,
2 2
n t n
ta a . The
hypothesis is rejected when the statistics value belongs to the rejection domain; otherwise, the hypothesis is accepted.
Since t-test is used here to find the maximum mean value
I
0 maxof mutual information for accepting the nullhypothesis[13], this is a recursive process forH
0.Assume the mutual information between the primary variable
1
and a set of normally distributed random variables is
I
i. Tests are randomly repeated n times, the mean value andvariance of correlation are
∑
=
=
n i iI
I
1and
∑
(
)
=
−
−
=
n i iI
I
n
S
1 2 21
1
.Given a test levelα
,/ 2
( )
t
αn
can be foundfrom a table. Finally
2 0 max
+
/ 2( )
/
I
=
I t
an
S
n
(2)
is obtained from the formula 0 max / 2 2
|
|
( )
S /
I
I
t
n
n
a-=
.I
0 maxinitiallyreflects the highest mutual information betweenthe primary variable and unrelated variables. In order to ensure certain redundancy, the threshold
δ
1(d =
1d I
1 0 max) is determined finally,d
1∈
[1.0,1.1]
.VARIABLE SELECTION ALGORITHM OF DISTRIBUTED MUTUALINFORMATION
John et al. divide input space into three categories, i.e., strongly relevant variables, weakly relevant variables, and irrelevantvariables[14]. The optimal variable subset should not contain irrelevant variables. Because inclusion of weakly relevant variables leads to variable redundancy, the optimal variable subset should contain only strongly relevant variables but exclude weakly relevant variables and irrelevant variables.
Considering the correlation between input variable X and output variable Y, the mutual informationI(X;Y) ofvariables X and Y represents the amount of information that Y contains. If the input variable
X
imeets:(
X
;
Y
)
≥
δ
1I
i (3)where
δ
1 is a correlation threshold. It indicates thatX
icontains a certain amount of information of Y, i.e.,X
i is a relevant variable of Y. If the input variableX
idoes not meet the above formula (3), the variableX
i contains only negligible information on Y or none at all, andX
i is regarded as an irrelevant variable and is excluded. Thus, the variable subset F consists of both strongly relevant variables and weakly relevant variables that satisfyEqn 3.It is necessary that the subset F is further screened because there may exit redundancy in the weakly relevant variables. Redundant variables should be eliminated from the subset F to maintain the correlation between the subset F and output variable Y.Mutual information refers to the correlation between two sets of events, and it is difficult to estimate mutual information in a high dimensional case. In order to simplify calculation, a subset of variables is replaced by a single variable to measure the redundancy between a subset of variables and output variable Y. This article draws lessons from the algorithm of min-redundancy max-relevance (MRMR) [15], which uses the mean value of mutual information to evaluate the degree of redundancy. In other words, the mutual information between the output Y and the subset F,I(F;Y), is evaluated as the mean value of the mutual information between Y and each of the element of the subset F, as shown in the following equation :
(
)
∑
⊂=
F F i iY
F
I
F
Y
F
I
(
;
)
1
;
(4)where
F
i is an element of the subset F.In this paper, redundant variables are removed via a backward method. When deleting an input variable
X
i, if the mutual information between the output Y and subset F meets the redundancy constraints given inEqn (5),X
iis a redundant variable; otherwise, it is a relevant variable.(
F
Y
) (
I
F
X
Y
)
I
(
F
Y
)
I
;
−
−
i;
<
δ
2;
(5)where
δ
2is a given threshold of redundancy,δ
2∈
[ ]
0
,
1
The specific steps in the variable selection algorithm of distributed mutual information are as follows: 1) The mutual information of variables
I X Y i
i( ; ), 1,2,3,..., .
i=
n
can be calculated from Eqn (1).2)
I
0maxisobtained from Eqn (2) based on t-test. Pick a relevance thresholdδ
1and select all input variablesX
ivalues of mutual information to structure the subset F.LetM=F.
3) The mutual information between a subset of the remaining input variables and the output variable,
(
M
M
Y
)
I
−
i;
,is calculated by Eqn (4)after each variableM
i(
i
=
1
,
2
,...,
m
)
is removed in turn. 4) The variableM
imeets Eqn (5), it is redundant and excluded; otherwise,M
iis retained.5) Repeat Steps 3) and 4) until each variable has been removed in turn. Then the algorithm stops.
There are two adjustable parameters in the above algorithm, the relevance threshold
δ
1and the redundancy thresholdδ
2.δ
1is determined byI
0maxwhich is obtained from the t-test. The higher theδ
1value is, the higher the requirement of the correlation between variables, and subsequently a less number of variablesis selected in the first step. The higher theδ
2value is,the higher the requirement of redundancy of variables selected, and subsequently a less number of the variables in the optimal subset M.Casestudy
The example is taken from a BisphenolA(BPA)plant where a soft sensor estimates on-line the concentration of phenol in a crystallizer tower C303. The material exiting melting pot V304 is recycled back to crystallizer tower C303 for crystallizing again. The six auxiliary variables determined through an initial analysis are the three physically measured variables (temperature, level, and mass flow of crystal tower C303) and the three estimated variables (concentration of phenol and BPA in the V304 outlet and concentration of BPA-24 in the C303 outlet). Finally the concentration of phenol in C303 is estimated with a Support Vector Machine(SVM) model. In order to select the auxiliary variables related to the primary variable (the concentration of phenol in crystallizer unit C303), 150 groups of data were retrieved from the production site, with 100 groups as the model training set and the rest as the test set. The relevance and redundancy between the primary variable and auxiliary variables in the training data set were analyzed with the proposed method of distributed mutual information. A support vector machine model was established with the optimal subset of measurements and verified with the test data set.
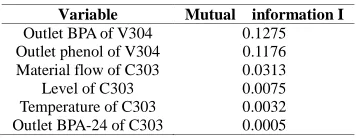
[image:4.595.217.395.448.517.2]The mutual information of each auxiliary variable and the primary variable is shown in Table 1. The mutual information in a descending order is: output BPA of V304> output phenol of V304> material flow of C303> level of C303> temperature of C303> output BPA-24 of C303.
Table 1.Mutual information between auxiliary variables and phenol Variable Mutual information I
Outlet BPA of V304 0.1275
Outlet phenol of V304 0.1176
Material flow of C303 0.0313
Level of C303 0.0075
Temperature of C303 0.0032
Outlet BPA-24 of C303 0.0005
First, it is necessary to determine a threshold for selecting variables of relevance. In order to determine the critical value of rejection domain where the relevance of the primary variable and auxiliary variables falls, a group of random sample set following a normal distribution between 0-1 is generated with a computer. The mutual information between the primary variable and them is calculated, and the process is repeated 30 times to obtain the sample set for the t-test. Subsequently, according to the t-test,
t
0.025(
n
−
1
)
=
t
0.02529
=
2
.
0452
is obtained fromthe table for hypothesis testing (30 times at testlevel
a =
0.05
). Based on Eqn(2),I =
0.0288
and0 max
0.0291
I
=
was calculated. The threshold coefficientd
1is determined as1.05 andδ
1as 0.0306. After aninitially screening, outlet phenol and BPA ofV304 and material flow of C303 are retained. Finally, taking
δ
2=
0
.
4
ensures a higher requirement of redundancy in order to eliminate redundant variables, and outlet BPA and phenol of V304 are retained according to thejudgment formula of redundancy condition (5). The mean relative error of training and testing are got by the simulation of support vector machine model after deleting variables. Assuming the actual value isy
and the estimated value isy′
, MRE is defined as:%
100
1
1
×
′
−
=
∑
= N
i
y
y
y
N
MRE
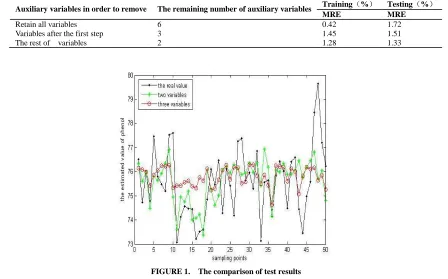
The above table indicates that the most auxiliary variables lead to the highest training accuracy but the worst testing accuracy.After the first screening step, the auxiliary variables are outlet BPA of V304, outlet phenol of V304, and mass flow of C303, and the testing accuracy of the model improved. After the redundancy step, only outlet phenol of V304 and outlet BPA of V304 are retained, and the testing error is the least.Therefore, retaining more auxiliary variables increases modelcomplexity but cannot improve testing accuracy. Considering both relevanceand redundancy between auxiliary variables and the primary variable lowers the final testing error. An analysis of the process indicates that each component of C303 has been relatively stable; therefore, the concentration of phenol mainly depends on the components of V304. Applying our method of variable selection for soft sensor based on distributedmutual information led to retaining the outlet phenol of V304 and outlet BPA of V304, which in turn yielded more accurate estimation of phenol in C303. The test results are shown in Figure 1.
Table 2.Training and testing after deleting variables
Auxiliary variables in order to remove The remaining number of auxiliary variables Training(%) Testing(%)
MRE MRE
Retain all variables 6 0.42 1.72
Variables after the first step 3 1.45 1.51
[image:5.595.80.528.219.498.2]The rest of variables 2 1.28 1.33
FIGURE 1. The comparison of test results
.
CONCLUSION
The method of variable selection for soft sensor based on distributed mutual information has some advantages, well reflecting linear or nonlinear relevance and redundancy between the primary variable and auxiliary variables. The simulation results show that this method effectively eliminates irrelevant and redundant variables, reduces model complexity, and improves the estimation accuracy and generalization capability of the model.
REFERENCES
[1]Fortuna, L., Graziani, S., &Xibilia, M. IEEEInstrumentation & Measurement Magazine,2005, 8(4), 26–34. [2]Fortuna, L., Graziani, S., & Xibilia, M. G. Control Engineering Practice,2005, 13(4),499–508.
[3]Qin, S. J. Computersand Chemical Engineering,1998, 22(4–5), 503–514.
[4]Raennar, S., MacGregor, J. F., & Wold, S. Chemometrics and Intelligent Laboratory Systems,1998, 41(1), 73–81. [5]Q. X. Zhu and N. Lang, Control Engineering, 2011, 18(3): 0388-0392. (In Chinese)
[6]X. Z. Wang, Control and Decision, 2010, 25(10): 1589-1592. (In Chinese)
[7]R. L. Liu, W. Q. Chen, H. Y. Su, Journal of Nanjing University of Posts and Telecommunications, 2006, 26(1): 76-79. (In Chinese)
[8]C F Tsai, Expert Systems with Application, 2006, 31(4): 808-825.
[9]B. Pang, X. Sun, Ch.W. Ye, K.J. Chen, Computer Modelling and New Technologies, 2013, 17(3), 87–92 [10]L. Kang, G. Qian, Computer Modelling and New Technologies, 2013, 17(3), 20–26
[11]A Sharma, Journal of Hydrology, 2000, 239(1-4): 232~239.
International Conference on Artificial Intelligence and Statistics. Florida, USA: JMLR, 2009.49−56 .
[13]H. Z. Yang, J. Zhang, H. F. Tao, Control Engineering, 2012, 19(4): 0562-0565. (In Chinese) [14]A B Barrett, L Barnett, A K Seth. Physical Review E, 2010,81(4): 041907J