IN VIVO QUANTIFICATION OF THE
FUNCTIONAL CHARACTERISTICS OF THE
REARFOOT COMPLEX
CHRISTOPHER J. NESTER
Institute for Health Research
Department of Rehabilitation
University of Salford, Salford, UK
Page
LIST OF FIGURES viii
LIST OF TABLES xiv
ACKNOWLEDGEMENTS xxi
DECLARATION xxii
NOMENCLATURE xxiii
ABSTRACT xxiv
CHAPTER 1 INTRODUCTION 1
CHAPTER 2 REVIEW OF THE REARFOOT COMPLEX
2.1 INTRODUCTION 5
2.2 REVIEW OF THE INDIVIDUAL JOINTS OF
THE REARFOOT 5
2.2.1 THE ANKLE JOINT 5
2.2.1.1 Motion at the anlde joint 6
2.2.2 THE SUB TALAR JOINT 13
2.2.2.1 Motion at the sub talar joint 14
2.2.3 THE MID TARSAL JOINT 22
2.2.3.1 Motion at the mid tarsal joint 22
2.3 THE REARFOOT COMPLEX 31
2.3.1 REARFOOT COMPLEX MOTION 31
2.3.2 RATIONALE FOR THE REARFOOT
COMPLEX 32
2.3.2.1 All three rearfoot joints are required for
the rearfoot to perform its primary
function 33
2.3.2.2 The motions in the complex are
interdependent 34
2.3.2.3 The pattern of interdependent motion is
2.3.3 DEVELOPING A CONCEPTUAL MODEL OF
THE REARFOOT COMPLEX 42
2.3.4 PREVIOUS ATTEMPTS TO QUANTIFY THE
FUNCTIONAL CHARACTERISTICS OF THE
REARFOOT COMPLEX 46
2.3.5 SUMMARY 54
CHAPTER 3 AIM OF INVESTIGATION AND
METHODOLOGY
3.1 AIM OF INVESTIGATION 57
3.2 METHODOLOGY 59
3.2.1 OVERVIEW OF METHODOLOGY 59
3.2.2 DATA COLLECTION 61
3.2.2.1 Static rearfoot complex assessment 63
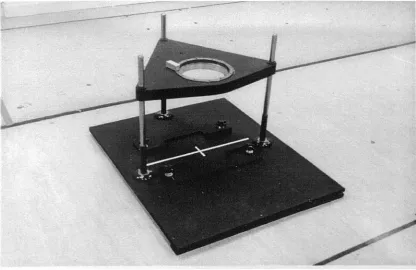
3.2.2.1.1 Experimental rig 63
3.2.2.1.2 Describing the navicular and
cuboid, the heel and the leg 71
3.2.2.1.3 Three dimensional motion
analysis system 75
3.2.2.1.4 Performance of the motion
analysis system 78
3.2.2.1.5 Experimental procedure for
static rearfoot complex
assessment 82
3.2.2.2 Dynamic rearfoot complex assessment 87
3.2.2.2.1 Experimental procedure for
assessment 91
3.2.3 DATA PROCESSING 92
3.2.3.1 Calculation of angular rotations from
static rearfoot complex data 92
3.2.3.2 Calculation of angular rotations from
dynamic rearfoot complex data 98
3.2.4 EXTRACTION OF RELEVANT ANGULAR DATA FROM STATIC REARFOOT
COMPLEX ASSESSMENT 101
3.2.4.1 Standardisation of angular rotations 106
3.2.4.2 Data reduction 109
3.2.5 CALCULATION OF THE AXIS OF
ROTATION FROM STATIC REARFOOT
COMPLEX DATA 115
3.2.5.1 Validation of axis calculations. 122
3.2.6 SUMMARY OF FINAL DATA CALCULATED 125
CHAPTER 4 RESULTS
4.1 INTRODUCTION 127
4.2 DYNAMIC REARFOOT COMPLEX 127
ASSESSMENT
4.3 STATIC REARFOOT COMPLEX 133
ASSESSMENT
4.3.1 REPEATATBILITY OF STATIC REARFOOT
COMPLEX ASSESSMENT 164
4.3.2 COMPARISON OF THE FOUR PHASES OF
CHAPTER 5 DISCUSSION
5.1 INTRODUCTION 172
5.2 DYNAMIC REARFOOT COMPLEX
ASSESSMENT 172
5.3 STATIC REARFOOT COMPLEX
ASSESSMENT 174
5.3.1 REPEATABILITY OF THE STATIC
REARFOOT COMPLEX ASSESSMENT 174
5.3.1.1 Comparison with the literature 179
5.3.2 ABSOLUTE ROTATION OF THE LEG 184
5.3.2.1 Summary of absolute rotation of the
leg. 189
5.3.3 ABSOLUTE ROTATION OF THE HEEL 190
5.3.3.1 Composite phase - ranges of motion 190
5.3.3.2 Dynamic phase - ranges of motion 192
5.3.3.3 Supination phase —ranges of motion 193
5.3.3.4 Pronation phase — ranges of motion 194
5.3.3.5 Axis of rotation 196
5.3.3.6 Comparison of phases 197
5.3.3.7 Summary of absolute rotations of the
heel. 198
5.3.4 ABSOLUTE ROTATION OF THE FOREFOOT 200
5.3.4.1 Composite phase - ranges of motion 200
5.3.4.2 Dynamic phase - ranges of motion 201
5.3.4.3 Supination phase — ranges of motion 202
5.3.4.5
Axis of rotation 2055.3.4.6
Comparison of phases 2065.3.4.7
Summary of absolute rotations of theforefoot. 207
5.3.5
RELATIVE ROTATION OF THE ANKLE/SUBTALAR COMPLEX 208
5.3.5.1
Composite phase - ranges of motion 2085.3.5.2
Dynamic phase - ranges of motion 2125.3.5.3
Supination phase — ranges of motion 2135.3.5.4
Pronation phase — ranges of motion 2145.3.5.5
Axis of rotation 2145.3.5.6
Comparison of phases 2195.3.5.7
Summary of relative rotations of theankle/sub talar complex. 222
5.3.6
RELATIVE ROTATION OF THE MIDTARSAL JOINT 224
5.3.6.1
Composite phase - ranges of motion 2245.3.6.2
Dynamic phase - ranges of motion 2265.3.6.3
Supination phase ranges of motion 2275.3.6.4
Pronation phase — ranges of motion 2295.3.6.5
Axis of rotation 2305.3.6.6
Comparison of phases 2365.3.6.7
Summary of relative rotations of themid tarsal joint. 238
5.3.7
RELATIVE ROTATION OF THE REARFOOTCOMPLEX 239
5.3.7.1
Composite phase - ranges of motion 2395.3.7.2
Dynamic phase - ranges of motion 2415.3.7.3
Supination phase — ranges of motion 2415.3.7.5 Axis of rotation 242
5.3.7.6 Comparison of phases 243
5.3.7.7 Contribution of the ankle/sub talar
complex and mid tarsal joint to the functional characteristics of the rearfoot
complex. 245
5.3.7.8 Summary of relative rotations of the
rearfoot complex. 247
CHAPTER 6
5.3.8 SUMMARY OF THE DIFFERENCES
BETWEEN THE COMPOSITE, DYNAMIC, SUPINATION AND PRONATION PHASES OF
MOTION. 249
5.3.9 SUMMARY OF THE INDIVIDUAL VARIATIONS IN THE FUNCTIONAL
CHARACTERISTICS OF THE REARFOOT. 251
5.4 THE REARFOOT COMPLEX KINEMATIC
CHAIN. 257
5.4.1 MOTION PATTERN. 257
5.4.2 AXES OF ROTATION. 260
5.5 LIMITATIONS OF THIS WORK. 261
5.6 INNOVATIONS OF THIS WORK 265
CONCLUSIONS AND FUTURE WORK
6.1 CONCLUSIONS. 269
REFERENCES 276
APPENDIX 1
283
APPENDIX 2
LIST OF FIGURES Page
Chapter 2 2.1 Transverse, frontal and sagittal plane views of the axes of
rotation for the anlde joint calculated by Van Langelaan
(1983). 9
2.2 Transverse and frontal plane views of the axes of rotation of
the ankle joint calculated by Lundberg et al (1989a) 11
2.3 The variation described in the literature in the angulation of
the axis of rotation of the sub talar joint. 17
2.4 Transverse, frontal and sagittal plane views of the axes of rotation of the sub talar joint calculated by Van Langelaan
(1983). 19
2.5 The conceptual oblique and longitudinal axes of rotation of
the mid tarsal joint (from Manter 1941). 24
2.6 Transverse, frontal and sagittal plane views of the axes of rotation of the talonavicular joint calculated by Van
Langelaan (1983). 26
2.7 Transverse, frontal and sagittal plane views of the axes of rotation of the calcaneocuboid joint calculated by Van
Langelaan (1983). 27
2.8 Illustration of the motion of the talus at the ankle between
heel strike and forefoot loading. 38
2.9 Motion of a metal bead in the calcaneus during transverse
plane rotation of the leg. From Benick (1985). 40
2.10 Axes of rotation of the sub talar joint calculated during transverse plane rotation of the leg. From Benick (1985) 41 2.11 Measurement of frontal plane rearfoot complex motion by
Downing et al (1978). 49
Chapter 3 3.1 Experimental rig used in the static rearfoot complex
assessment. 64
3.3 Sagittal plane alignment of the leg in the experimental rig. 67 3.4 Frontal plane alignment of the leg in the experimental rig. 68
3.5 Global co-ordinate system. 69
3.6 Alignment of anatomical sagittal plane with the sagittal
plane of global co-ordinate system. 70
3.7 Hexalite platform and markers on the forefoot segment. 73
3.8 Hexalite platform and markers on the heel segment. 74
3,9 Hexalite platform and markers on the leg segment. 75
3.10 Arrangement of the four MacReflex cameras around the
experimental rig. 76
3.11 Positioning of the calibration frame within the experimental
rig. 77
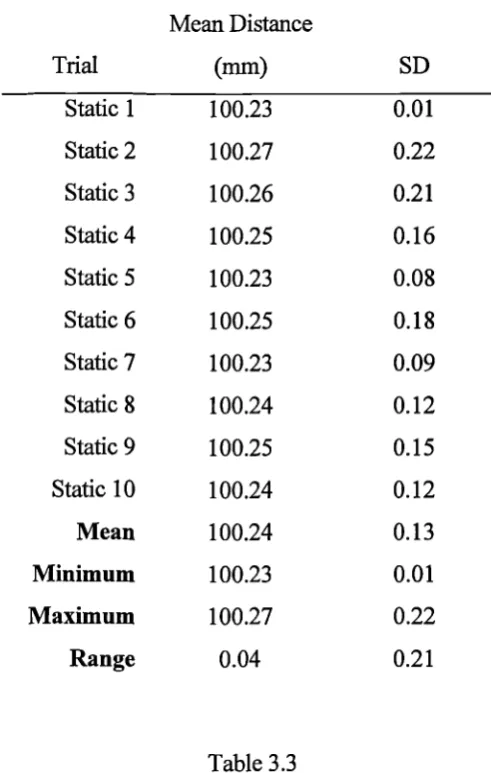
3.12 Results of one static and one dynamic test of the accuracy of
the MacReflex system. 81
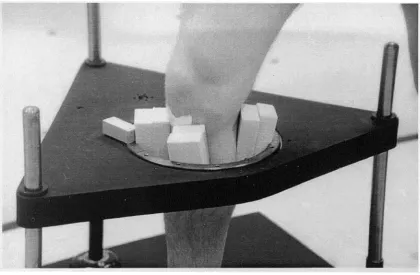
3.13 Starting position of the subjects in the static rearfoot
complex assessment. 84
3.14 Position of maximum internal leg rotation during the static
rearfoot complex assessment. 85
3.15 Relaxed standing position of the subjects in the static
rearfoot complex assessment. 86
3.16 Thirteen marker system used in the dynamic rearfoot
complex assessment. 88
3.17 Arrangement of cameras in the dynamic rearfoot complex
assessment. 90
3.18 Mean error in kinematic data due to interpolation. 93
3.19 Comparison of raw and filtered data. 94
3.20 Variation in the range of motion at the rearfoot complex
across ten separate trials. 97
3.21 Variation in the range of motion of the forefoot across ten
separate trials. 98
3.22 Definition of local of-ordinate system and position vector
from dynamic rearfoot complex assessment data. 100
complex assessment. 102 3.24 Stages of processing the static rearfoot complex assessment
data. 105
3.25 Orientation of the foot reference systems in relation to the
global co-ordinate system. 107
3.26 Motion of the left leg of subject 11 in the cardinal body planes during internal and external rotation of the leg. 112 3.27 Motion of the left heel of subject 11 in the cardinal body
planes during internal and external rotation of the leg. 112
3.28 Motion of the left forefoot of subject 11 in the cardinal body planes during internal and external rotation of the leg. 113 3.29 Motion of the left ankle/sub talar complex of subject 11 in
the cardinal body planes during internal and external rotation
of the leg. 113
3.30 Motion of the left mid tarsal joint of subject 11 in the cardinal body planes during internal and external rotation of
the leg. 114
3.31 Motion of the left rearfoot complex of subject 11 in the cardinal body planes during internal and external rotation of
the leg. 114
3.32 Relationship between the global co-ordinate system, the anatomical body planes and the calculated axes of rotation. 117 3.33 Calculation of the angle between the axis of rotation and the
sagittal plane. 119
3.34 Calculation of the angle between the axis of rotation and the
transverse plane. 121
Chapter 4 4.1 Mean transverse plane angular rotation of the leg relative to
the foot during normal walking (mean of the sample). 128
4.2 Total range of transverse plane motion of the leg relative to
the foot for each individual subject. 131
subject 2 during dynamic rearfoot complex assessment. 132
4.4 Mean axes of rotation of the leg (composite phase). 140
4.5 Mean axes of rotation of the heel (composite phase). 141
4.6 Mean axes of rotation of the forefoot (composite phase). 142
4.7 Mean axes of rotation of the anlde/sub talar complex
(composite phase). 143
4.8 Mean axes of rotation of the mid tarsal joint (composite
phase). 144
4.9 Mean axes of rotation of the rearfoot complex (composite
phase). 145
4.10 Range of leg motion in the cardinal body planes — for each
subject (composite phase). 147
4.11 Range of heel motion in the cardinal body planes — for each
subject (composite phase). 148
4.12 Range of forefoot motion in the cardinal body planes — for
each subject (composite phase). 149
4.13 Range of ankle/sub talar complex motion in the cardinal
body planes — for each subject (composite phase). 150
4.14 Range of mid tarsal joint motion in the cardinal body planes
— for each subject (composite phase). 151
4.15 Range of rearfoot complex motion in the cardinal body
planes — for each subject (composite phase). 152
4.16 Angulation of the axes of rotation of the leg for each subject
(composite phase). 154
4.17 Angulation of the axes of rotation of the heel for each
subject (composite phase). 155
4.18 Angulation of the axes of rotation of the forefoot for each
subject (composite phase). 156
4.19 Angulation of the axes of rotation of the ankle/sub talar
complex for each subject (composite phase). 157
4.20 Angulation of the axes of rotation of the mid tarsal joint for
each subject (composite phase). 158
for each subject (composite phase). 159 4.22 Ratio of frontal, transverse and sagittal plane motion at the
anlde/sub talar complex, each individual subject (composite
phase). 161
4.23 Ratio of frontal, transverse and sagittal plane motion at the mid tarsal joint, each individual subject (composite phase). 162 4.24 Ratio of frontal, transverse and sagittal plane motion at the
rearfoot complex, each individual subject (composite phase). 163 4.25 Mean ratio of frontal, transverse and sagittal plane motion —
left anlde/sub talar complex, in each phase of motion. 168
4.26 Mean ratio of frontal, transverse and sagittal plane motion —
right ankle/sub talar complex, in each phase of motion. 168
4.27 Mean ratio of frontal, transverse and sagittal plane motion —
left mid tarsal joint, in each phase of motion. 169
4.28 Mean ratio of frontal, transverse and sagittal plane motion —
right mid tarsal joint, in each phase of motion. 169
4.29 Mean ratio of frontal, transverse and sagittal plane motion —
left rearfoot complex, in each phase of motion. 170
4.30 Mean ratio of frontal, transverse and sagittal plane motion —
right rearfoot complex, in each phase of motion. 170
Chapter 5 5.1 Relationship between the range of motion at a planar joint
and the error in the calculated position of the centre of
rotation. From Panjabi and Goel (1982). 181
5.2 Difference in the ratio of transverse to frontal plane ankle/sub talar complex motion between the supination and
pronation phases — left limb. 220
5.3 Orientation of the axes of rotation for the mid tarsal joint calculated in this study compared to the talonavicular and calcaneocuboid axes of rotation from Van Langelaan (1983). 233 5.4 Orientation of the axes of rotation for the mid tarsal joint
rotation. 235 5.5 Difference in the ratio of transverse to frontal plane mid
tarsal joint motion between the supination and pronation
phases — left limb. 237
5.6 Difference in the ratio of transverse to frontal plane rearfoot complex motion between the supination and pronation
phases — left limb. 244
5.7 Ratio of transverse to frontal plane motion at the mid tarsal
joint during the composite phase. 253
5.8 Ratio of frontal, transverse and sagittal plane motion for 5
subjects — ankle/sub talar complex 256
5.9 Ratio of frontal, transverse and sagittal plane motion for 5
LIST OF TABLES Page
Chapter 2 2.1 Table of the ratio of transverse to frontal plane rearfoot
motion. From Bowden and Bowker (1995) 52
Chapter 3 3.1 Details of the 25 subjects investigated. 62
3.2 Mean distance between two markers measured using four
MacReflex cameras - dynamic tests. 79
3.3 Mean distance between two markers measured using four
MacReflex cameras - static tests. 80
3.4 Relationship between the direction of motion around the axes of the global co-ordinate system and the direction of motion
around the axes of the foot reference systems. 109
3.5 Difference in the ranges of motion and orientation of the axes of rotation during rotation of the leg in two different
directions. 111
3.6 Angle between the axis of rotation and the transverse and
sagittal planes calculated from false data. 122
3.7 Range of motion in cardinal body planes calculated from
known axis orientation 124
Chapter 4 4.1 Values of Angl, Ang2 and the total range of rearfoot complex
motion during the dynamic rearfoot complex assessment. 130
4.2 Explanation of the relationship between the positive/negative property of the angular values in the static rearfoot complex
assessment and the direction of motion. 134
4.3 Mean data for the absolute rotation of the right leg. 136
4.4 Mean data for the absolute rotation of the right heel. 136
4.5 Mean data for the absolute rotation of the right forefoot. 136
4.6 Mean data for the relative rotation of the right anlde/sub talar
complex. 137
4.8 Mean data for the relative rotation of the right rearfoot
complex. 137
4.9 Mean data for the absolute rotation of the left leg. 138
4.10 Mean data for the absolute rotation of the left heel. 138
4.11 Mean data for the absolute rotation of the left forefoot. 138
4.12 Mean data for the relative rotation of the left anlde/sub talar
complex. 139
4.13 Mean data for the relative rotation of the left mid tarsal joint. 139 4.14 Mean data for the relative rotation of the left rearfoot
complex. 139
4.15 Mean difference between days in the range of motion and axis
orientations (right limb). 166
4.16 Mean difference between days in the range of motion and axis
orientations (left limb). 166
Chapter 5 5.1 Mean difference between days in the ranges of motion and
axes of rotation. 177
5.2 Relationship between the range of motion and the error in the calculated orientation of the axis of rotation (Data from Van
Langelaan 1983). 180
5.3 Difference between the range of motion measured during the dynamic rearfoot complex assessment and the range of motion used to define the dynamic phase in the static assessment. 187 5.4 The primary order of predominance and other orders of
predominance displayed for the motion of the heel. 190
5.5 The primary order of predominance and other orders of
predominance displayed for the motion of the forefoot. 200
5.6 The primary order of predominance and other orders of predominance displayed for the motion of the anlde/sub talar
complex. 208
5.7 Variations in the order of predominance at the mid tarsal joint
(composite phase). 224
(dynamic phase). 226 5.9 Variations in the order of predominance at the mid tarsal joint
(supination phase). 228
5.10 Variations in the order of predominance at the mid tarsal joint
(pronation phase). 229
5.11 The primary order of predominance and other orders of predominance displayed for the motion of the rearfoot
complex. 239
5.12 Contribution of the ankle/sub talar complex and mid tarsal
joint to the characteristics of the rearfoot complex (right limb). 245 5.13 Contribution of the ankle/sub talar complex and mid tarsal
joint to the characteristics of the rearfoot complex (left limb). 246
Appendix 1 A1.1 Data for the right leg of subjects 1-5. 284
A1.2 Data for the right leg of subjects 6-10. 285
A1.3 Data for the right leg of subjects 11-15. 286
A1.4 Data for the right leg of subjects 16-20. 287
A1.5 Data for the right leg of subjects 21-25. 288
A1.6 Mean data for the right leg. 289
A1.7 Minimum, maximum and range of values in the right leg data. 290
A1.8 Data for the right heel of subjects 1-5. 291
A1.9 Data for the right heel of subjects 6-10. 292
A1.10 Data for the right heel of subjects 11-15. 293
A1.11 Data for the right heel of subjects 16-20. 294
A1.12 Data for the right heel of subjects 21-25. 295
A1.13 Mean data for the right heel. 296
A1.14 Minimum, maximum and range of values in the right heel
data. 297
A1.15 Data for the right forefoot of subjects 1-5. 298
A1.17 Data for the right forefoot of subjects 11-15. 300
A1.18 Data for the right forefoot of subjects 16-20. 301
A1.19 Data for the right forefoot of subjects 21-25. 302
A1.20 Mean data for the right forefoot. 303
A1.21 Minimum, maximum and range of values in the right forefoot
data. 304
A1.22 Data for the right anlde/sub talar complex of subjects 1-5. 305 A1.23 Data for the right anlde/sub talar complex of subjects 6-10. 306 A1.24 Data for the right anlde/sub talar complex of subjects 11-15. 307 A1.25 Data for the right ankle/sub talar complex of subjects 16-20. 308 A1.26 Data for the right anlde/sub talar complex of subjects 21-25. 309
A1.27 Mean data for the right ankle/sub talar complex. 310
A1.28 Minimum, maximum and range of values in the right
ankle/sub talar complex data. 311
A1.29 Data for the right mid tarsal joint of subjects 1-5. 312
A1.30 Data for the right mid tarsal joint of subjects 6-10. 313
A1.31 Data for the right mid tarsal joint of subjects 11-15. 314
A1.32 Data for the right mid tarsal joint of subjects 16-20. 315
A1.33 Data for the right mid tarsal joint of subjects 21-25. 316
A1.34 Mean data for the right mid tarsal joint. 317
A1.35 Minimum, maximum and range of values in the right mid
tarsal joint data. 318
A1.36 Data for the right rearfoot complex of subjects 1-5. 319
A1.37 Data for the right rearfoot complex of subjects 6-10. 320
A1.38 Data for the right rearfoot complex of subjects 11-15. 321
A1.39 Data for the right rearfoot complex of subjects 16-20. 322
A1.40 Data for the right rearfoot complex of subjects 21-25. 323
A1.41 Mean data for the right rearfoot complex. 324
A1.42 Minimum, maximum and range of values in the right rearfoot
A1.43 Data for the left leg of subjects 1-5. 326
A1.44 Data for the left leg of subjects 6-10. 327
A1.45 Data for the left leg of subjects 11-15. 328
A1.46 Data for the left leg of subjects 16-20. 329
A1.47 Data for the left leg of subjects 21-25. 330
A1.48 Mean data for the left leg. 331
A1.49 Minimum, maximum and range of values in the left leg data. 332
A1.50 Data for the left heel of subjects 1-5. 333
A1.51 Data for the left heel of subjects 6-10. 334
A1.52 Data for the left heel of subjects 11-15. 335
A1.53 Data for the left heel of subjects 16-20. 336
A1.54 Data for the left heel of subjects 21-25. 337
A1.55 Mean data for the left heel. 338
A1.56 Minimum, maximum and range of values in the left heel data. 339
A1.57 Data for the left forefoot of subjects 1-5. 340
A1.58 Data for the left forefoot of subjects 6-10. 341
A1.69 Data for the left forefoot of subjects 11-15. 342
A1.60 Data for the left forefoot of subjects 16-20. 343
A1.61 Data for the left forefoot of subjects 21-25. 344
A1.62 Mean data for the left forefoot. 345
A1.63 Minimum, maximum and range of values in the left forefoot
data. 346
A1.64 Data for the left ankle/sub talar complex of subjects 1-5. 347
A1.65 Data for the left ankle/sub talar complex of subjects 6-10. 348 A1.66 Data for the left ankle/sub talar complex of subjects 11-15. 349 A1.67 Data for the left ankle/sub talar complex of subjects 16-20. 350 A1.68 Data for the left ankle/sub talar complex of subjects 21-25. 351
A1.69 Mean data for the left ankle/sub talar complex. 352
talar complex data. 353
A1.71 Data for the left mid tarsal joint of subjects 1-5. 354
A1.72 Data for the left mid tarsal joint of subjects 6-10. 355
A1.73 Data for the left mid tarsal joint of subjects 11-15. 356
A1.74 Data for the left mid tarsal joint of subjects 16-20. 357
A1.75 Data for the left mid tarsal joint of subjects 21-25. 358
A1.76 Mean data for the left mid tarsal joint. 359
A1.77 Minimum, maximum and range of values in the left mid tarsal
joint data. 360
A1.78 Data for the left rearfoot complex of subjects 1-5. 361
A1.79 Data for the left rearfoot complex of subjects 6-10. 362
A1.80 Data for the left rearfoot complex of subjects 11-15. 363
A1.81 Data for the left rearfoot complex of subjects 16-20. 364
A1.82 Data for the left rearfoot complex of subjects 21-25. 365
A1.83 Mean data for the left rearfoot complex. 366
A1.84 Minimum, maximum and range of values in the left rearfoot
complex data. 367
Appendix 2 A2.1 Right leg data taken of separate days (4 subjects). 370
A2.2 Right heel data taken of separate days (4 subjects). 371
A2.3 Right forefoot data taken of separate days (4 subjects). 372
A2.4 Right ankle/sub talar complex data taken of separate days (4
subjects). 373 A2.5 Right mid tarsal joint data taken of separate days (4 subjects). 374 A2.6 Right rearfoot complex data taken of separate days (4
subjects). 375
A2.7 Left leg data taken of separate days (4 subjects). 376
A2.8 Left heel data taken of separate days (4 subjects). 377
A2.10 Left ankle/sub talar complex data taken of separate days (4
subjects). 379
A2.11 Left mid tarsal joint data taken of separate days (4 subjects). 380 A2.12 Left rearfoot complex data taken of separate days (4 subjects). 381
A2.13 Difference between days in right leg data (4 subjects). 382
A2.14 Difference between days in right heel data (4 subjects). 383
A2.15 Difference between days in right forefoot data (4 subjects). 384 A2.16 Difference between days in right ankle/sub talar complex data
(4 subjects). 385
A2.17 Difference between days in right mid tarsal joint data (4
subjects). 386
A2.18 Difference between days in right rearfoot complex data (4
subjects). 387
A2.19 Difference between days in left leg data (4 subjects). 388
A2.20 Difference between days in left heel data (4 subjects). 389
A2.21 Difference between days in left forefoot data (4 subjects). 390 A2.22 Difference between days in left ankle/sub talar complex data
(4 subjects). 391
A2.23 Difference between days in left mid tarsal joint data (4
subjects). 392
A2.24 Difference between days in left rearfoot complex data (4
ACKNOWLEDGEMENTS.
I would like to thank my supervisor, Professor Peter Bowker, and advisor, Peter
Bowden, for encouraging me to undertake postgraduate study, and for their help,
support and direction during the completion of this work.
Thanks to Marietta Vander Linden for her considerable work on the computation of
angular rotations and data processing. Thanks also to Mike Rudd, Director of
Teclmical Services, and Alan Farnell, Technician, for their work on the design and
construction of the experimental rig.
This work was initially funded by a University of Salford studentship, with the final
DECLARATION.
I declare that this thesis has been composed by myself and embodies the results of
my own research carried out whilst studying at the University of Salford from
October 1995 to February 1999. All other sources of material have been specifically
acknowledged. None of the material has been used previously in application for a
NOMENCLATURE.
trom Total range of motion
rom Range of motion.
FORFT Forefoot segment
Ank/Stj Ankle joint and sub talar joint complex
MTJ Mid tarsal joint
RFC Rearfoot Complex.
Order of predominance Indicates the relative values of the ranges of motion in the
frontal, transverse and sagittal body planes. The first in the
order of predominance is the plane in which the largest range
of motion took place, the second the plane in which the
second largest range of motion took place and the third the
plane in which the smallest range of motion took place.
Frt Frontal plane
Trn Transverse plane
ABSTRACT.
During normal weight bearing the ankle, sub talar and mid tarsal joints function as a
kinematic chain and their motions are interdependent. This chain has three important
characteristics. Firstly, the motion in one of the components (joints) produces motion at
the other components (joints). Secondly, the three joints are interdependent because the
function of each is dependent on the position and motion at the other joints. Thirdly,
the pattern of motion between the joints during weight bearing motion is fixed. The
aim of this investigation was to determine the functional characteristics of the combined
ankle, sub talar and mid tarsal joints (the rearfoot complex).
A non invasive in vivo kinematic assessment was conducted to determine the relative
rotations at the ankle/sub talar complex, the mid tarsal joint and the rearfoot complex,
during weight bearing internal and external rotation of the leg in 25 subjects.
The results confirm that the rearfoot joints operate as a kinematic chain. The motion at
the ankle/sub talar complex suggests that the ankle is capable of a considerable range of
transverse plane motion. The axes of rotation for the mid tarsal joint described in this
thesis are the first for this joint quantified from a kinematic assessment and thus
supersede the theoretical axes for this joint described in the literature. The predominant
motion in the overall rearfoot complex is transverse plane motion. This would suggest
that the primary function of the foot is to permit transverse plane rotations of the leg and
proximal structures whilst maintaining the foot in a stable position of the floor. In
contrast to some of the literature, the ability of the foot to accommodate the transverse
CHAPTER 1
C.J.Nester, 1999. In Vivo Quantification of the Functional Characteristics of the Reelfoot Complex. Chapter 1
The joints of the rearfoot, the ankle, sub talar and mid tarsal joints, are traditionally
considered separately. Popular biomechanically orientated texts often describe the
motion at each joint with no reference to the motion occurring at the others joints. The
weight bearing movements in the rearfoot do not, however, support this approach to
rearfoot mechanics. The motions at the ankle, sub talar and mid tarsal joints are
coupled and the rearfoot joints function as a kinematic chain where motion in one joint
is accompanied by motion in the other joints. These motions within the foot are
coupled with transverse plane rotation of the leg proximally. Conversely, the transverse
plane rotation of the leg during normal walking, which is an essential component of
achieving the desired forward displacement of the contralateral foot, will always be
accompanied by motion within foot.
The characteristics of the movements in each component of the kinematic chain and in
the overall chain can be described using the range and direction of motion displayed in
each cardinal body plane, the axis of rotation around which motion takes place and any
changes in these during the total range of motion in the chain. Clearly, these should be
derived through scientific assessment and used to develop a model of rearfoot function.
There is considerable published work that collectively is improving our understanding
of rearfoot mechanics and contributing to the scientific basis upon which the model of
rearfoot function is based. This literature most frequently involves an in vitro study and
there are several important points regarding such experiments and the relevance of the
subsequent data. To provide a realistic description of rearfoot motion akin to that in
C.J.Nester, 1999. In Vivo Quantification of the Functional Characteristics of the Rearfoot Complex Chapter 1
studies, however, do not load the cadavers whilst others have used loads below those
which the foot would be subjected to during normal function. The movements in a
cadaver foot must be produced by a process akin to that in vivo. Some studies record
the motion of the foot relative to the leg (the position of which is fixed), whereas a
combination of the leg moving relative to the foot and the foot moving relative to the
leg occurs during most activities. Some studies induce motion in the rearfoot by
applying load to sectioned muscles or by rotating the leg in the transverse plane,
whereas a combination of muscle, ligament, ground reaction forces and proximal
movements produce motion during normal function. The motion through which the
rearfoot moves must be similar to that through which it moves in vivo. Some studies,
however, measure rearfoot kinematics during dorsiflexion and plantarflexion of the
foot, internal and external rotation of the leg and inversion and eversion of the foot,
whereas these occur simultaneously during normal function. Also, the sample number
in cadaver studies is usually restricted to below ten, which does not represent an
acceptable sample size.
The in vivo investigations in the literature have involved invasive methods to derive the
necessary kinematic data. The most popular method is to implant small metal beads
into the tarsal bones and to track their three dimensional position using X ray. This is
clearly unacceptable given the dangers of repeated exposure to radiation. This too
reduces the numbers of subjects that can be investigated.
The work presented in this thesis addresses some of these issues by recording the
motion of the rearfoot kinematic chain in vivo using a non invasive method during
C.J.Nester, 1999. In Vivo Quantification of the Functional Characteristics of the Reatfoot Complex. Chapter 1
describe the motion at the individual joints but also the combined function of the ankle,
sub talar and mid tarsal joints and thus the kinematic chain. In vivo studies have the
advantage that the rearfoot is functioning under a realistic load, the influence of active
muscles and ligaments on the joint motions are included and the sample size can be
increased in comparison to the cadaver based studies. This study builds on the
techniques of in vitro studies and assesses the overall characteristics of the rearfoot in
addition to those of its individual components.
The initial purpose of this study was to design a non invasive in vivo method which
would allow the functional characteristics of the rearfoot kinematic chain to be
determined. This description could be used to categorise individuals according to the
functional characteristics of their rearfoot complex and investigate any relationship
between each category and the incidence and type of lower limb pathology. In
particular, the mechanism by which transverse plane leg rotation is accommodated by
C.J.Nester, 1999. In Vivo Quantification of the Functional Characteristics of the Remfoot Complex. Chapter 2
CHAPTER 2
REVIEW OF THE REARFOOT
C.J.Nester, 1999. In Vivo Quantification of the Functional Characteristics of the Remfoot Complex. Chapter 2
2.1 INTRODUCTION.
The rearfoot complex is a model of rearfoot function that consists of the talus,
calcaneus, navicular and cuboid, and thus involves the ankle, sub talar and mid tarsal
joints. The weight bearing function of these joints has been described as a kinematic
chain where the movements in the individual joints are interdependent with each
other. The concept of interdependency is further illustrated by the fact that the
correct function of each joint is required for the rearfoot complex to perform its
principal function of allowing transverse plane motion of the tibia whilst the foot
remains relatively fixed on the floor. These points are discussed in more detail in
section 2.3. First, however, it is necessary to review the anatomy and functional
characteristics of the individual joints in the complex.
2.2 REVIEW OF THE INDIVIDUAL JOINTS IN THE REARFOOT COMPLEX.
2.2.1 THE ANKLE JOINT.
The ankle joint, or talocrural joint, is formed by the articulations between the body of
the talus and the distal ends of the tibia and fibula. The joint has three sites of
articulation. Laterally, the fibula base articulates with the large triangular facet
which dominates the lateral side of the talar body. Medially, a smaller and comma
shaped facet on the medial side of the talus articulates with the lateral aspect of the
medial malleolus. Superiorly, the trochlea surface articulates with the inferior aspect
C.J.Nester, 1999. In Vivo Quantification of the Functional Characteristics of the Reaffoot Complex. Chapter 2
anterior and concave from medial to lateral. In addition, it is wider anteriorly than
posteriorly and so has a wedged appearance.
There are multiple co-lateral ligaments of the ankle and, along with the strong
syndesmosis between the fibula base and tibia, they are responsible for the frontal
plane stability of the joint. Laterally there are three distinct bands; the anterior and
posterior talofibular ligaments and, central to these, the calaneofibular ligament.
These three ligaments restrain inversion of the talus relative to the tibia. In addition
they prevent excessive anterior and posterior displacement of the talus relative to the
tibia.
Medially the co-lateral ligaments are less distinct. Although separate bands are
present, the general appearance it that of a single large triangular ligament. The
medial ligament is considerably stronger than the lateral ligaments. It has a single
origin on the inferior aspect of the medial malleolus and an extensive insertions on
the navicular (naviculotibial portion), the central aspect of the calcaneus
(calcaneotibial portion), the medial aspect of the talar neck (anterior talotibial
portion) and the posterior and medial aspect of the talus (posterior talotibial
ligament). The medial ligament is responsible for restraining eversion of the talus
relative to the tibia.
2.2.1.1 Motion at the Ankle.
The principal characteristic of ankle joint motion has been well defined. All the
C.J.Nester, 1999. In Vivo Quantification of the Functional Characteristics of the Reatfoot Complex. Chapter 2
the talus towards the anterior aspect of the tibia, and plantarflexion, motion of the
talus away from the anterior aspect of the tibia. Coupled with this predominant
sagittal plane motion are small degrees of frontal and transverse plane motion.
The general orientation of the ankle joint axis reflects this sagittal plane domination.
Isman and Inman (1969) conducted a two dimensional analysis of the ankle joint in
46 cadaver specimens to determine the orientation of the joint axis when the talus
was manually dorsiflexed and plantarflexed through its full range of motion. They
consistently found the ankle joint axis slightly distal to both malleoli. The average
axis was orientated 80 0 (SD 4°) from the long axis of the tibia and 84° (SD 7°) from
the mid line of the foot. These results were in agreement with the earlier qualitative
studies of Barnett and Napier (1952) and Hicks (1953) who both described the axis
as being close to the malleoli. Lundberg et al (1989a) calculated ankle joint axes for
30° of plantarflexion and 30° of dorsiflexion of the foot using roentgen
stereophotogrammetry. The mean ankle joint axis passed through both malleoli in
the transverse plane view and was angled 7.33° relative to the transverse plane
(pointing down and laterally).
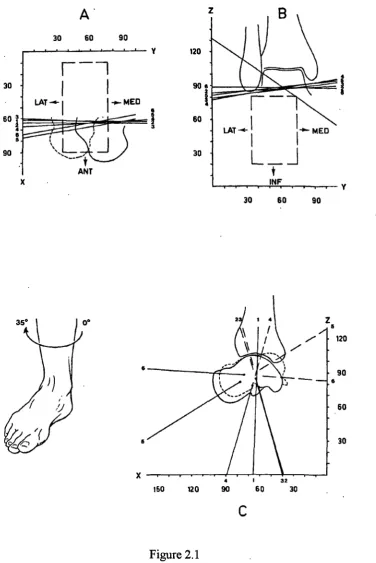
Van Langelaan (1983) assessed tibiotalar motion during external rotation of the leg
in 10 loaded cadavers (Figure 2.1). He reported ankle joint axes angled between
86.3° and 107.5° (mean 99°) relative to the sagittal plane and -4.6° and 25.9° (mean
11.5°) relative to the transverse plane. Lundberg et al (1989a) compared ankle joint
axes determined for the motions of dorsiflexion and plantarflexion of the foot, to
ankle joint axes determined for the motions of internal and external rotation of the
C.J.Nester, 1999. In Vivo Quantification of the Functional Characteristics of the Remfoot Complex. Chapter 2
axes for dorsiflexion and plantarflexion of the foot were different from those for
internal and external rotation of the leg. Like Van Langelaan (1983), Lundberg et al
noted that the orientation of the ankle joint axis was different for each stage of ankle
motion, suggesting that the axis was not fixed in position or orientation but was a
constantly varying instantaneous axis of rotation. A previous two dimensional
radiographic study had described multiple centres of rotation for the ankle
z B
120
-90e
2
I
LAT —4- 1 I..a,_ MED
I 1
L___
t
_1INF ,
w
30 60 90
V
30 60 90
60 .
30
-14
.1
Z 5 ,/ 120
90 a
60
30
32
150 120 so 60 30
C
[image:35.595.136.513.63.627.2]C.J.Nester, 1999. In Vivo Quantification of the Functional Characteristics of the Reaffoot Complex. Chapter 2
Figure 2.1
Transverse (A), frontal (B) and sagittal plane (C) views of the ankle joint axes calculated by Van Langelaan (1983) for one cadaver, during
C.J.Nester, 1999. In Vivo Quantification of the Functional Characteristics of the Reatfoot Complex. Chapter 2
The concept of an ankle joint axis whose orientation was not fixed during the range
of motion had been suggested earlier by Barnett and Napier (1952). They described
two distinct arcs on the medial facet of the talus that would produce two distinct
centres of rotation during ankle motion. They deduced that during dorsiflexion the
ankle axis was inclined downwards in a lateral direction and during plantarflexion
the axis was inclined downward in a medial direction. The detailed analysis
conducted by Van Langelaan (1983) and Siegler et al (1988) has confirmed the
concept of multiple axes of rotation for the ankle joint, though neither study
suggested that there were distinct axes for dorsiflexion and plantarflexion.
The anldes in Lundberg et al's (1989a) study, however, did display a pattern
suggesting distinct `dorsiflexion' and `plantarflexion' axes when the foot was
dorsiflexed and plantarflexed. Plantar flexion axes were inclined downward in a
medial direction or were close to the horizontal when compared to the dorsiflexion
axes, which tended to be inclined downward in a lateral direction (Figure 2.2). The
angle between the dorsiflexion and plantarflexion axes when projected onto the
frontal plane was, on average, 37°. In the transverse plane projection the axes were
all close to the centres of the malleoli and in all projections all axes crossed each
C.J.Nester, 1999. In Vivo Quantification of the Functional Characteristics of the Rearfoot Complex. Chapter 2
•----i...a---\
..._ )101n14.- 41.1111 11-w..--1111M_:_. ... n n.,
•suboot 1 Subject 2 Subject 2 Subject 4
L---, ,. --,
L---..-' laillt
JaillijcILL' i
Subject 8 Subject 0 Subject 7 Subject 8
0
O
Subject 1 "
11
VIII \
Subject 2
0
0'
to 1 &Abject 3 C:12 Subject 4 41, Subject 411/111P Ia
nIIP subject 8 i Ili, Subject 7 417 Subject I Figure 2.2Frontal and transverse plane views of the ankle joint axes calculated by Lundberg and Svensson (1989a). In the frontal plane view the distinct laterally and downward orientated axes are the dorsiflexion axes, those orientated horizontally or downward and medially are plantarflexion axes. In the transverse plane view all axes pass through both malleoli.
It is reasonable to suggest that the ankle might possess different axes for dorsiflexion
and plantarflexion of the foot because of the non spherical nature of the trochlea
surface. Furthermore, McCullough and Burge (1990) found that some degree of
transverse plane rotation of the talus within the anlde mortise is possible and it is
reasonable, therefore, to suggest that there are different axes of rotation when the
ankle is moved by dorsiflexion and plantarflexion of the foot compared to when it is
moved by transverse plane rotation of the tibia. A further point on this issue is that
during gait the sagittal plane motion of the ankle and the transverse plane motion of
C.J.Nester, 1999. In Vivo Quantification of the Functional Characteristics of the Recufoot Complex. Chapter 2
There is some evidence of variation between individuals in the orientation of the
plantarflexion/dorsiflexion ankle joint axis. Isman and Inman (1969) reported axes
ranging from 68° to 88° relative to the long axis of the tibia and 69° - 99° relative to
the mid line of the foot in 46 cadavers. In Lundberg et al's (1989a) sample of 8
subjects the mean angle made by the ankle axis to the transverse plane, calculated for
30° of foot plantarflexion and 30° of foot dorsiflexion, varied between -2° and 14.3°.
In Van Langelaan's (1983) work, where anlde joint axes were calculated during
transverse plane rotation of the tibia, the angle of the mean ankle joint axis varied
between individuals by 21.2° relative to the sagittal plane and 30.8° relative to the
transverse plane in 8 subjects. Significantly, despite all these individual variations the
principal motion at the ankle joint was dorsiflexion and plantarflexion.
The range of motion available at the ankle joint also shows variation between
individuals. This reflects not only real individual variations but also the variety of
methods employed to deduce the range of motion and the choice of reference
positions. Some investigators have measured motion between the talus and tibia,
others the sagittal plane motion of the plantar surface of the foot relative to the leg,
claiming this to be a measure of ankle joint motion. However, since both the sub
talar and mid tarsal joints are capable of some sagittal plane motion, any investigator
must be confident that they can stabilise both these joints during such measurements.
This is questionable. The choice of measuring device also varies, some using
radiographs, and others goniometers. Unfortunately no method of assessing ankle
joint motion has been universally accepted. Rome (1997) illustrated the effect of
C.J.Nester, 1999. In Vivo Quantification of the Functional Characteristics of the Reatfoot Complex. Chapter 2
as whether the subject was weight bearing or non weight bearing, sitting or standing,
prone or supine and whether motion was actively or passively produced were all
shown to affect clinical measurements.
Hicks (1953) measured the range of motion between the talus and tibia in 10
cadavers. He described an average total range of sagittal plane motion as 50 0 . Using
X-rays Sammarco (1973) measured the range of motion in 21 weight bearing ankles.
The total range of sagittal plane motion varied from 24° to 75°, with an average of
43°. The mean range of dorsiflexion was 21° and that of plantarflexion 23°.
Lundberg et al (1989a) calculated an average of 54.1° of principally sagittal plane
ankle motion when the foot was moved from 30° of plantarflexion to 30° of
dorsiflexion.
2.2.2 THE SUB TALAR JOINT.
The sub talar joint is formed by the three facets on the inferior surface of the talus
and three corresponding facets on the superior surface of the calcaneus. The
contours of all six articular areas are complex and all are angled relative to each
other. The posterior articulation is the largest and has a separate joint capsule from
that of the anterior and middle articulations. The anterior and middle facets are
smaller and sometimes continuous with each other. They share their joint capsule
with the talonavicular joint. Separating the posterior articulation from the anterior
and middle articulations is the sinus tarsi. This is a tunnel formed by the sulcus
calcanei and the sulcus tali running from posterior/medial to anterior/lateral. Within
C.J.Nester, 1999. In Vivo Quantification of the Functional Characteristics of the Rearfoot Complex. Chapter 2
to superior/medial. This ligament functions to maintain the close association
between talus and calcan.eus during joint motion. Lateral to the sinus tarsi is the
cervical ligament that runs from the dorsal superior aspect of the calcaneus to the
inferior/lateral aspect of the talar neck. The cervical ligament tightens during
supination of the foot.
2.2.2.1 Motion at the Sub Talar Joint.
Sub talar joint motion is a complex tri-planal motion described as pronation, a
combination of eversion, abduction and dorsiflexion, and supination, a combination
of inversion, adduction and plantarflexion. During closed chain sub talar joint
supination the talus abducts, dorsiflexes and everts relative to the calcaneus. During
closed chain sub talar joint pronation the talus adducts, plantarflexes and inverts
relative to the calcaneus.
Motion at the sub talar joint takes place around an axis that is angled relative to all
three cardinal body planes. The specific orientation of the sub talar joint axis has
been extensively investigated. In 1966 Root et al modified Manter's (1941) earlier
experimental set up in an attempt to determine the orientation of the sub talar joint
axis in 22 amputated feet. Pins of adjustable length were inserted into the body of
the talus and the plane of motion of the pins was identified using a flat surface. The
flat surface was then placed within a box whose sides represented the cardinal body
planes and the angle of the axis relative to these planes determined. This assumed
that the axis for the total range of sub talar joint motion was perpendicular to the
C.J.Nester, 1999. In Vivo Quantification of the Functional Characteristics of the Rewfoot Complex. Chapter 2
and Manter 1938, Manter 1941, Hicks 1953). The investigators described an average
axis making an angle of 17° to the sagittal plane, range of 8° to 29° (SD 2.23) and an
angle of 41° to the transverse plane, range of 22° to 55° (SD 8.36). These are now
the accepted figures for the angulation of the sub talar joint axis relative to the
cardinal body planes and form the basis of the current model of sub talar joint
function. Subsequent investigations have confirmed that these figures are generally
correct (Isman and Inman 1969, Van Langelaan 1983, Benick 1985, Engsberg
1987, Lundberg and Svensson1993).
All the literature describing the motion at the sub talar joint highlights individual
variation in the orientation of the sub talar joint axis. Isman and Inmans' (1969)
work involving 47 cadavers revealed marked individual variations in the orientation
of the sub talar joint axis. The angle of the axis to the sagittal plane varied by 43°
and the angle of the axis to the transverse plane by 48° within the sample. Van
Langelaan (1983) found the angulation of the axis to the sagittal plane to vary
between 5.4° and 32.3°, mean 23.5°, and the angulation of the axis to the transverse
plane to vary between 23.2° and 56.4°, mean 41.9°, in his sample of ten cadavers.
Like Van Langelaan (1983), Lundberg and Svensson (1993) analysed the motion of
metal beads implanted in the bones of the tarsus and leg using X-rays. The specific
axis orientation for each individual was not documented, but the authors commented
that variation between subjects was considerable. Work by Manter (1941) and
Engsberg (1987) has documented similar results.
If, as the literature suggests, the orientation of the axis varies between individuals,
C.J.Nester, 1999. In Vivo Quantification of the Functional Characteristics of the Reatfoot Complex. Chapter 2
possess very different functional characteristics. For example, with regard to the
transverse plane orientation of the axis, as the angle between the transverse plane and
the axis increases the range of transverse plane sub talar joint motion per degree of
sub talar joint motion will increase and the range of frontal plane sub talar joint
motion will decrease. The reverse is the case when the axis makes a smaller angle
to the transverse plane. A sub talar joint with an axis angled 16° from the sagittal
plane and 200 from the transverse plane, for example, would display 9.0° of eversion,
3.4° of abduction and 2.6° of dorsiflexion for 10° of pronation around the axis.
However, if the transverse plane orientation was 65°, 10° of sub talar joint pronation
would produce 4.1° of eversion, 9.1° of abduction, and 1.2° of dorsiflexion. The
present model of sub talar joint function, which is based on the averaged sub talar
axis, might not be suitable in such instances because the two sub talar joints would
function differently to each other and to a sub talar joint with the average axis. The
variation in sagittal plane orientation might not produce such significant changes in
sub talar joint function. The range of angles relative to the sagittal plane (5.4° —
47°) means that the angle is rarely more than 45°. Consequently, with regard to the
angulation of the axis to the sagittal plane, the predominant motion will be frontal
plane motion for almost all the population and two sub talar joints with axes at
opposite ends of the range will retain more similar characteristics of motion. That is
not to infer, however, that the change in sagittal plane angulation is of no
significance.
The degree of individual variation in axis orientation quoted in the literature (Figure
2.3) would suggest that the use of an average sub talar joint axis to represent a
C.J.Nester, 1999. In Vivo Quantification of the Functional Characteristics of the Reatfoot Complex. Chapter 2
a sub talar joint axis whose orientation differs significantly from the average.
Furthermore, such wide variation could result in significantly different rearfoot
movements and consequently different foot and lower limb pathologies being
associated with different sub talar joint axis orientations. Root et al (1966) stated,
C.J.Nester, 1999. In Vivo Quantification of the Functional Characteristics of the Rearfoot Complex. Chapter 2
A further complication in the model of sub talar joint function is the fact that the
orientation and position of the sub talar joint axis has been found to change
throughout the range of joint motion. Van Langelaan (1983) calculated the
orientation of the sub talar joint axis at various stages of supinatory motion in 10
cadavers. The sub talar joint axes he deduced changed orientation during the range
of motion, tending to move from a low pitch and medial orientation in pronation, to
a high pitch and forward orientation in supination. When the axes for each stage of
supination were superimposed on each other they formed a bundle of axes. The
angle between the first and last axes in a bundle was also variable between
individuals, ranging from 4.4° to 24.8° in the case of the sagittal plane orientation
and 2.8° to 26.3° in the case of the transverse plane orientation. The axis was
consistently angled closer to the sagittal plane and further from the transverse plane
as the sub talar joint supinated. Thus, not only does the axis change orientation
during the range of motion, the extent to which its orientation changes in variable
30 60
123 456 651423
1234 56
30 60 90
z
120
90
60
30
1234 5 6 z
C.J.Nester, 1999. In Vivo Quantification of the Functional Characteristics of the Reatfoot Complex. Chapter 2
A
B
C
Figure 2.4
C.J.Nester, 1999. In Vivo Quantification of the Functional Characteristics of the Remfoot Complex. Chapter 2
Benick (1985), using the same equipment as Van Langelaan (1983), and later
Lundberg and Svensson (1993) have documented similar results. Siegler et al
(1988), who also analysed motion of the talus and calcaneus in cadavers, also stated
that the sub talar axis was not a fixed axis of rotation though they did not state the
specific orientations of the joint axes. Considering the variable orientations of the
sub talar joint axis during its range of motion, and the changes in the functional
characteristics of the joint this reflects, it might not be appropriate to use a single
joint axis orientation to represent an individual. Certainly, calculating the orientation
of the sub talar joint axis from the total range of sub talar motion may not reflect the
axis around which the joint rotates during gait, since only a proportion of the full
range is used during gait. Determining the portion of sub talar motion used during
gait and calculating an axis of rotation for this part of the total range of motion would
enable a more relevant axis orientation to be calculated.
The range of motion at the sub talar joint is usually assessed by measuring the range
of supination and pronation separately. The so-called neutral position of the sub talar
joint is used as a reference position from which the respective ranges of motion can
be measured. This position is said to be the point of maximum joint congruency and
can be found by a number of palpation methods (Cook et al 1988). However, the
poor inter observer reliability for the determination of the neutral position puts into
question the validity of subsequent measurements and makes comparisons between
different studies difficult (Ball and Johnson 1993, Pierrynowski et al 1996). Despite
this there is general agreement that there is more supination than pronation at the sub
talar joint. The ratio of these motions is traditionally said to be 2:1 although
C.J.Nester, 1999. In Vivo Quantification of the Functional Characteristics of the Reatfoot Complex. Chapter 2
The total ranges of sub talar joint motion quoted show some variation between
authors. Hicks (1953) reported 24° of sub talar motion from 10 cadaver specimens.
Van Langelaan (1983) recorded a minimum of 15.5° and a maximum of 30°, average
23.6°, during external rotation of the leg from an internally rotated position. Ball and
Johnson (1993) measured the frontal plane angle between the heel and leg and
reported a mean total range of motion of 37.3°, range 28° - 48° (SD 5.4°) in 25 prone
subjects.
Care must be taken when interpreting some investigators' results because what may
be described as sub talar joint motion may in fact only be the frontal body plane
component of sub talar joint motion, or even the frontal plane component of the
ankle and sub talar joints. Strictly speaking, sub talar joint motion is that which takes
place around the sub talar joint axis. Since the axis is angled relative to each cardinal
body plane, the range of motion cannot be observed from any single cardinal body
plane. Further problems may arise because not every foot has the same predominant
motion. Thus, if one foot has less frontal plane motion than another it is not correct
to assume that the range of sub talar joint motion is less in that foot. Measuring
frontal plane sub talar motion in isolation does not describe sub talar joint function
adequately (Engsberg et al 1988). Also, sub talar joint function is that between the
talus and the calcaneus and, since the talus cannot be assessed clinically, most
methods of measuring sub talar motion assume the talus to be immobilised in the
ankle mortice. This is questionable (McCullough and Burge 1980, Ahl et al 1987)
and variable depending upon an examiner's ability to stabilise the ankle joint. In
addition, Ball and Johnson (1993) have shown that the protocol for measurements of
C.J.Nester, 1999. In Vivo Quantification of the Functional Characteristics of the Reatfoot Complex. Chapter 2
(prone, sitting or kneeling), the method of producing passive sub talar joint motion
(either moving the heel or the whole foot) and whether the motion was actively
produced by the subject all have significant effects on the measured range of motion.
As with measures of ankle joint motion, no method of measuring sub talar joint
motion has received universal acceptance.
2.2.3 THE MID TARSAL JOINT.
The mid tarsal joint is a conceptual functional unit comprising the calcaneocuboid
and talonavicular joints. The calcaneocuboid joint is formed by the articulation
between the anterior surface of the calcaneus proximally and the posterior surface of
the cuboid distally. The posterior surface of the cuboid is concave from medial to
lateral and convex from superior to inferior. The talonavicular joint is formed by the
anterior surface of the talus head proximally, and the posterior surface of the
navicular distally. The posterior surface of the navicular is concave, both in a
medial/lateral and superior/inferior directions. The smooth talar head is convex in
both medial/lateral and superior/inferior directions. The navicular and cuboid are
joined by a fibrous joint that allows little movement of either bone in relation to the
other and thus are considered to be one unit.
2.2.3.1 Motion at the Mid Tarsal Joint.
The current model of mid tarsal joint motion is based on two separate conceptual
axes of rotation around which motion takes place synchronously. Manter (1941)
described the oblique axis of the mid tarsal joint, which was angled 52° from the
C.J.Nester, 1999. In Vivo Quantification of the Functional Characteristics of the Reatfoot Complex. Chapter 2
produces combined plantarflexion, inversion and adduction (supination) and
dorsiflexion, eversion and abduction (pronation). In a foot with this axis, 10 0 of
pronation would produce 7.9° of abduction, 5.1 0 of dorsiflexion and 3.4° of eversion.
This was consistent with similar descriptions of this axis in earlier work (Elftman and
Manter 1938, Fick 1911 - cited by Manter 1941).
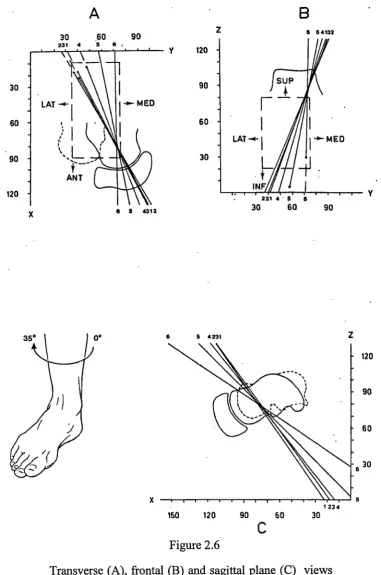
The second conceptual axis at the mid tarsal joint is the longitudinal axis. Manter
(1941) described its position as 15° from the transverse plane and 9° from the sagittal
plane (Figure 2.5). Motion around the average axis would produce 9.5° of eversion,
2.6° of abduction and 1.5° of dorsiflexion for every 10° of pronation. Since this
early work few other investigations appear in the literature concerning the motion at
the conceptual oblique and longitudinal axes of the mid tarsal joint. The model
based on these axes has however been accepted regardless of the apparent lack of
C.J.Nester, 1999. In Vivo Quantification of the Functional Characteristics of the Reatfoot Complex. Chapter 2
[image:50.595.83.489.51.315.2]Longitudinal axis Oblique axis
Figure 2.5
Orientation of the conceptual longitudinal and oblique mid tarsal joint axes (from Manter 1941).
Huson (1991) believed that the talonavicular and calcaneocuboid joints were
sufficiently independent to question the existence of a single functional unit such as
the mid tarsal joint. He used Van Langelaan's (1983) results to justify his argument.
Van Langelaan described a mean talonavicular axis angled 14.1° to the sagittal plane
and 38.5° to the transverse plane. The mean calcaneocuboid axis was angled 2.7° to
the sagittal plane and 51.9° to the transverse plane. These results show that the
calcaneocuboid and talonavicular joints had different axes of rotation. Also, Van
Langelaan described relative motion between the cuboid and navicular of between
3.9° and 9.9° (mean 6.8°) during external rotation of the leg from an internally
rotated position. Thus, the navicular and cuboid are not rigidly fixed relative to each
C.J.Nester, 1999. In Vivo Quantification of the Functional Characteristics of the Retufoot Complex. Chapter 2
conceptual mid tarsal joint axes the cuboid and navicular undergo some motion
relative to each other. However, the conceptual mid tarsal joint provides a model that
describes the principal motions of the navicular and cuboid relative to the calcaneus
and talus. The principal motions of the navicular and cuboid are always in the same
direction and some degree of relative motion between the cuboid and navicular in a
direction other than that of the principal motion does not contradict the concept of a
single functional mid tarsal joint.
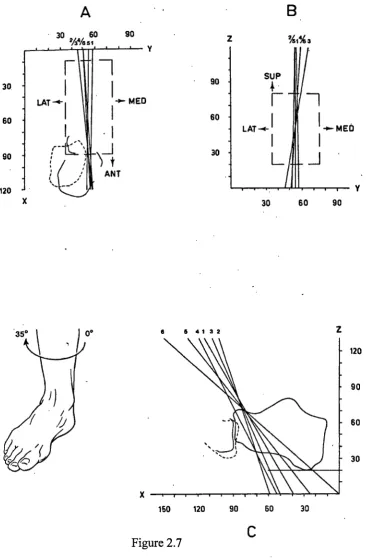
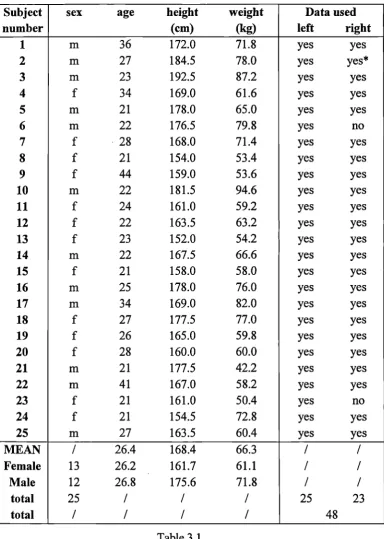
Furthermore, the axes Van Langelaan (1983) determined for the separate
talonavicular and calcaneocuboid joints reflect the conceptual mid tarsal joint axes.
As a generalisation, the individual joint axes have the sagittal plane orientation of the
conceptual longitudinal mid tarsal joint axis and the transverse plane orientation of
the conceptual oblique mid tarsal joint axis (Figure 2.6 and Figure 2.7). From this
we can clearly see where the motions at the conceptual oblique and longitudinal mid
tarsal joint axes originate. We can also conclude from the actual rotation axes that
the two joints undergo very similar motions and, since they always take place in the
same direction and have strong anatomical linkage, can be considered a single
functional unit. Thus, Huson's (1991) suggestion that the talonavicular and
A
30 .60 90
231 4 5 8
6 5 4312 30
60
90
120
6 5 4132
120
90
60
30
5 4 231
120
90
60
30
C.J.Nester, 1999. In Vivo Quantification of the Functional Characteristics of the Rearfoot Complex Chapter 2
1 23 4
[image:52.595.118.500.67.643.2]150 120 90 60 30
Figure 2.6
A
• 30 60 90
244/6 51 %eh 3
30 60 90
150 120 90 60 30
30
60
90
120
• 90
60
30
• .. , I
5 4 1 3 2
[image:53.595.115.482.64.625.2]C.J.Nester, 1999. In Vivo Quantification of the Functional Characteristics of the Rearfoot Complex. Chapter 2
Figure 2.7