Journal of Chemical and Pharmaceutical Research, 2016, 8(7):677-682
Research Article
CODEN(USA) : JCPRC5
ISSN : 0975-7384
677
Development and validation of stability indicating HPTLC method
for simultaneous estimation of paracetamol and mefenamic acid in
liquid dosage form
Yogesh Gandhi, Padmanabh Deshpande*, Neha Deore and Ganesh Sarowar
Department of Quality Assurance Techniques, AISSMS College of Pharmacy, Pune – 411 001(M.S.) India
ABSTRACT
A simple, accurate, precise and selective stability- indicating high performance thin layer chromatographic method has been developed and validated for simultaneous estimation of Paracetamol and Mefenamic acid in suspension. Chromatographic separation of both the drugs was achieved by using Benzene: Methanol (8.5: 1.5, v/v) as mobile phase with UV detection at 226 nm. The retention factors for Paracetamol and Mefenamic acid were found to be 0.39 ± 0.006 and 0.69± 0.006, respectively. The developed method was validated in terms of linearity, accuracy, precision and robustness as per ICH guidelines. The drugs were subjected to stress condition of hydrolysis (acid, base), oxidation. Linear response was observed in the concentration range of 250-1500 ng band-1 for Paracetamol and 100-600 ng band-1 for Mefenamic acid. The method has been applied for the analysis of drugs in suspension. The % assay (Mean ± S.D.) was found to be 99.00 ± 1.48 for Paracetamol and 99.84± 1.87 for Mefenamic acid.
Keywords: Paracetamol, Mefenamic acid, HPTLC, Stress degradation, Validation
INTRODUCTION
Paracetamol (PARA), chemically, N-(4-hydroxyphenyl) ethanamide N- (hydroxyphenyl) acetamide is used to reduce pain and fever [1]. Mefenamic acid (MFA), 2-(2, 3-dimethylphenyl) amino benzoic acid is non-steroidal anti-inflammatory drug used to treat mild to moderate pain and is sometimes used to prevent migraines associated with menstruation [2].
Literature survey reveals high performance thin layer chromatographic [3] high performance liquid chromatographic [4, 5] and UV Spectrophotometric [6, 7] methods for estimation of PARA in human plasma and pharmaceutical dosage form in combination with other drugs. Analytical methods reported for MFA includes HPLC [8-10], HPTLC [11, 12] and UV [13] either as single or in combination with other drugs. Reports are also available for simultaneous determination of PARA and MFA by HPLC [14, 15] and HPTLC [16] method.
678
EXPERIMENTAL SECTION
Chemicals and reagents
Pharmaceutical grade working standards PARA and MFA were kindly supplied by Sun Pharma (Mumbai, India). The pharmaceutical dosage form used in this study was Metagesic-DS suspension (Blue Cross Laboratories Pvt. Ltd., India) labeled to contain 250 mg of PARA and 100 mg of MFA was procured from the local market. Benzene, Methanol (AR grade) was purchased from Merck specialties Pvt. Ltd. (Mumbai, India).
Instrumentation and chromatographic conditions
Chromatographic separation of drug was performed on precoated silica gel aluminium plate 60 F254 (10 ×10) with
250 µm thickness (E. MERCK, Darmstadt, Germany) using a CAMAG Linomat 5 sample applicator (Switzerland). Samples were applied on the plate as a band with 6 mm width using Camag 100 µL sample syringe (Hamilton, Switzerland).
Linear ascending development was carried out in 10 x 10 cm twin trough glass chamber (CAMAG, Muttenz, Switzerland) by using Benzene: Methanol (8.5: 1.5, v/v) as mobile phase with chamber saturation time of 15 min. The length of chromatogram run was 9 cm and development time was approximately 15 min. After development, TLC plates were dried and densitometric detection was performed on CAMAG thin layer chromatography scanner at 226 nm operated by WINCATS software version 1.4.2. Deuterium lamp emitting a continuous UV spectrum between 200 to 400 nm was used as source of radiation.
Preparation of Standard Stock Solution
Working standard solution of PARA was prepared by dissolving 25 mg of drug in 10 mL of methanol to get concentration of 2500 ng µL-1 from which 1 mL was further diluted to 10 mL to get final concentration of 250 ng µL-1. Stock solution of MFA was prepared by dissolving 10 mg of drug in 10 mL of methanol to get concentration of 1000 ng µL-1 from which 1 mL was further diluted to 10 mL to get final concentration of 100 ng µL-1.
Selection of Detection Wavelength
[image:2.595.141.480.444.626.2]After chromatographic development bands were scanned over the range of 200-400 nm. It was observed that both the drugs showed considerable absorbance at 226 nm. So, 226 nm was selected as the wavelength for detection (Figure 1).
Fig. 1. In situ overlay spectrum of PARA and MFA
Analysis of Marketed Suspension
679
Stress degradation studies of bulk drug
The forced degradation studies were carried out on bulk drug substance in order to prove the stability-indicating property and selectivity of the developed method. The degradation was carried out under hydrolytic, oxidative stress conditions.
Acid treatment
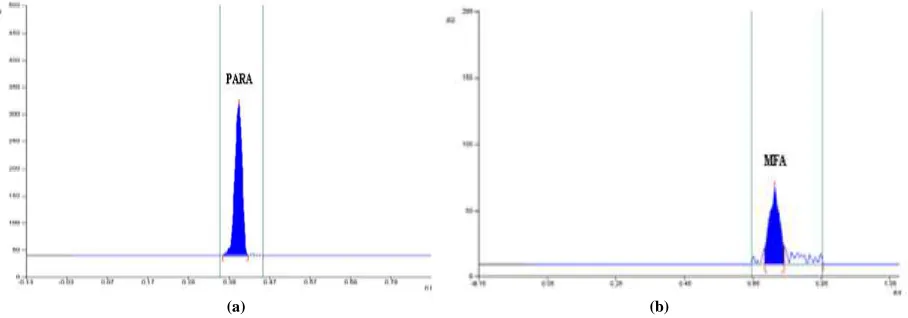
1 mL working standard solution of PARA (2500 ng µL-1) was mixed with 1 mL of 0.1 N HCl and 8 mL of methanol. The solution was keep at room temperature for 4 h. 2 µL of resulting solution was applied on TLC plate to get concentration 500 ng band-1. Same procedure was repeated for MFA (1000 ng µL-1) to get final concentration 200 ng band-1 applied on the TLC plate. After acid hydrolysis, PARA showed peak of degradation at Rf 0.42 and 13.11 % of degradation was observed for MFA with no degradation peak. The densitogram obtained after acid degradation is shown in Figure 2.
[image:3.595.83.533.217.370.2](a) (b)
Fig. 2. Representative densitogram of (a) PARA with degradation product DP (Rf =0.42) (b) MFA Alkali treatment
[image:3.595.87.525.490.638.2]1 mL working standard solution of PARA (2500 ng µ L-1) was mixed with 1 mL of 0.1 N NaOH and 8 mL of methanol. The solution was keep at room temperature for 4 h. 2 µL of resulting solution was applied on TLC plate to get concentration 500 ng band-1. Same procedure was repeated for MFA (1000 ng µL-1) to get final concentration 200 ng band-1 applied on the TLC plate. Both the drugs were found susceptible to alkali degradation with % degradation of 24.07 for PARA and 23.39 for MFA. The densitogram obtained after alkali degradation is shown in Figure 3.
(a) (b)
Fig. 3. Representative densitogram of alkali induced degradation (a) PARA (b) MFA
Neutral Hydrolysis
680
[image:4.595.85.531.68.228.2](a) (b)
Fig. 4. Representative densitogram obtained after neutral degradation (a) PARA (b) MFA
Oxidative degradation
1 mL working standard solution of PARA (2500 ng µ L-1) was mixed 1 mL of 3 % solution of H2O2 and 8 mL of
methanol. The solution was keep at room temperature for 4 h. 2 µL of resulting solution was applied on TLC plate to get concentration 500 ng band-1. Same procedure was repeated for MFA (1000 ng µL-1) to get final concentration 200 ng band-1 applied on the TLC plate. About 73.91 % of PARA was recovered with reduction in peak area. On other hand, 72.14 % of MFA was recovered without appearance of additional product. The representative densitogram obtained after oxidative degradation is shown in Figure 5.
(a) (b)
Fig. 5. Densitogram of peroxide induced degradation (a) PARA (b) MFA
RESULTS AND DISCUSSION
Optimization of chromatographic method
[image:4.595.82.536.353.512.2]681
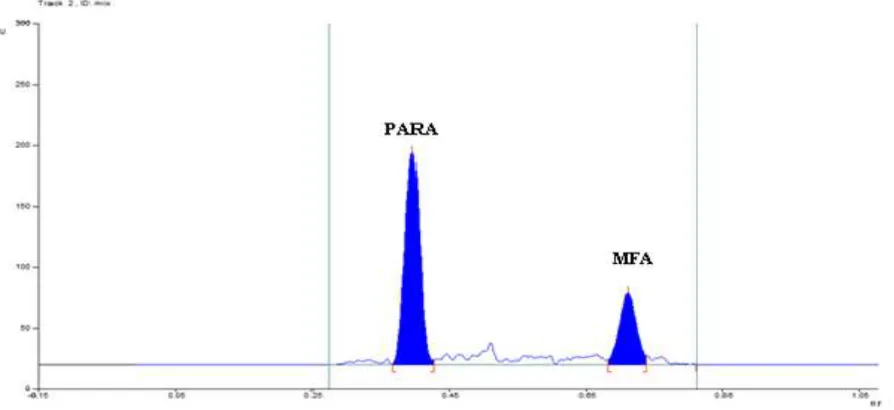
Fig. 6: Representative densitogram of mixed standard solution of PARA (500 ng band-1, R
f = 0.39 ± 0.006) and MFA (200 ng band-1, Rf = 0.69 ± 0.006)
Result of stress degradation studies
Stress degradation studies showed no interference of degradation products at retention time of drug. The degradation products were well resolved from both the drugs indicating specificity of the method. The results obtained after stress degradation studies are summarized in Table 1.
Table 1: Data of forced degradation studies of PARA and MFA
Stress conditions/ duration
PARA MFA
% Assay of active substance
% degradation
% Assay of active substance
% degradation
Acidic/ 0.1 N HCl/ Kept at RT for 4 h 93.00 7.00 86.89 13.11
Alkaline/1 N NaOH/ Kept at RT for 4 h 75.93 24.07 78.61 23.39
Oxidative/3 % H2O2/ Kept at RT for 4 h 73.91 26.09 72.14 27.86
Neutral/H2O/ Kept at RT for 4 h 84.05 15.95 75.33 24.67
Method Validation
The method was validated for linearity, accuracy, intra-day and inter-day precision and robustness as per ICH guidelines [17, 18].
Linearity
The standard stock solutions of PARA (250 µL-1) and MFA (100 ng µ L-1) were applied by over spotting on TLC plate in range of 1, 2, 3, 4, 5 and 6 µL. Linear results were observed in the concentration range of 250-1500 ng band-1 for PARA and 100-600 ng band-1 for MFA with high correlation coefficient > 0.99.
Precision
Set of three different concentrations in three replicates of standard solutions were prepared. All the solutions were analyzed on the same day in order to record any intra day variations in the results. Intra-day variation, as RSD (%), was found to be in the range of 0.34 to 1.96 for PARA and 0.14-1.59 for MFA. For Inter day variation study, three different concentrations of the standard solutions in linearity range were analyzed on three consecutive days. Interday variation, as RSD (%) was found to be in the range of 0.32 -1.34 for PARA and 0.62-1.06 for MFA.The lower values of % R.S.D. (< 2) indicated that method was found to be precise.
Limit of Detection (LOD) and Limit of Quantitation (LOQ)
LOD and LOQ were calculated as 3.3 σ/S and 10 σ/S, respectively; where σ is the standard deviation of the response (y-intercept) and S is the slope of the calibration plot. The LOD was found to be 49.27 ng band-1 for PARA and 15.68 ng band-1for MFA. The LOQ was found to be 100 ng band-1 for PARA and 48 ng band-1 for MFA.
Recovery Studies
[image:5.595.138.479.389.471.2]682
band-1 for MFA. The drug concentrations were calculated from respective linearity equation. The results of the recovery studies indicated that the method is accurate for estimation of drugs in liquid dosage form. The results obtained are shown in Table 2.
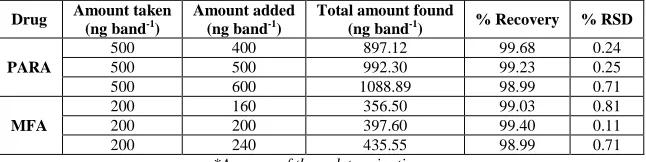
Table 2: Recovery Studies of PARA and MFA
Drug Amount taken
(ng band-1)
Amount added (ng band-1)
Total amount found
(ng band-1) % Recovery % RSD
PARA
500 400 897.12 99.68 0.24
500 500 992.30 99.23 0.25
500 600 1088.89 98.99 0.71
MFA
200 160 356.50 99.03 0.81
200 200 397.60 99.40 0.11
200 240 435.55 98.99 0.71
*Average of three determinations
Robustness Studies
[image:6.595.146.469.125.206.2]Robustness of the method was determined by carrying out the analysis under conditions during which mobile phase composition, chamber saturation time was altered and the effect on the area of drug was noted. The deliberate alterations of the analytical parameters showed that areas of peaks of interest remained unaffected by small changes of the operational parameters (% R.S.D. < 2) indicating robustness of the method. The results are given in Table 3.
Table 3. Robustness Data in Terms of Peak Area (% RSD)
Sr.
No. Parameter
(% RSD)
PARA MFA
1 Mobile phase composition (± 2 % methanol) 0.34 0.33
2 Chamber saturation time (± 10 %) 0.41 0.43
*Average of three determinations
CONCLUSION
The developed HPTLC method is simple, precise, accurate and stability-indicating without interference from the excipients or from degradation products. The developed method can be used for quantitative analysis of PARA and MFA in pharmaceutical dosage form.
REFERENCES
[1] https://en.Wikipedia.Org/Wiki/Paracetamol (accessed on 08/07/2015) [2] https://en.Wikipedia.Org/Wiki/Mefenamic acid (accessed on 08/07/2015)
[3] PH Chaube; SV Gandhi; PB Deshpande; VG Kulkarni. Journal of Pharmaceutical and Biomedical Sciences, 2010, 7(13), 1-6.
[4] D Shah; B Patel; A Bhavsar. World Journal of Pharmacy and Pharmaceutical Sciences, 2014, 3(4), 1009-1020 [5] KV Lalitha; GM Mohan; J Ravindra Reddy; K Vinod Kumar; A Aliekya. Journal of Scientific and Innovative
Research, 2013, 2 (3), 634-641.
[6] S Behera; S Ghanty; F Ahmad; S Santra; S Banerjee. J. Anal. Bioanal. Techniques., 2012, 3, 1-6 [7] R Shukla; R Shivkumar; KN Shivan. Bulletin of Pharmaceutical Research, 2011, 1(1), 62-66.
[8] H Padmalatha; G Vidyasagar. International Journal of Research in Pharmaceutical and Biomedical Sciences, 2011, 2 (3), 1261-1265
[9] FF Al-Qaim; MP Abdullah; MR Othman; Khalik WMA. Int. J. Chem. Sci., 2014, 12(1), 62-72. [10] FH Havaldar; DL Vairal. E-Journal of Chemistry, 2010, 7(S1), S495-S503.
[11] S Rathinam; KS Lakshmi. Int. J. Pharm. Pharm. Sci., 2014, 6(1), 585-589.
[12] K Naresh Reddy; SE Potawale; SY Gabhe; KR Mahadik. Der Pharmacia Sinica, 2013, 4(6), 16-21. [13] A Goyal; I Singhvi. Ind. J. Pharm. Sci., 2008, 70(1), 108-111.
[14] MA Badgujar; KV Mangaonkar. J. Chem. Pharm. Res., 2011, 3(4), 893-889.
[15] SD Shambharkar; PD Hamrapurkar. Asian Journal of Research in Chemistry, 2013, 6(10), 926-931.
[16] TK Patel; DB Meshram. International Journal of Pharmaceutical Sciences and Drug Research, 2015, 7(4), 361-364.
[17] International Conference on Harmonization (2005) ICH harmonized tripartite guideline Validation of analytical procedures: text and methodology Q2 (R1) ICH, Geneva, Nov (2005).